-
Incident report
-
Resolution: Cannot Reproduce
-
 Major
Major
-
None
-
2.0.0rc1
-
OS: CentOS 6.2 x86_64
DB: postgresql-server-8.4.9
Hardware: VMWare virtual machine with 2GB RAM and 2 vCPU
Zabbix server is running Yes localhost:10051
Number of hosts (monitored/not monitored/templates) 129 47 / 0 / 82
Number of items (monitored/disabled/not supported) 8344 4235 / 3533 / 576
Number of triggers (enabled/disabled)[problem/unknown/ok] 3360 3354 / 6 [39 / 0 / 3315]
Required server performance, new values per second 67.04 -
OS: CentOS 6.2 x86_64 DB: postgresql-server-8.4.9 Hardware: VMWare virtual machine with 2GB RAM and 2 vCPU Zabbix server is running Yes localhost:10051 Number of hosts (monitored/not monitored/templates) 129 47 / 0 / 82 Number of items (monitored/disabled/not supported) 8344 4235 / 3533 / 576 Number of triggers (enabled/disabled)[problem/unknown/ok] 3360 3354 / 6 [39 / 0 / 3315] Required server performance, new values per second 67.04 -
Hi, I'm using postgresql and the new 2.0 low level discovery to monitor some switches.
Everything is fine with most of them, the items are discovered and monitor fine without much load on the server. But one is a 9 unit stack with hundreds of ports.
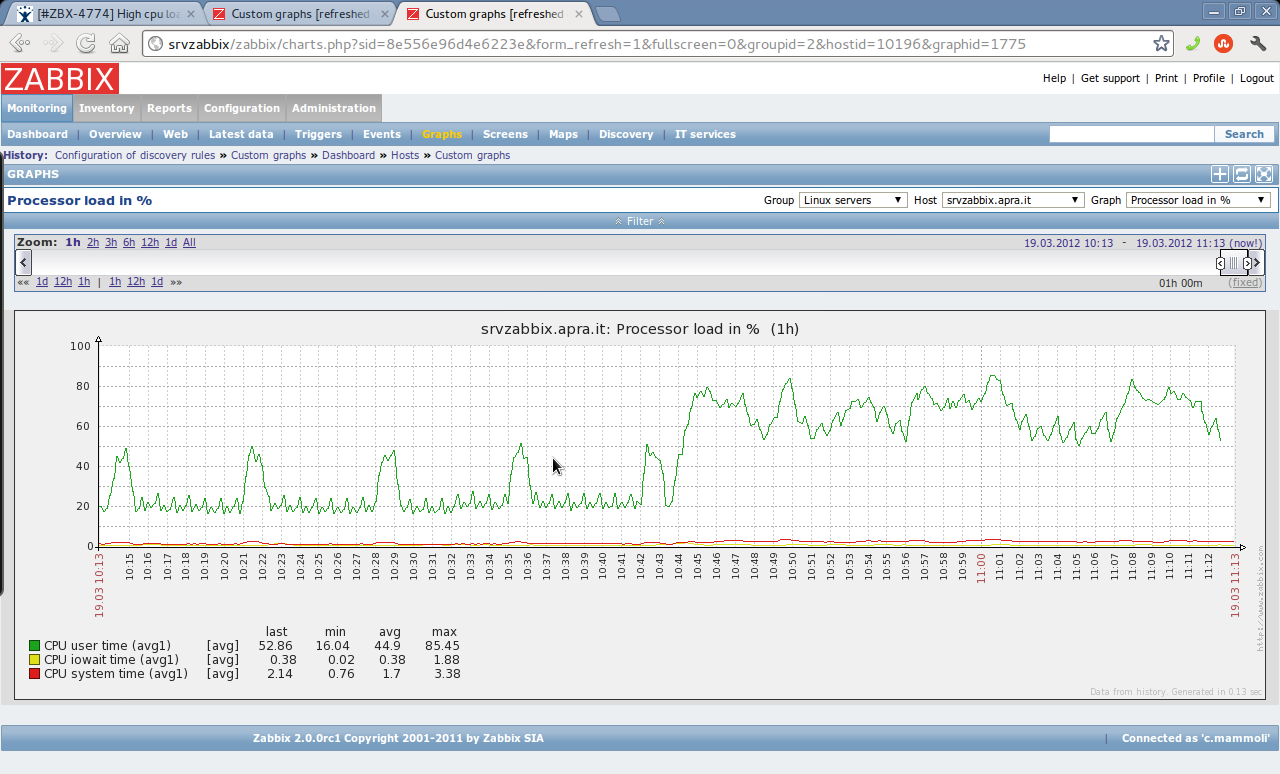
After discovery I have 5173 items and 2792 triggers. The database starts to eat CPU (more than 80% all the time) and the zabbix queue starts to fill up losing events...
The very strange thing is that this happens even if I keep all the items disabled!!! Just adding them to the host kills the db.
This didn't happen with 1.8 monitoring the same items (with a script generated template)