-
New Feature Request
-
Resolution: Unresolved
-
 Minor
Minor
-
None
-
None
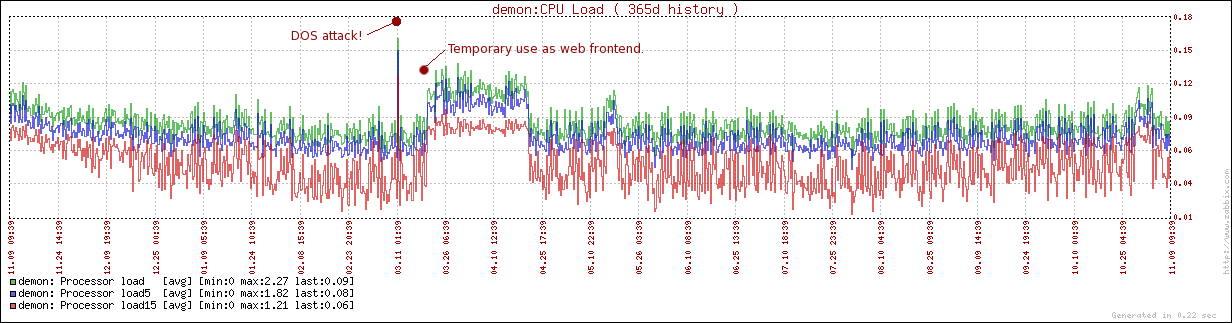
How about the possibility to add comments to graphs?
For example, when we have some issue and the graphs look different than normal, it would be nice if we could somehow attach a comment to that specific graph and time. For example "interface failed, internet connection down, DOS attack, etc".
Then, when we later look at trends and wonder what happened, we see the comment.
The comment could be displayed above the graph in the picture, listed below as text or as a popup together with small symbols in the graph, like !1, !2 etc. Or maybe somebody else have an even better idea...
- depends on
-
-

- Closed
-
- is duplicated by
-
-
- Closed
-
-
-
- Closed
-
-
-
- Closed
-
-
-
- Closed
-
-
-
- Closed
-
-
-

- Closed
-
-
-
- Closed
-
-
-
- Closed
-
-
-
- Closed
-