|
Duplicate |
|||
| duplicates |
|
Memory leaks in libcurl / libnss on R... | Closed |
[ZBX-12608] http pollers exhaust all memory available Created: 2017 Aug 25 Updated: 2017 Aug 26 Resolved: 2017 Aug 26 |
|
| Status: | Closed |
| Project: | ZABBIX BUGS AND ISSUES |
| Component/s: | Server (S) |
| Affects Version/s: | 3.0.10 |
| Fix Version/s: | None |
| Type: | Problem report | Priority: | Blocker |
| Reporter: | Clearvision Monitoring Team | Assignee: | Unassigned |
| Resolution: | Duplicate | Votes: | 0 |
| Labels: | httpcheck, httptest, memory, memoryleak, server, zabbix_server | ||
| Remaining Estimate: | Not Specified | ||
| Time Spent: | Not Specified | ||
| Original Estimate: | Not Specified | ||
| Attachments: |
|
||||||||
| Issue Links: |
|
||||||||
| Description |
|
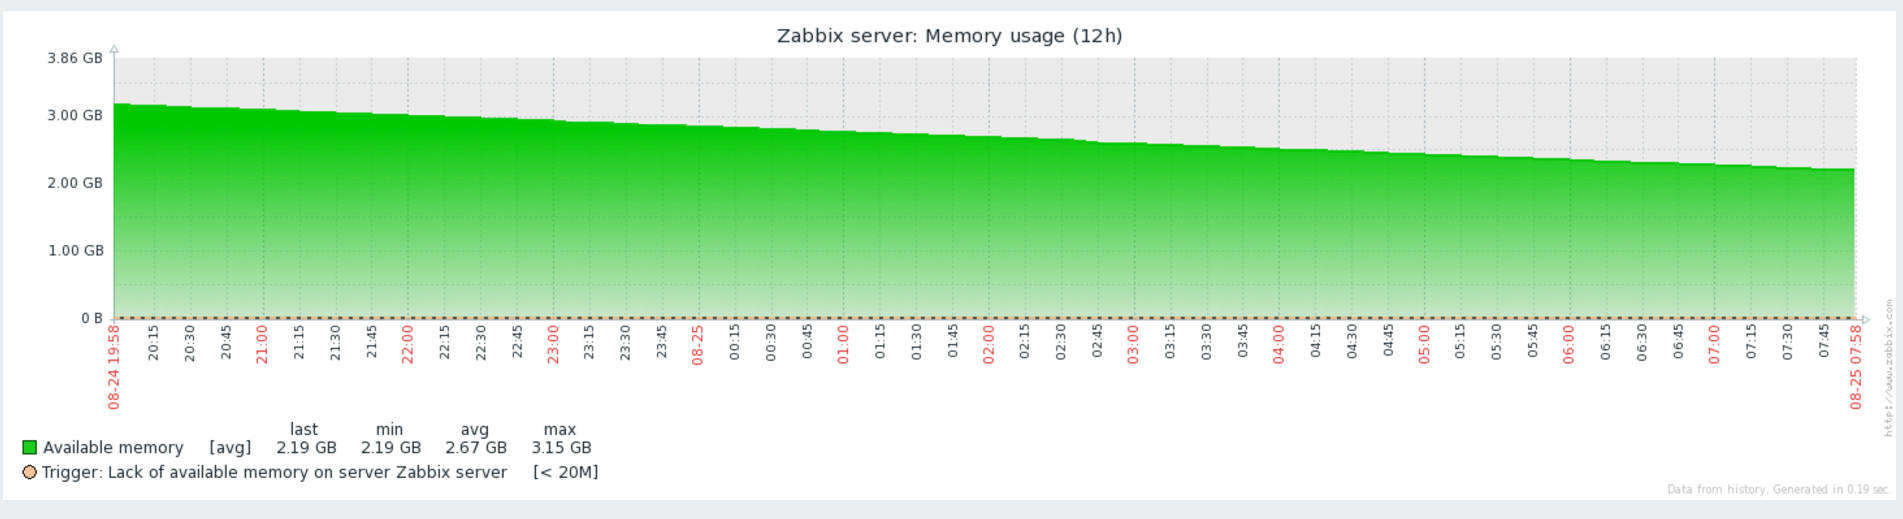
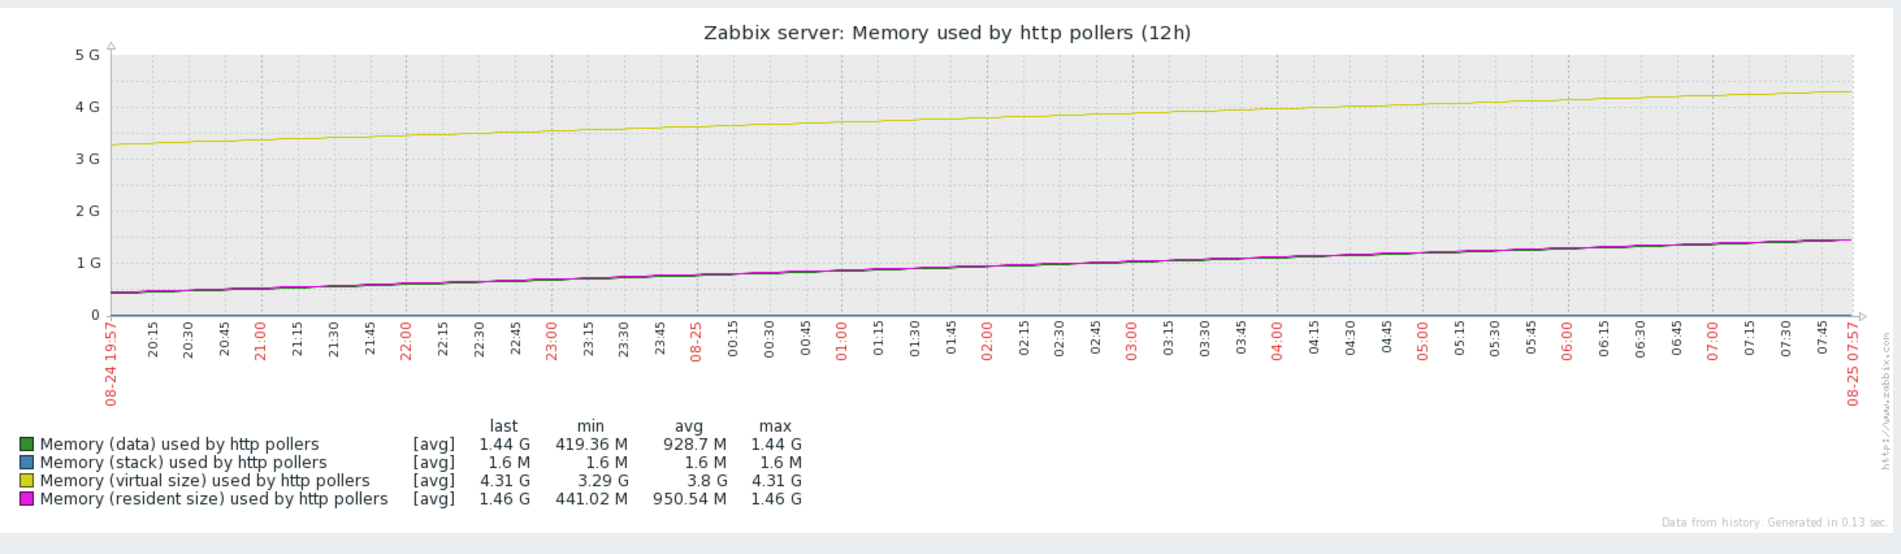
Hello all, The issue I'm experiencing is that http pollers memory usage grows over 1 or 2 days until it exhaust all the memory available in the VM and zabbix_server dies. Since this issue started, I've added more RAM to the VM: 1GB->2GB and again from 2GB->4GB yesterday. I use a template for web scenarios that are applied to a group of hosts. Every host that is monitored, has user macros with the URL that are used by the web scenario. In total, it monitors 90 URLs. Can anyone help to troubleshoot ? p.s. this was first raised on the forum: https://www.zabbix.com/forum/showthread.php?p=202815 |
| Comments |
| Comment by Clearvision Monitoring Team [ 2017 Aug 25 ] |
|
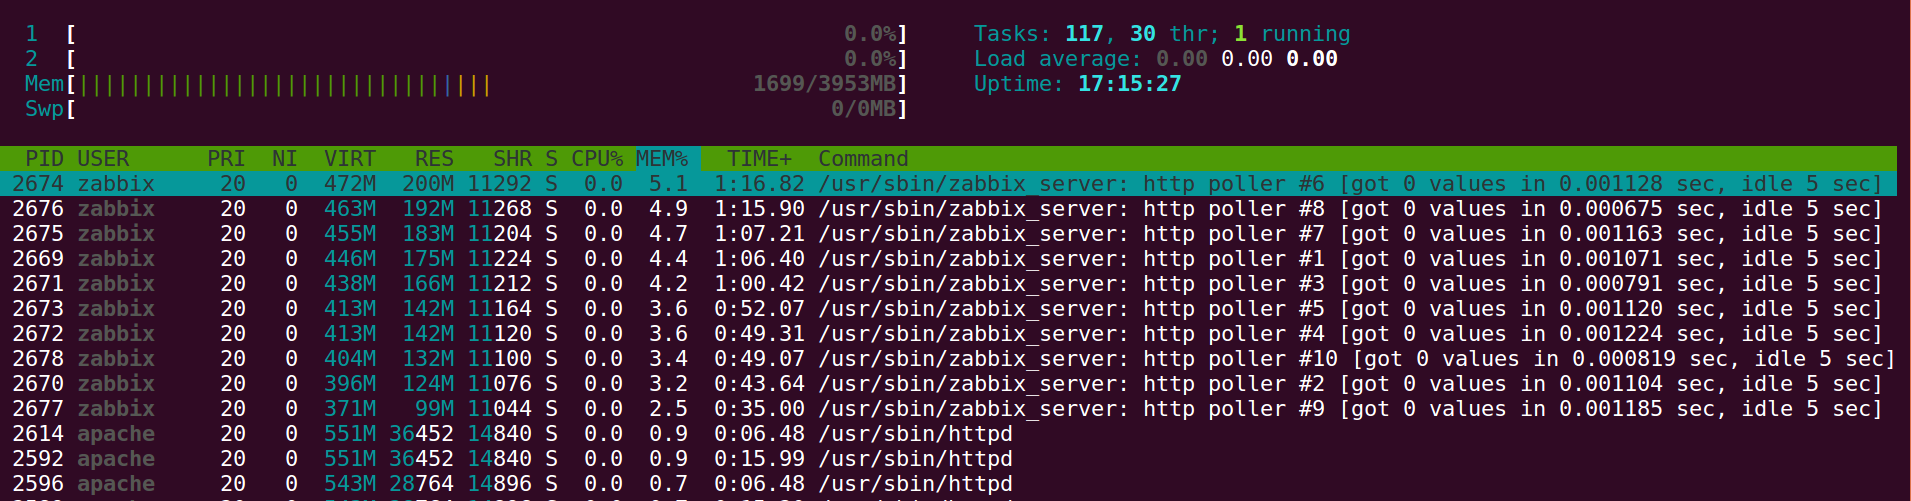
I've been reading maps, smaps and Memory Stats! by James Hunt and tried his diag on one of the http pollers (although the output looks very similar to other http pollers): $ sudo ./diag 2674 [heap]: private - [clean] 194.0 M [dirty] shared - [clean] 132.0 k [dirty] [mmap]: private - [clean] 124.0 k [dirty] shared 988.0 k [clean] 404.0 k [dirty] [stack]: private - [clean] 96.0 k [dirty] shared - [clean] - [dirty] [vvar]: private - [clean] - [dirty] shared - [clean] - [dirty] And a few minutes later, heap private has increased a few MBs: $ sudo ./diag 2674 [heap]: private - [clean] 197.7 M [dirty] shared - [clean] 132.0 k [dirty] [mmap]: private - [clean] 124.0 k [dirty] shared 988.0 k [clean] 404.0 k [dirty] [stack]: private - [clean] 96.0 k [dirty] shared - [clean] - [dirty] [vvar]: private - [clean] - [dirty] shared - [clean] - [dirty] |
| Comment by Clearvision Monitoring Team [ 2017 Aug 25 ] |
|
I've ran memleax to the same process above and something weird is happening. vso you could also try valgrind, when you stop server then it should report leaks.
valgrind --leak-check=full --trace-children=yes --track-origins=yes --max-stackframe=4000000 --read-var-info=yes --leak-resolution=high --log-file=/tmp/zabbix_server_valgrind.log ./sbin/zabbix_server -c /etc/zabbix/zabbix_server.conf --foreground
|
| Comment by Clearvision Monitoring Team [ 2017 Aug 25 ] |
|
Attaching the images that are mentioned on the initial description instead of the imgur link.
|
| Comment by Vladislavs Sokurenko [ 2017 Aug 25 ] |
|
Could you please try to reproduce this leak with minimal setup ? For example if you now have many steps in web scenario then just leave one. and see if it leaks ? |
| Comment by Clearvision Monitoring Team [ 2017 Aug 25 ] |
|
Thank you vso $ valgrind --leak-check=full --trace-children=yes --track-origins=yes --max-stackframe=4000000 --read-var-info=yes --leak-resolution=high --log-file=/tmp/zabbix_server_valgrind.log /usr/sbin/zabbix_server -c /etc/zabbix/zabbix_server.conf --foreground zabbix_server [28011]: cannot create PID file [/var/run/zabbix/zabbix_server.pid]: [13] Permission denied Then tried as root: $ sudo valgrind --leak-check=full --trace-children=yes --track-origins=yes --max-stackframe=4000000 --read-va r-info=yes --leak-resolution=high --log-file=/tmp/zabbix_server_valgrind.log /usr/sbin/zabbix_server -c /etc/zabbix/zabbix_server.conf --foreground zabbix_server [28013]: cannot run as root! Please advise. |
| Comment by Clearvision Monitoring Team [ 2017 Aug 25 ] |
|
As for the web scenario, we use one step for each URL. Unfortunately we don't have regular HTTP checks, just encrypted ones. |
| Comment by Glebs Ivanovskis (Inactive) [ 2017 Aug 25 ] |
|
Isn't it a duplicate of |
| Comment by Clearvision Monitoring Team [ 2017 Aug 25 ] |
|
Hi glebs.ivanovskis, So now I've run that leak binary that was attached to |
| Comment by Glebs Ivanovskis (Inactive) [ 2017 Aug 25 ] |
|
Yes, I suggest you experiment a bit with libcurl versions and flavours (OpenSSL/GnuTLS/NSS). However, I don't follow libcurl's development and don't know if they have actually fixed the leak. |
| Comment by Glebs Ivanovskis (Inactive) [ 2017 Aug 25 ] |
|
Closing as Duplicate of |