[ZBX-13197] Wrong SLA calculation Created: 2017 Dec 14  Updated: 2023 Oct 07

Status: Need info
Project: ZABBIX BUGS AND ISSUES
Component/s: API (A), Frontend (F)
Affects Version/s: 3.4.4
Fix Version/s: None

Type: Incident report Priority: Trivial
Reporter: Grzegorz Grabowski Assignee: Zabbix Development Team
Resolution: Unresolved Votes: 6
Labels: services, sla
Remaining Estimate: Not Specified
Time Spent: Not Specified
Original Estimate: Not Specified
Environment:

Centos 7, MariaDB. Full updated.


Attachments: JPEG File SLA.JPG     PNG File services.png     JPEG File services2.JPG     JPEG File services3.JPG     JPEG File services4.JPG    
Issue Links:
Duplicate
is duplicated by ZBX-15696 
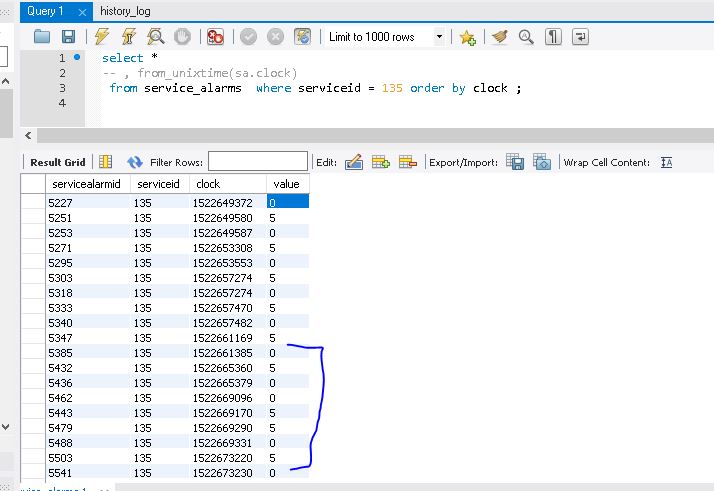
Wrong SLA calculation on 4.0.4 and 4.... Closed
Sub-task
depends on ZBX-17188 Problems with negative duration are c... Open
depends on ZBX-13309 Problem/Recovery time is wrong Closed

 Description   

Don't know how to reproduce it, but we've got situation you can see on attachment.
What I can check to help you discover what is going on.
SLA calculation in this case should show 100%.
On screen 3 you can see history of this service.


 Comments   
Comment by Olegs Vasiljevs (Inactive) [ 2017 Dec 14 ]

Hello Grzegorz!

You can search for multiple lines with value="0" from query below. It would look like consecutive entries with value="0" going one after another. That is, in order to fix the issue.

select from_unixtime(sa.clock), sa.* from service_alarms sa where serviceid = <problematic service> order by clock DESC limit 1000;

Have you installed 3.4.3 when it was available or gone straight to 3.4.4? When were these recent updates installed? The reason why I'm asking is that this issue was addressed in ZBX-10547 and fix firstly was introduced in 3.4.3 in 3.4 branch. It matters when the issue emerged - before or after updates were installed.

Regards,
Oleg

Comment by Grzegorz Grabowski [ 2017 Dec 14 ]

There was no update from 3.4.3 to 3.4.4. Te upgrade was from 3.2.9 to 3.4.4-1 and then to 3.4.4-2 (from repo).
On the next printscreen resultat from this query.

Comment by Olegs Vasiljevs (Inactive) [ 2017 Dec 14 ]

When was the upgrade made from 3.2.9 to 3.4.4-1 and then to 3.4.4-2 (from repo)?

From the screenshot attached - first and second line indicate the beginning of an issue. Event recovery and problem states were written in reverse order. This may have happened due to ZBX-10547 why I ask when update was done or database performance issues.

Regards,
Oleg

Comment by Vladislavs Sokurenko [ 2017 Dec 14 ]

At that time there should have been item that caused problem and then recovery after 8 seconds, could you please provide information what type of item it was.

Also if possible, can you please provide history for this item near that time ? 11:53:22 - 11:53:30

select * from history_uint where itemid=<your item id> and clock=1512384810;
select * from history_uint where itemid=<your item id> and clock=1512384802;

It would be nice to have events for that trigger as well.

select * from events where objectid=<your triggerid>;

this data should also be visible through frontend.

Comment by Grzegorz Grabowski [ 2017 Dec 14 ]

Ok, I will, but you have to wait a little bit. When I saw this issue, I removed the item (service child node) and recreate it.
Need to restore db from backup on test environment.

Comment by Vladislavs Sokurenko [ 2017 Dec 14 ]

was it agent passive check ? Could it be that first value came with time stamp11:53:30, while next one with 11:53:22 ?

Comment by Rostislav Palivoda [ 2018 Jan 31 ]

Any updates? - mbsit

Comment by Vladislavs Sokurenko [ 2018 Jan 31 ]

This one might be related:
ZBX-13309

Comment by Christian Anton [ 2018 Mar 05 ]

Having the same problem here. From my point of view, it definitely has to do with ZBX-13309.

Apparently, a Service's SLA calculation goes through the events one-by-one in the timeline. Let's assume we have two problems for the trigger this service depends on, both 5 minutes of duration, one at some day at 9, and the other one day later, also at 9, where the first of the problems is one of such described in ZBX-13309 where the timestamp of the "Problem" event is actually AFTER the timestamp of the "Recovery" event.

What seems to happen in such a case is that SLA calculation "sees" the "Problem" event of the first event and assumes the service to be "Down" until there is a Recovery event of the same Trigger, which in this case would be the Recovery event of the Problem occurred one day after. That means, instead of two times short downtime, the Service will state 1 day and something of downtime.

Comment by Grzegorz Grabowski [ 2018 Apr 24 ]

Guys, I'm bored to correct that mess every week for 5-6 SLA Services....

Any chance to find what is going on?

Comment by Vladislavs Sokurenko [ 2018 Apr 24 ]

Did you have a change to look at ZBX-13309, do you think it's same issue ?

Comment by Celso Ishikawa [ 2019 Feb 20 ]

Tested versions 4.0.4 and 4.0.5 rc1 and found the same issue here...

It was OK until 4.0.2 and 4.0.3.

I solved provisionally by using "CServicesSlaCalculator.php" file of v4.0.2 just replacing it on v4.0.5 Front-End on dir (..)/include/classes/services/.

Hope this issue to be solved on official 4.0.5 release version.

Comment by Arturs Lontons [ 2019 Feb 20 ]

Aslo reported on 4.0.4 and 4.0.5rc1 inĀ  ZBX-15696.

Generated at Tue Apr 01 18:01:46 EEST 2025 using Jira 9.12.4#9120004-sha1:625303b708afdb767e17cb2838290c41888e9ff0.