[ZBX-13251] Problem with calculated min Y and max Y in graph zabbix 3.4 Created: 2017 Dec 23 Updated: 2018 Jan 02 Resolved: 2018 Jan 02 |
|
| Status: | Closed |
| Project: | ZABBIX BUGS AND ISSUES |
| Component/s: | Frontend (F) |
| Affects Version/s: | 3.0.13 |
| Fix Version/s: | None |
| Type: | Problem report | Priority: | Major |
| Reporter: | ePawel | Assignee: | Unassigned |
| Resolution: | Fixed | Votes: | 0 |
| Labels: | graphs | ||
| Remaining Estimate: | Not Specified | ||
| Time Spent: | Not Specified | ||
| Original Estimate: | Not Specified | ||
| Environment: |
Centos 7 |
||
| Attachments: |
|
| Description |
|
Hi Create graph: why the graph does not fit the line? |
| Comments |
| Comment by ePawel [ 2017 Dec 23 ] |
|
vertices of the curve should determine the boundaries of the graph |
| Comment by Alexey Pustovalov [ 2017 Dec 23 ] |
|
Hello! Zabbix does not use max and min of data points as Y axis max/min. It calculates to fit the graph with optimal scale. Kind regards, |
| Comment by ePawel [ 2017 Dec 23 ] |
|
In the picture axis Y scale is min 18.5 to max 21.5 but line data point min/max is 19.96 to 20.22, why graph have not the same scale as data pointa? |
| Comment by Olegs Vasiljevs (Inactive) [ 2017 Dec 27 ] |
|
Hello ePawel! I'm sure that this is done intentionally in order to provide a better readability of a graph. P.S. Also, it is not clear whether the affected version is 3.4 or 3.0, since you have different information provided in the summary and affected version field. The above screenshot is from 3.0. Regards, |
| Comment by ePawel [ 2018 Jan 02 ] |
|
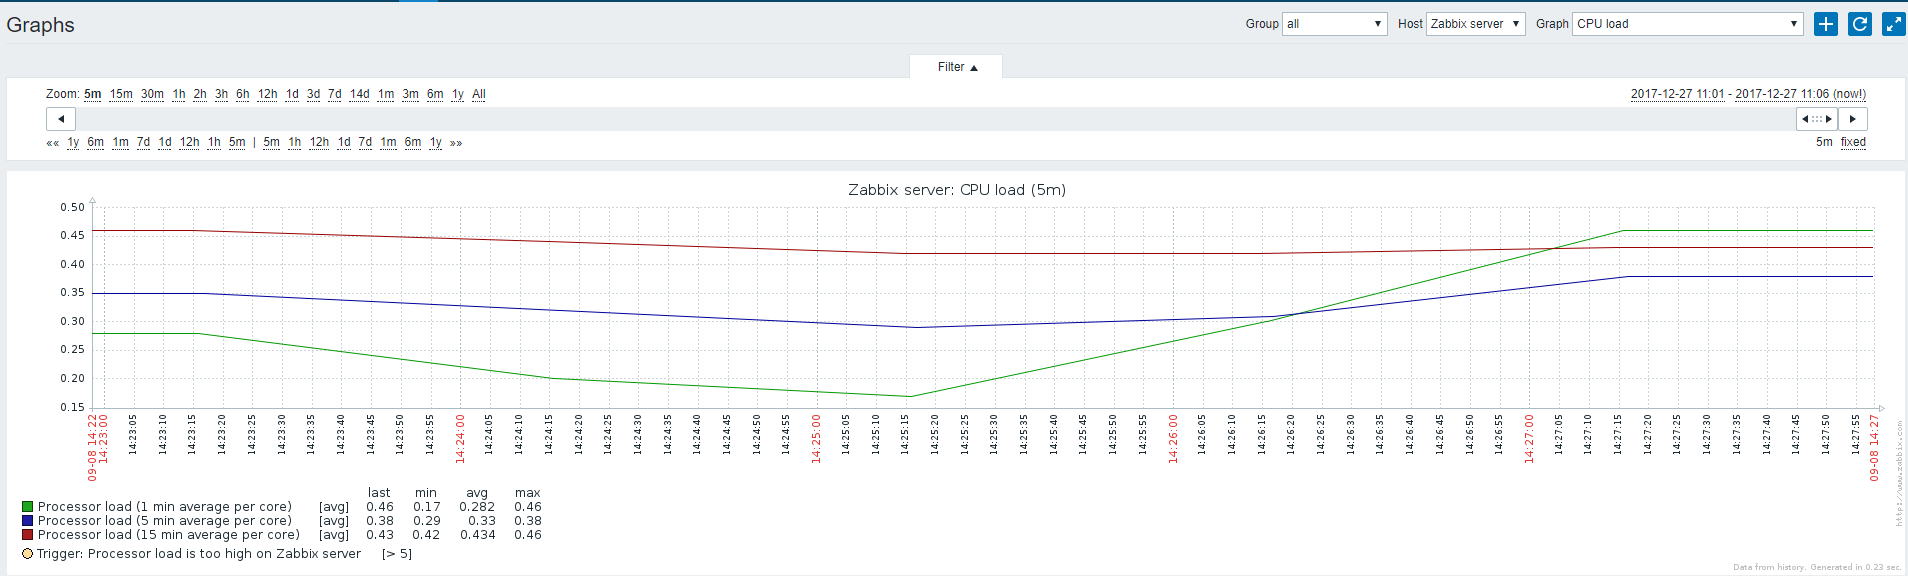
I had the same problem in ver. 3.0.13 and 3.4
and I have received graph with nice better scale in Y (You can see on the diagram from today) |
| Comment by Olegs Vasiljevs (Inactive) [ 2018 Jan 02 ] |
|
Hello epawel! This only affects web frontend's visualization features, therefore should not have an impact on the real data stored. Closing the ticket as won't fix. Regards, |
| Comment by ePawel [ 2018 Jan 02 ] |
|
Hi! |