|
Would be nice if you could provide more information. Timestamps and values from Latest Data, configuration of this host, whether it is monitored by proxy, etc.
|
|
Ill give you my details. So I am running 3.4.8. The affected device is a HP 5406 chassis, its reporting to a Zabbix 3.4.8 proxy server on the same subnet that is uploading data to a cloud based zabbix server.
Hosting using Template Module Interfaces SNMPv2
Ill have to post latest data when the error occurs. Its not all the time. I see on the forum post someone was able to post the last reported data over the last 10 reports (with one missing), I don't know how to do that, any advice.
Discovered by Network Interfaces Discovery
Name: Interface G3(HV-1-SAN-C): Outbound packets with errors
Type: SNMPv2 agent
Key: net.if.in[ifHCInOctets.147]
Host interface: x.x.x.x:161
SNMP OID: 1.3.6.1.2.1.31.1.1.1.6.147
SNMP community: {$SNMP_COMMUNITY}
Port: None
Type of information: Numeric (unsigned)
Units: bps
Update interval: 90
Preprocessing steps
Change Per second: None
Custom Mutipler: 8
|
|
Worked it out
| 2018-05-09 02:59:21 |
187524296 |
| 2018-05-09 02:57:51 |
66764336 |
| 2018-05-09 02:54:51 |
71588552 |
| 2018-05-09 02:53:21 |
280173200 |
| 2018-05-09 02:50:21 |
121875440 |
| 2018-05-09 02:47:21 |
132102304 |
| 2018-05-09 02:45:51 |
112858968 |
| 2018-05-09 02:42:51 |
330531960 |
| 2018-05-09 02:41:21 |
9797556962 |
| 2018-05-09 02:38:20 |
274610176 |
| 2018-05-09 02:35:21 |
153010360 |
| 2018-05-09 02:32:21 |
151595920 |
| 2018-05-09 02:29:20 |
147849032 |
| 2018-05-09 02:27:51 |
143718168 |
| 2018-05-09 02:24:51 |
168815440 |
| 2018-05-09 02:23:21 |
142380640 |
| 2018-05-09 02:20:21 |
189396016 |
| 2018-05-09 02:54:51 |
71588552 |
| 2018-05-09 02:53:21 |
280173200 |
| 2018-05-09 02:50:21 |
121875440 |
| 2018-05-09 02:47:21 |
132102304 |
| 2018-05-09 02:45:51 |
112858968 |
| 2018-05-09 02:42:51 |
330531960 |
| 2018-05-09 02:41:21 |
97975569624 |
| 2018-05-09 02:38:20 |
274610176 |
| 2018-05-09 02:35:21 |
153010360 |
| 2018-05-09 02:32:21 |
151595920 |
| 2018-05-09 02:29:20 |
147849032 |
| 2018-05-09 02:27:51 |
143718168 |
| 2018-05-09 02:24:51 |
168815440 |
| 2018-05-09 02:23:21 |
142380640 |
| 2018-05-09 02:20:21 |
189396016 |
|
I see on the forum post someone was able to post the last reported data over the last 10 reports (with one missing), I don't know how to do that, any advice.
If you mean this post then it's probably directly from the database, but you can get a similar result by going to Latest Data, selecting item, clicking Graph and choosing Values from the dropdown on the right.
|
|
Can you please create a clone of this item with the same SNMP OID but without any preprocessing steps and provide Latest Data for both items when the issue happens again?
|
|
Sorry for delay I was rest of yesterday. OK I have 3 ports running clones without pre-processing. They'll most likely fail tonight so Ill come back to you asap
|
|
Great! Thank you!
|
|
Ok This is the first reading. Over data reported @ 23:02 on Failed Data chart. It does look like it missing the previous reading which is what one of the posters from the forum mentioned. There is nothing in the proxy logs. There's a slow query in the server logs kind of at the same time but it doesn't say anything obvious to indicate its to do with this.
| Time |
Failed Data |
|
Time |
Test Data |
| 10/05/2018 23:09:56 |
48457512 |
|
10/05/2018 23:06:02 |
120913509267457 |
| 10/05/2018 23:08:25 |
48371264 |
|
10/05/2018 23:04:32 |
120913174388169 |
| 10/05/2018 23:06:56 |
41859016 |
|
10/05/2018 23:03:03 |
120912874257789 |
| 10/05/2018 23:05:26 |
20095656 |
|
10/05/2018 23:01:32 |
119813994206077 |
| 10/05/2018 23:02:25 |
98309903584 |
|
10/05/2018 23:00:02 |
119816316961101 |
| 10/05/2018 22:59:26 |
43824336 |
|
10/05/2018 22:58:32 |
119815816472114 |
| 10/05/2018 22:57:55 |
45175536 |
|
10/05/2018 22:57:02 |
119815291458019 |
| 10/05/2018 22:56:26 |
34115928 |
|
10/05/2018 22:55:32 |
119814907606985 |
| 10/05/2018 22:54:55 |
39643584 |
|
10/05/2018 22:54:02 |
119814510481838 |
| 10/05/2018 22:53:25 |
47313456 |
|
10/05/2018 22:52:32 |
119814048185478 |
|
|
Second one. There appears to be much more test data than failed data. There is nothing about slow querys in the server logs for this one.
Over data @ 06:36:53
| Time |
Failed Data |
|
Time |
Test Data |
| 11/05/2018 06:56:23 |
237663560 |
|
11/05/2018 06:49:35 |
211072071464913 |
| 11/05/2018 06:51:53 |
235625200 |
|
11/05/2018 06:48:04 |
211073795021416 |
| 11/05/2018 06:48:53 |
229773712 |
|
11/05/2018 06:46:35 |
211075499393363 |
| 11/05/2018 06:44:23 |
221192616 |
|
11/05/2018 06:45:05 |
211072974657304 |
| 11/05/2018 06:41:23 |
222661424 |
|
11/05/2018 06:43:34 |
211074768869718 |
| 11/05/2018 06:38:23 |
221793520 |
|
11/05/2018 06:42:08 |
211072383816007 |
| 11/05/2018 06:36:53 |
97791437408 |
|
11/05/2018 06:40:35 |
211074119768186 |
| 11/05/2018 06:33:53 |
218237136 |
|
11/05/2018 06:39:05 |
211075912833067 |
| 11/05/2018 06:30:53 |
218123640 |
|
11/05/2018 06:37:35 |
211073423217248 |
| 11/05/2018 06:27:53 |
217027544 |
|
11/05/2018 06:36:05 |
211075227362285 |
| 11/05/2018 06:23:23 |
216961152 |
|
11/05/2018 06:34:35 |
209973262031608 |
| 11/05/2018 06:20:23 |
216715664 |
|
11/05/2018 06:33:04 |
209975091415476 |
| 11/05/2018 06:17:23 |
215240992 |
|
11/05/2018 06:31:35 |
209972624700366 |
| |
|
|
11/05/2018 06:30:05 |
209974483424183 |
| |
|
|
11/05/2018 06:28:35 |
209976311711711 |
| |
|
|
11/05/2018 06:27:08 |
209973958222328 |
| |
|
|
11/05/2018 06:25:35 |
209975715311268 |
| |
|
|
11/05/2018 06:24:04 |
209973263367902 |
| |
|
|
11/05/2018 06:22:35 |
209975149573386 |
| |
|
|
11/05/2018 06:21:04 |
209972684698869 |
| |
|
|
11/05/2018 06:19:35 |
209974551240839 |
| |
|
|
11/05/2018 06:18:04 |
209976370928652 |
| |
|
|
11/05/2018 06:16:35 |
209973938298568 |
|
|
I've slightly rearranged your data:
| Time |
Delta item |
Raw item |
| 11/05/2018 06:56:23 |
237663560 |
|
| 11/05/2018 06:51:53 |
235625200 |
|
| 11/05/2018 06:49:35 |
|
211072071464913 |
| 11/05/2018 06:48:53 |
229773712 |
|
| 11/05/2018 06:48:04 |
|
211073795021416 |
| 11/05/2018 06:46:35 |
|
211075499393363 |
| 11/05/2018 06:45:05 |
|
211072974657304 |
| 11/05/2018 06:44:23 |
221192616 |
|
| 11/05/2018 06:43:34 |
|
211074768869718 |
| 11/05/2018 06:42:08 |
|
211072383816007 |
| 11/05/2018 06:41:23 |
222661424 |
|
| 11/05/2018 06:40:35 |
|
211074119768186 |
| 11/05/2018 06:39:05 |
|
211075912833067 |
| 11/05/2018 06:38:23 |
221793520 |
|
| 11/05/2018 06:37:35 |
|
211073423217248 |
| 11/05/2018 06:36:53 |
97791437408 |
|
| 11/05/2018 06:36:05 |
|
211075227362285 |
| 11/05/2018 06:34:35 |
|
209973262031608 |
| 11/05/2018 06:33:53 |
218237136 |
|
| 11/05/2018 06:33:04 |
|
209975091415476 |
| 11/05/2018 06:31:35 |
|
209972624700366 |
| 11/05/2018 06:30:53 |
218123640 |
|
| 11/05/2018 06:30:05 |
|
209974483424183 |
| 11/05/2018 06:28:35 |
|
209976311711711 |
| 11/05/2018 06:27:53 |
217027544 |
|
| 11/05/2018 06:27:08 |
|
209973958222328 |
| 11/05/2018 06:25:35 |
|
209975715311268 |
| 11/05/2018 06:24:04 |
|
209973263367902 |
| 11/05/2018 06:23:23 |
216961152 |
|
| 11/05/2018 06:22:35 |
|
209975149573386 |
| 11/05/2018 06:21:04 |
|
209972684698869 |
| 11/05/2018 06:20:23 |
216715664 |
|
| 11/05/2018 06:19:35 |
|
209974551240839 |
| 11/05/2018 06:18:04 |
|
209976370928652 |
| 11/05/2018 06:17:23 |
215240992 |
|
| 11/05/2018 06:16:35 |
|
209973938298568 |
It is very strange that raw value goes up and down, as it was coming from two different sources...
Zabbix has a built-in logic to ignore negative values of delta calculations – this is why we see less values for delta item.
I'm not very experienced with SNMP, but it seems that the only way to get to the bottom of the problem is to sniff network traffic between Zabbix and your device.
|
|
Since you are using 3.4 please change the type of your original item to be Dependent on the raw value item you've just added. We will get "synchronized" values this way and hopefully will be able to make more sense of them.
|
|
I wonder if Ive done something wrong then. Let me try once more a different way of getting the data.
|
|
To me this looks so strange, that I start to suspect some sort of device bug. After all, you are not the only one experiencing such troubles.
|
|
Just to confirm, when I clone the item it say
Item with key "net.if.out[ifHCOutOctets.150]" already exists on "TGS CORE SWITCH 5400"
I assume I can pick a random number for OutOctet?
|
|
For SNMP and dependent items you can choose any key, it just has to be unique on the host/template level.
|
|
Oh ok, then I haven't cocked up, phew. Ill try and do the dependent link then. I was going to clone the host completely but remove the preprocessing from the cloned host items.
Ill do that as well as cloning the item and doing the dependency
Tim
|
|
Thank you!
By the way, do you see this happening on just one host or are there other devices affected? Any similarities between them?
|
|
Does this look ok?
|
|
Yes I do see it on an edge switch but not as often and havent been able to catch it. The core switch that I'm getting most of the logs from is a HP 5406 and its the SAN VLAN that triggers during backup time. The edge switches are 10Gb HP 1950s. There is a CCTV cluster attached to one of the edge switches and if there is a lot of CCTV traffic that will sometimes triggers as well.
|
Does this look ok?
Yes, if master item has no preprocessing and dependent item has Change per second and Multiplier 8.
|
|
Ah Ive got it the wrong way around then. That was showing the test without pre-processing as being the dependant to the original entry.
Ill swap them around
Tim
|
|
Latest data should be similar to your previous comments, but with both values collected at the same time.
|
|
OK. Ive just realised because the original items are auto discovery items I can not edit them. So are you saying the way I had it configured will be ok with the clone being the none pre-processing dependant with the original auto discovery item (with pre-processing) being the master?)
|
|
No, this way both values will be the same, both pre-processed.
|
|
ok, Ill disable the discovery items and create new failing pre-processing items and then create the non-pre-processing items there after.
|
|
More data, event is 14:49:32. The times aren't the same building up to it.
| 14/05/2018 14:44:01 |
15624040 |
|
14/05/2018 14:44:01 |
158297854454829 |
| 14/05/2018 14:42:32 |
16237168 |
|
14/05/2018 14:42:32 |
158297679859961 |
| 14/05/2018 14:41:01 |
50951496 |
|
14/05/2018 14:41:01 |
158297496086552 |
| 14/05/2018 14:39:32 |
97298225296 |
|
14/05/2018 14:39:32 |
158296926293136 |
| 14/05/2018 14:38:01 |
17208488 |
|
14/05/2018 14:38:01 |
157196886691440 |
| 14/05/2018 14:36:31 |
27953072 |
|
14/05/2018 14:36:31 |
157196692922274 |
| 14/05/2018 14:33:31 |
22706408 |
|
14/05/2018 14:35:02 |
157196379062260 |
| 14/05/2018 14:32:02 |
48799856 |
|
14/05/2018 14:33:31 |
157199818398181 |
| 14/05/2018 14:30:32 |
114744000 |
|
14/05/2018 14:32:02 |
157199563359264 |
|
|
There is simply one value missing for "delta item" (it would have been negative and Zabbix ignored it):
| Time |
Delta item |
Raw item |
| 14/05/2018 14:44:01 |
15624040 |
158297854454829 |
| 14/05/2018 14:42:32 |
16237168 |
158297679859961 |
| 14/05/2018 14:41:01 |
50951496 |
158297496086552 |
| 14/05/2018 14:39:32 |
97298225296 |
158296926293136 |
| 14/05/2018 14:38:01 |
17208488 |
157196886691440 |
| 14/05/2018 14:36:31 |
27953072 |
157196692922274 |
| 14/05/2018 14:35:02 |
|
157196379062260 |
| 14/05/2018 14:33:31 |
22706408 |
157199818398181 |
| 14/05/2018 14:32:02 |
48799856 |
157199563359264 |
| 14/05/2018 14:30:32 |
114744000 |
|
But the big picture is the same – there is a huge jump in raw value...
|
|
Ha, it's starting to make some kind of sense, look:
- 158296926293136 − 157196886691440 = 1100039601696
- 110003960169610 = 10000000000111101110000011111000100002 (note that lonely 1 in the highest order!)
- 111101110000011111000100002 = 6475752010 (ignoring that faulty bit)
- 64757520 / 90 seconds × 8 bits per octet = 5756224 bps ≃ 5.5 Mbps (which kinda makes sense)
Could it be that bits in counters just "flip" randomly from time to time?
|
|
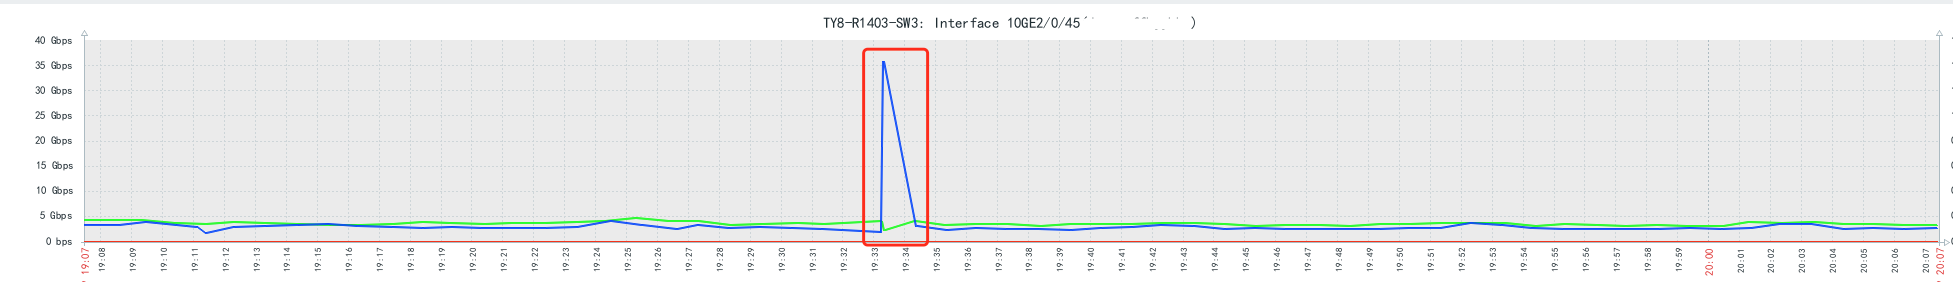
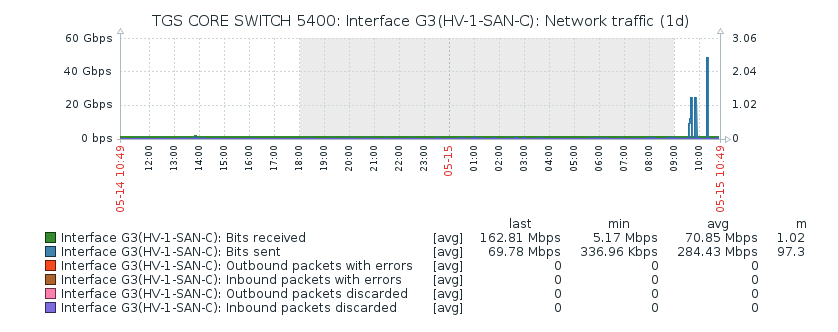
Dear timguyuk, do your graphs look like this one?
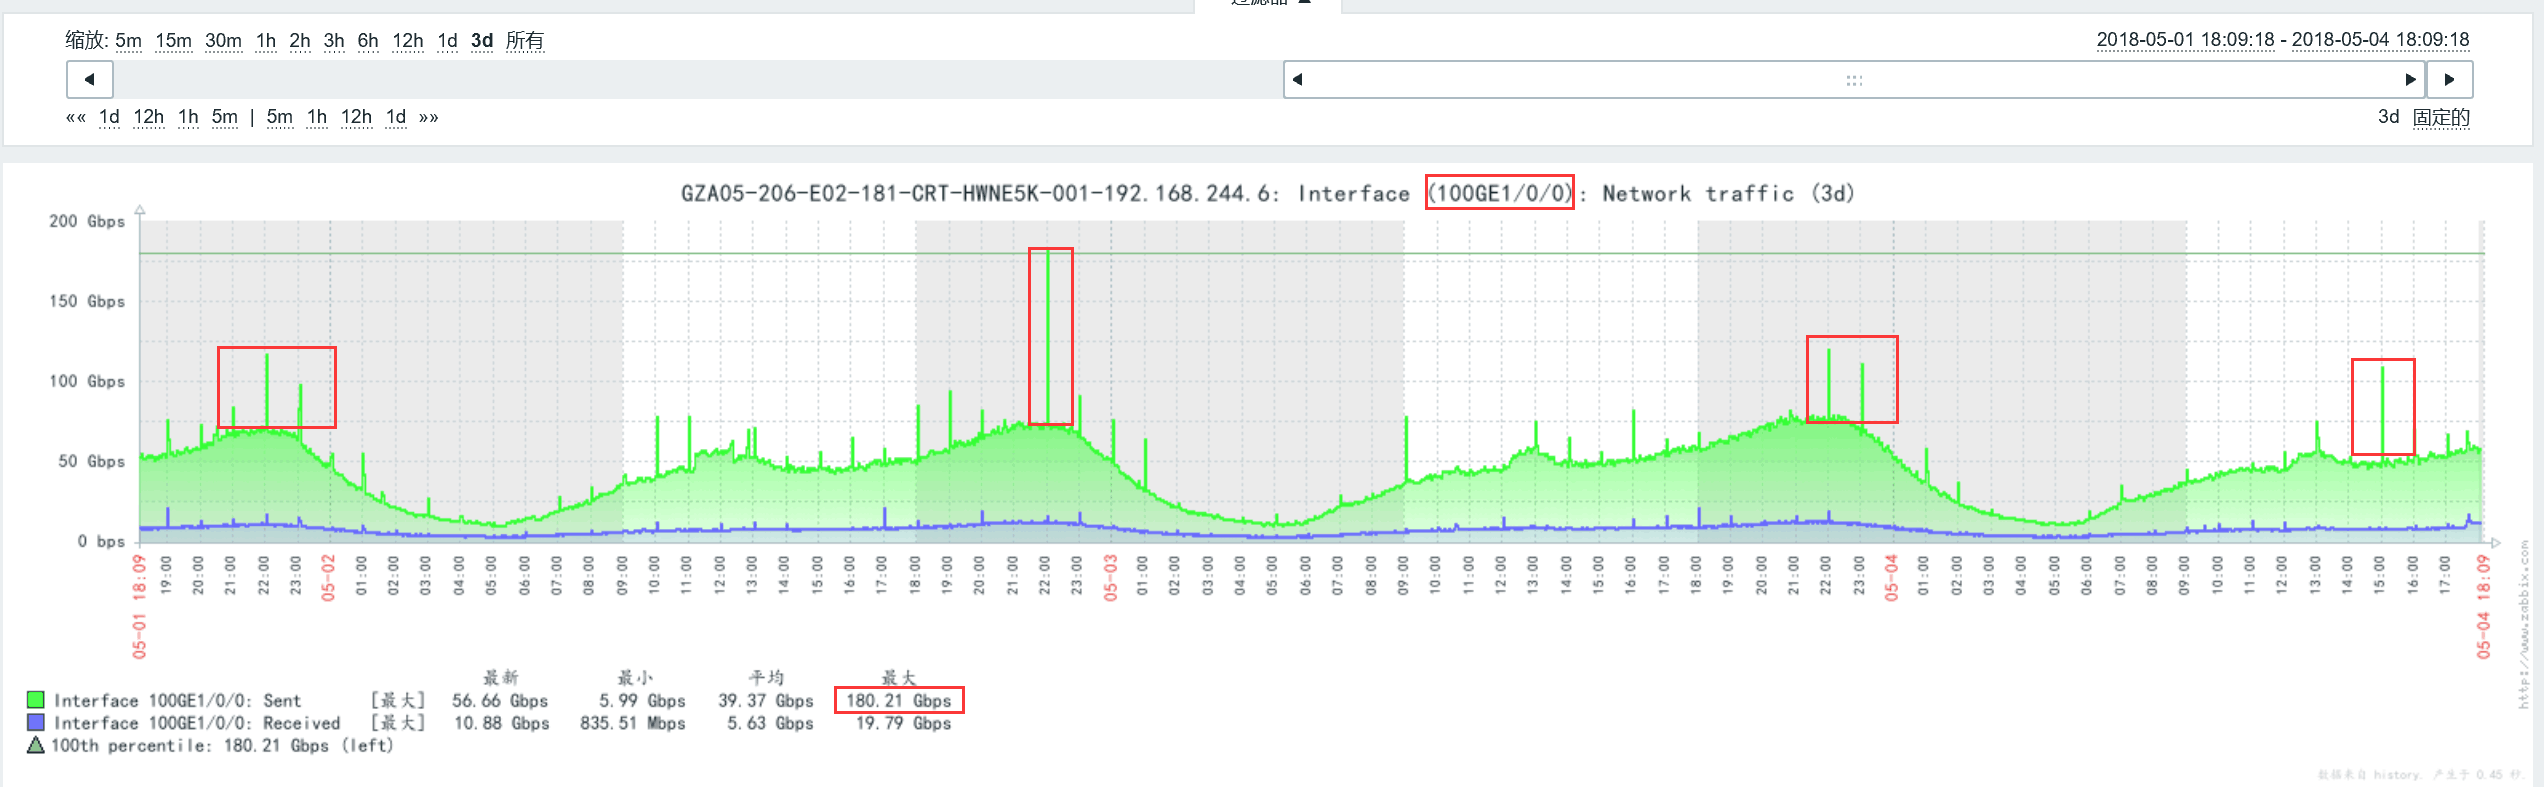
|
|
Simular yes although the jump is so high that it appears like the other data is flat, it isn't, just the averages with the big jump cancel them out.
|
|
Thanks for you help on this.
So Is it zabbix or do you think its the snmp device?
Tim
|
|
As we see, Zabbix correctly calculates speed per second from raw values it gets. Raw values cause the issue. So there could be two explanations:
- Zabbix incorrectly gets raw values
- SNMP device returns incorrect values
According to your data there is a step in raw values after which all gets back to normal. This would mean that Zabbix starts getting values incorrectly and then continues to get values incorrectly. This is highly unlikely and therefore I don't believe that first option explains the issue well enough.
On the other hand SNMP implementation in switches and routers is typically low level, very close to hardware. And probably hardware itself is a bit simplified if we compare it to server and desktop computers. I suppose it is a plausible explanation that from time to time certain physical factors like voltage spike in the mains can cause glitches in SNMP layer.
|
|
There was the same problem, tell please how you solved it?
|
|
Same problem here
I think the problem related to zabbix not device,
because we have a cacti and there isn't any abnormal pic on same interface at same time
|
|
The same problem requires a solution.
|
|
same problem, can provide the necessary data
problem not only snmp, but with delta values processing
|
|
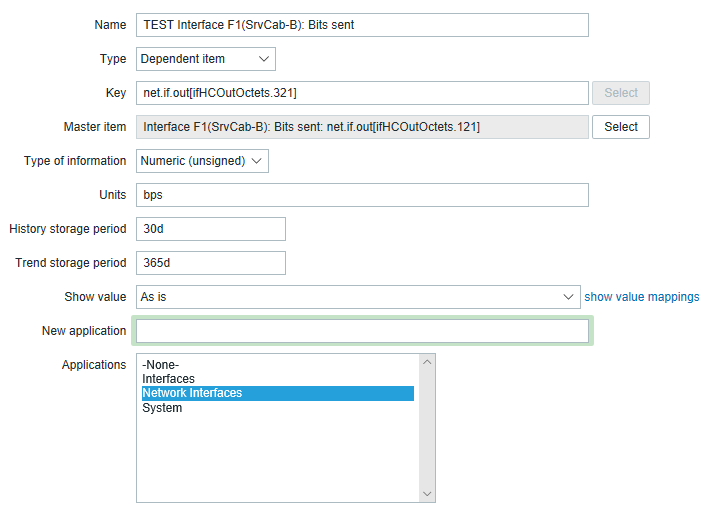
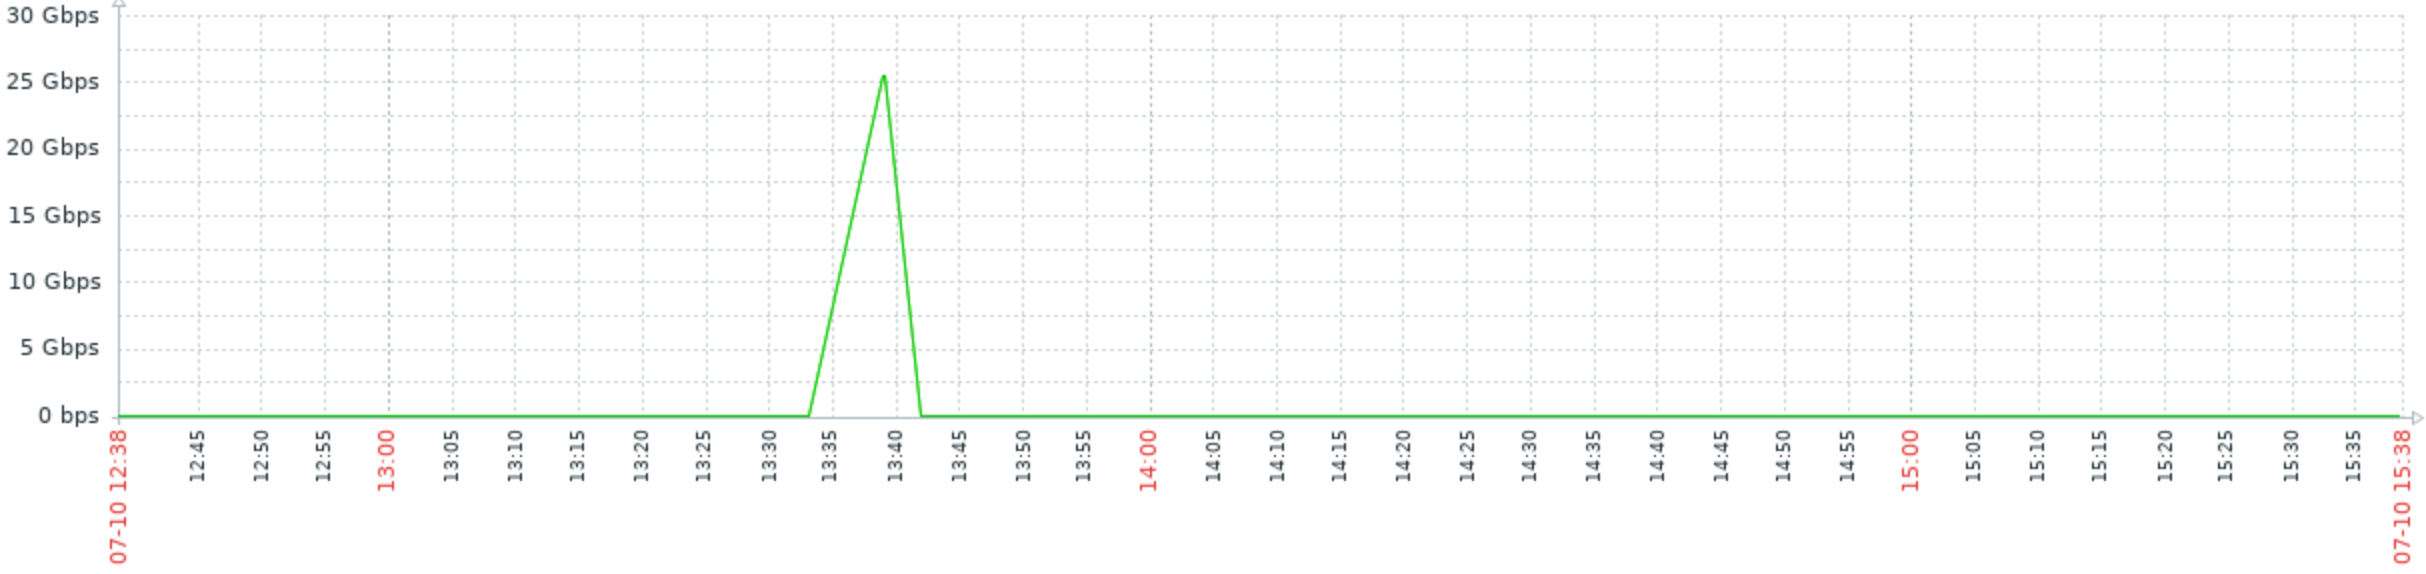
Same problem here, on Zabbix 4.2.4.
See attached graph for a 1 Gbps interface, coming from Template Module Interfaces SNMPv2, Item prototype "Interface {#IFNAME}({#IFALIAS}): Bits sent".
The values around the time of the spike are:
| 2019-07-10 13:42:16 |
297088 |
| 2019-07-10 13:39:16 |
25429052040 |
| 2019-07-10 13:33:20 |
661456 |
With an interval of 3 minutes, you can see the data is missing around 13:36.
|
|
Added to known issues for 3.0, 4.0, 4.4, 5.0.
|
|
Hi Martins Valkovskis, could you please clarify the status of this defect ZBX-14318 which is shown as - Resolution:Fixed and Fix Version/s:5.0 (plan) - is it already fixed or there is just a plan to fix it in version 5.0 ?
|
|
I believe the current consensus is that it is not an issue that can be fixed by Zabbix. So it is "fixed" in as far as notes have been added to documentation.
|
|
In that case - how we can explain situation where we are able to see the spike on a Zabbix graph and there is no - on Cacti = for the same device/interface and timestamp?
|
|
Hi Martins Valkovskis, some extra information to my previous posts:
Usually, the spikes happens when Zabbix do the calculation, but were able to catch some spikes even with raw data, before any calculations.
There are spikes on down interfaces. (not connected)
**//+same device/same interface/same SNMP/ - no issues on Cacti system.
|
|
Nail, I have reopened the issue so that Zabbix developers may have another look at this issue.
|
|
Is it simply that the server or proxy doesnt have the processing ability to crunch the amount of data coming from a 10Gb connection snmp trap and so zabbix lets it slip? Do we need faster servers for 10Gb connection processing?
|
In that case - how we can explain situation where we are able to see the spike on a Zabbix graph and there is no - on Cacti = for the same device/interface and timestamp?
Cacti system has spikekill class which analyses data, calculates average values, standard deviations, etc, and filters impossible spikes, according to settings.
Smailov, could you attach raw data, ifHCOutOctets, received from same device, interface and collected with Zabbix and Cacti around the spikes? If they are the same, the only solution would be to filter those spikes.
|
|
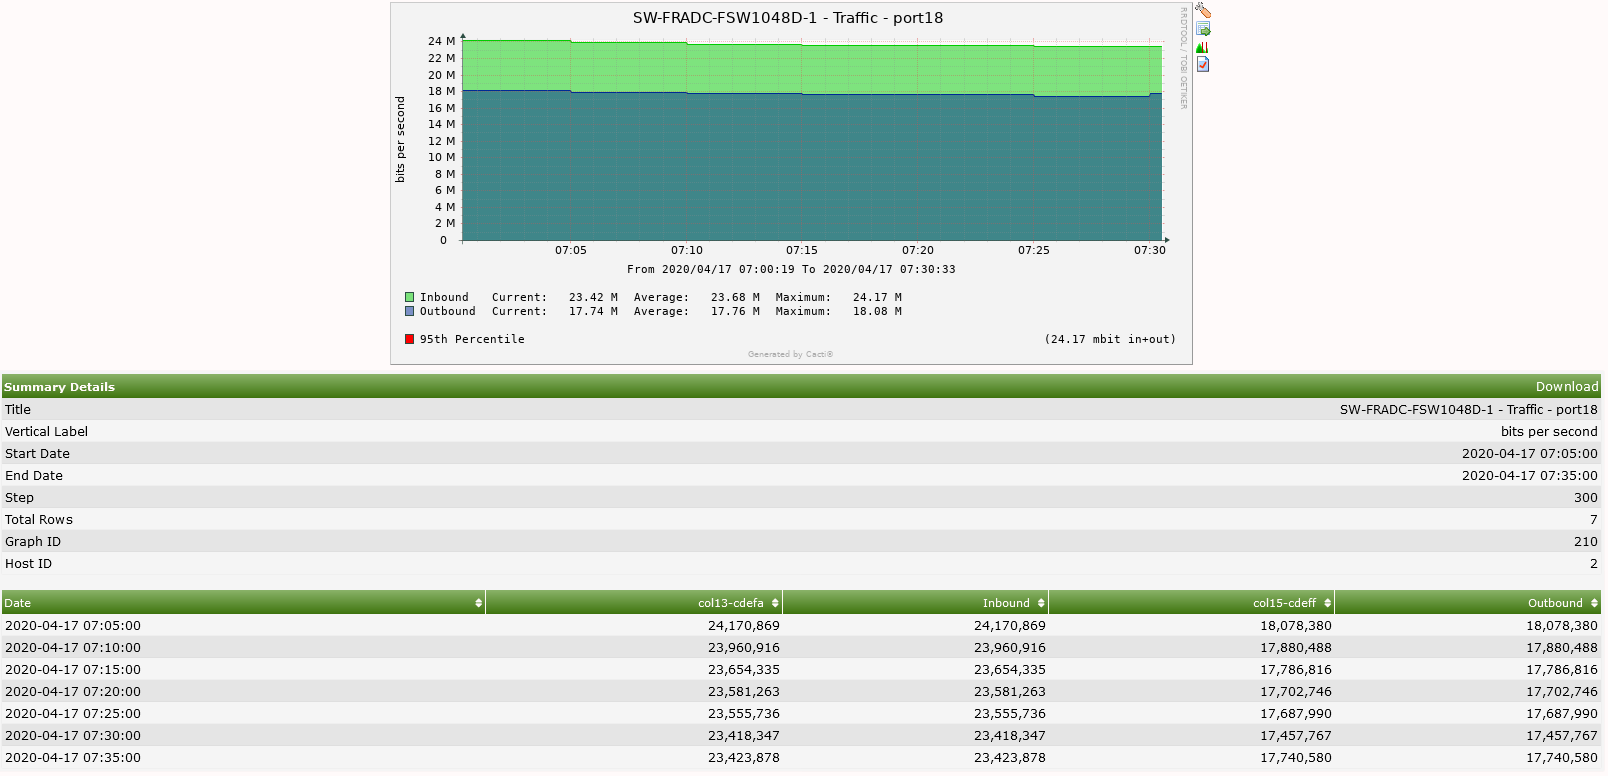
Running Zabbix 5.0.0alpha.
Interfaces UP for this specific switch:

Zabbix interface discovery:
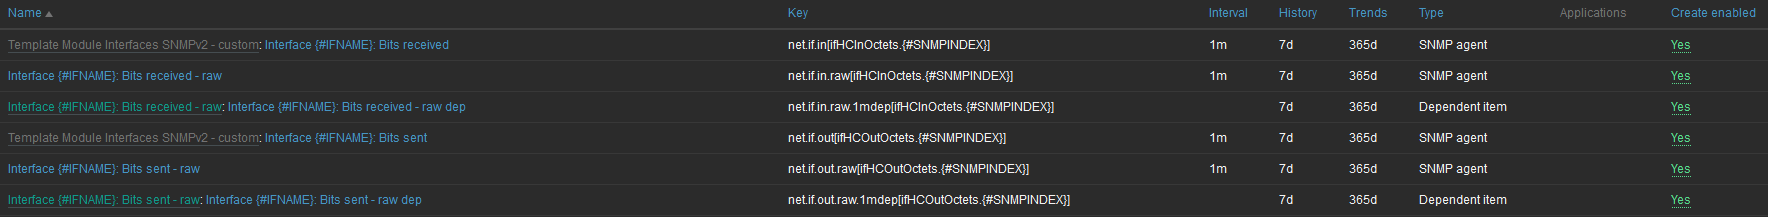
The "-raw" doesn't have any preprocessing.
The "-raw dep" is dependent on "-raw" applying the default preprocessing.
Interface UP with spike (graph):
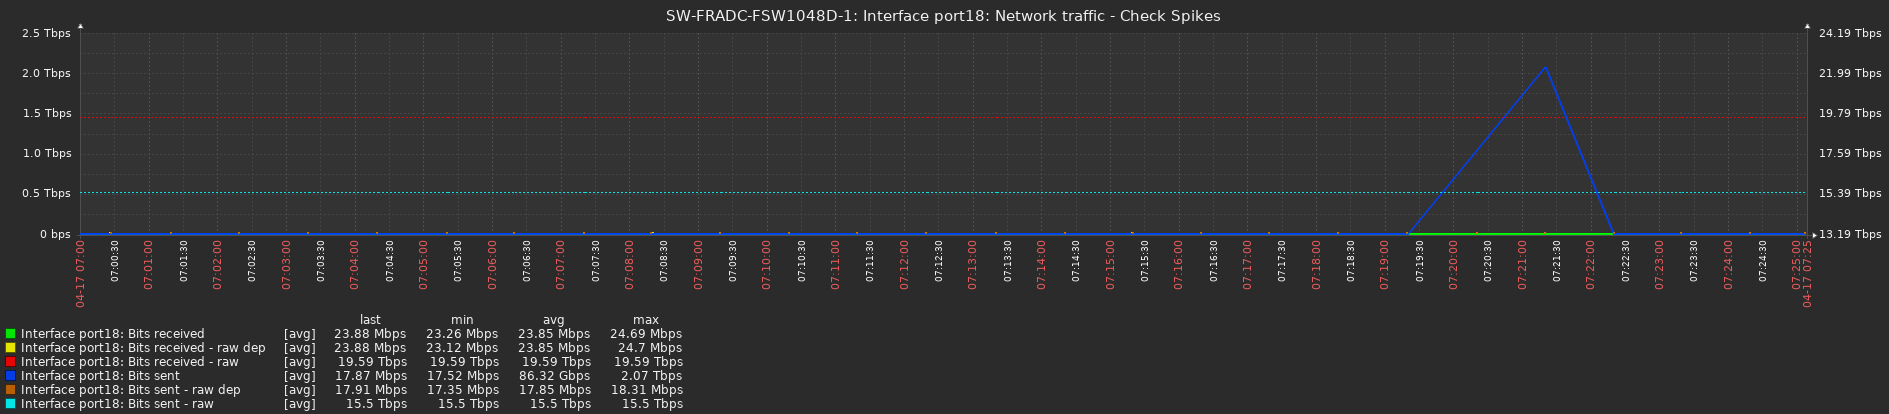
Interface UP with spike (value):
| |
Interface port18: Bits received |
Interface port18: Bits received - raw |
Interface port18: Bits received - raw dep |
Interface port18: Bits sent |
Interface port18: Bits sent - raw |
Interface port18: Bits sent - raw dep |
| 2020-04-17 07:24:21 |
23883648 |
19592107690944 |
23878352 |
17870304 |
15499302325841 |
17909912 |
| 2020-04-17 07:23:21 |
23593368 |
19591928471351 |
23743688 |
17520848 |
15499167932328 |
17480424 |
| 2020-04-17 07:22:22 |
23918112 |
19591752545469 |
23800920 |
17648336 |
15499038143602 |
17644768 |
| 2020-04-17 07:21:22 |
23429040 |
19591573840721 |
23473240 |
2071269400936 |
15498905461020 |
17569016 |
| 2020-04-17 07:20:22 |
23511688 |
19591397467504 |
23511688 |
|
15498773960801 |
17683800 |
| 2020-04-17 07:19:21 |
23261288 |
19591219496613 |
23232744 |
17749928 |
15498640461459 |
17749856 |
| 2020-04-17 07:18:21 |
23321712 |
19591046073878 |
23696808 |
17551944 |
15498506362679 |
17556944 |
| 2020-04-17 07:17:21 |
23374744 |
19590867439234 |
23124328 |
17590152 |
15498375452623 |
17594864 |
| 2020-04-17 07:16:21 |
23793472 |
19590694415934 |
24054472 |
18210424 |
15498242681158 |
17920472 |
| 2020-04-17 07:15:22 |
23797768 |
|
|
17737664 |
15498110102127 |
18013760 |
| 2020-04-17 07:15:21 |
|
19590515141590 |
23542736 |
|
|
|
| 2020-04-17 07:14:22 |
|
19590339239429 |
23583736 |
17872576 |
15497974569755 |
17988856 |
| 2020-04-17 07:14:21 |
23742280 |
|
|
|
|
|
| 2020-04-17 07:13:22 |
23527320 |
19590162037409 |
23599480 |
|
15497840241123 |
17350256 |
| 2020-04-17 07:13:21 |
|
|
|
17515184 |
|
|
| 2020-04-17 07:12:21 |
24003352 |
19589983505375 |
23875920 |
17815696 |
15497708494693 |
17916840 |
| 2020-04-17 07:11:21 |
23550248 |
19589804013215 |
23697880 |
17911912 |
15497574323938 |
17815288 |
| 2020-04-17 07:10:21 |
24027040 |
19589627369030 |
23999040 |
17994048 |
15497440539894 |
18110824 |
| 2020-04-17 07:09:21 |
23638888 |
19589446792604 |
23639032 |
17783304 |
15497305248906 |
17670368 |
| 2020-04-17 07:08:22 |
23862336 |
19589270940205 |
23768608 |
17739320 |
|
|
| 2020-04-17 07:08:21 |
|
|
|
|
15497172955873 |
17822704 |
| 2020-04-17 07:07:22 |
23674232 |
19589092513933 |
23784808 |
17658544 |
15497039899421 |
17638152 |
| 2020-04-17 07:06:21 |
24627848 |
19588912933836 |
24478456 |
18154360 |
15496905920334 |
18158632 |
| 2020-04-17 07:05:22 |
23692400 |
19588731030494 |
23834800 |
18060256 |
15496771980096 |
18065736 |
| 2020-04-17 07:04:21 |
24450240 |
19588550723527 |
24118392 |
17961976 |
15496634381670 |
17932360 |
| 2020-04-17 07:03:28 |
23967072 |
|
|
|
|
|
| 2020-04-17 07:03:21 |
|
19588369375969 |
24200352 |
18119784 |
15496500336781 |
18124128 |
| 2020-04-17 07:02:21 |
24355536 |
19588188215621 |
24354816 |
18121328 |
15496363958713 |
18126784 |
| 2020-04-17 07:01:21 |
24693792 |
19588005088480 |
24703672 |
18143104 |
15496228549044 |
17991944 |
| 2020-04-17 07:00:29 |
|
|
|
|
15496110709138 |
18308296 |
| 2020-04-17 07:00:28 |
24475600 |
19587842655602 |
24475600 |
|
|
|
| 2020-04-17 07:00:22 |
|
|
|
18175848 |
|
|
Displaying 32 of 32 found
Interface UP on Cacti:
Interface DOWN with spike (graph):
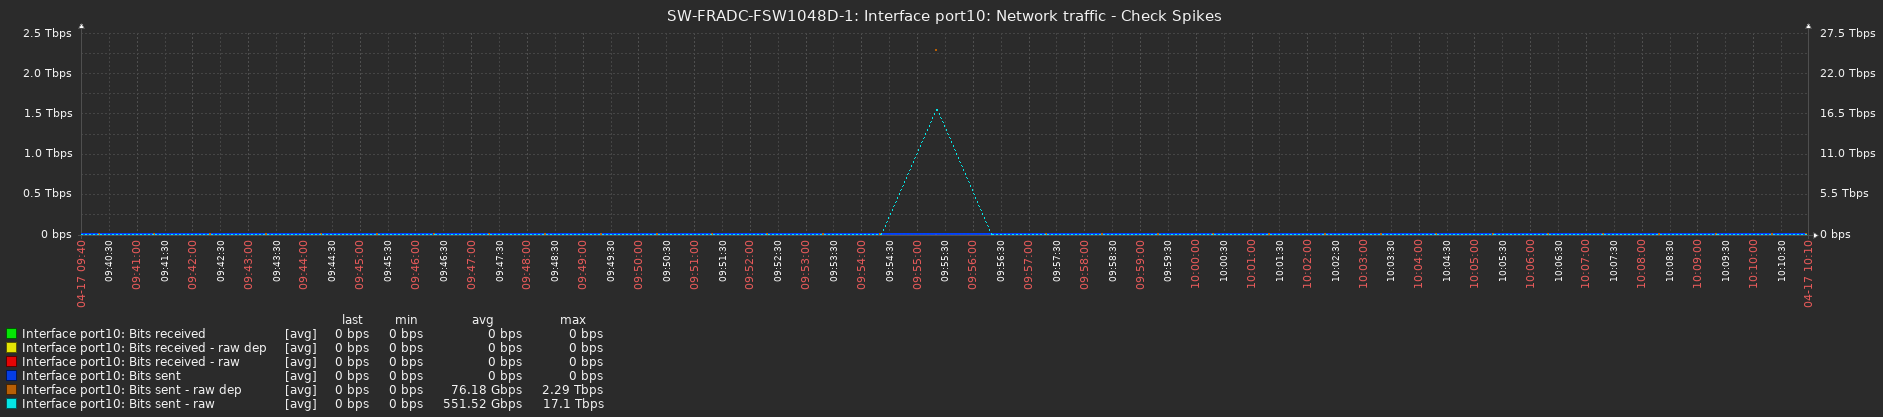
Interface DOWN with spike (value):
| Timestamp |
Interface port10: Bits received |
Interface port10: Bits received - raw |
Interface port10: Bits received - raw dep |
Interface port10: Bits sent |
Interface port10: Bits sent - raw |
Interface port10: Bits sent - raw dep |
| 2020-04-17 10:10:22 |
0 |
0 |
0 |
0 |
0 |
0 |
| 2020-04-17 10:09:22 |
0 |
|
|
0 |
0 |
0 |
| 2020-04-17 10:09:21 |
|
0 |
0 |
|
|
|
| 2020-04-17 10:08:21 |
0 |
0 |
0 |
0 |
0 |
0 |
| 2020-04-17 10:07:21 |
0 |
0 |
0 |
0 |
0 |
0 |
| 2020-04-17 10:06:21 |
0 |
0 |
0 |
0 |
0 |
0 |
| 2020-04-17 10:05:22 |
0 |
0 |
0 |
0 |
0 |
0 |
| 2020-04-17 10:04:21 |
0 |
0 |
0 |
0 |
0 |
0 |
| 2020-04-17 10:03:21 |
0 |
0 |
0 |
0 |
0 |
0 |
| 2020-04-17 10:02:21 |
0 |
0 |
0 |
0 |
0 |
0 |
| 2020-04-17 10:01:21 |
0 |
0 |
0 |
0 |
0 |
0 |
| 2020-04-17 10:00:21 |
0 |
0 |
0 |
0 |
0 |
0 |
| 2020-04-17 09:59:21 |
0 |
0 |
0 |
0 |
0 |
0 |
| 2020-04-17 09:58:21 |
0 |
0 |
0 |
0 |
0 |
0 |
| 2020-04-17 09:57:21 |
0 |
0 |
0 |
0 |
0 |
0 |
| 2020-04-17 09:56:22 |
0 |
0 |
0 |
0 |
0 |
|
| 2020-04-17 09:55:22 |
0 |
0 |
0 |
0 |
17096969482572 |
2285266929976 |
| 2020-04-17 09:54:22 |
0 |
0 |
0 |
0 |
0 |
0 |
| 2020-04-17 09:53:21 |
0 |
0 |
0 |
0 |
0 |
0 |
| 2020-04-17 09:52:21 |
0 |
0 |
0 |
0 |
0 |
0 |
| 2020-04-17 09:51:21 |
0 |
0 |
0 |
0 |
0 |
0 |
| 2020-04-17 09:50:22 |
|
0 |
0 |
|
0 |
0 |
| 2020-04-17 09:50:21 |
0 |
|
|
0 |
|
|
| 2020-04-17 09:49:22 |
0 |
0 |
0 |
|
0 |
0 |
| 2020-04-17 09:49:21 |
|
|
|
0 |
|
|
| 2020-04-17 09:48:22 |
0 |
0 |
0 |
0 |
0 |
0 |
| 2020-04-17 09:47:22 |
0 |
|
|
0 |
|
|
| 2020-04-17 09:47:21 |
|
0 |
0 |
|
0 |
0 |
| 2020-04-17 09:46:22 |
0 |
0 |
0 |
0 |
0 |
0 |
| 2020-04-17 09:45:21 |
0 |
0 |
0 |
0 |
0 |
0 |
| 2020-04-17 09:44:21 |
0 |
0 |
0 |
0 |
0 |
0 |
| 2020-04-17 09:43:21 |
0 |
0 |
0 |
0 |
0 |
0 |
| 2020-04-17 09:42:21 |
0 |
0 |
0 |
0 |
0 |
0 |
| 2020-04-17 09:41:21 |
0 |
0 |
0 |
0 |
0 |
0 |
| 2020-04-17 09:40:21 |
0 |
0 |
0 |
0 |
0 |
0 |
Displaying 35 of 35 found
Interface DOWN with spike (graph):
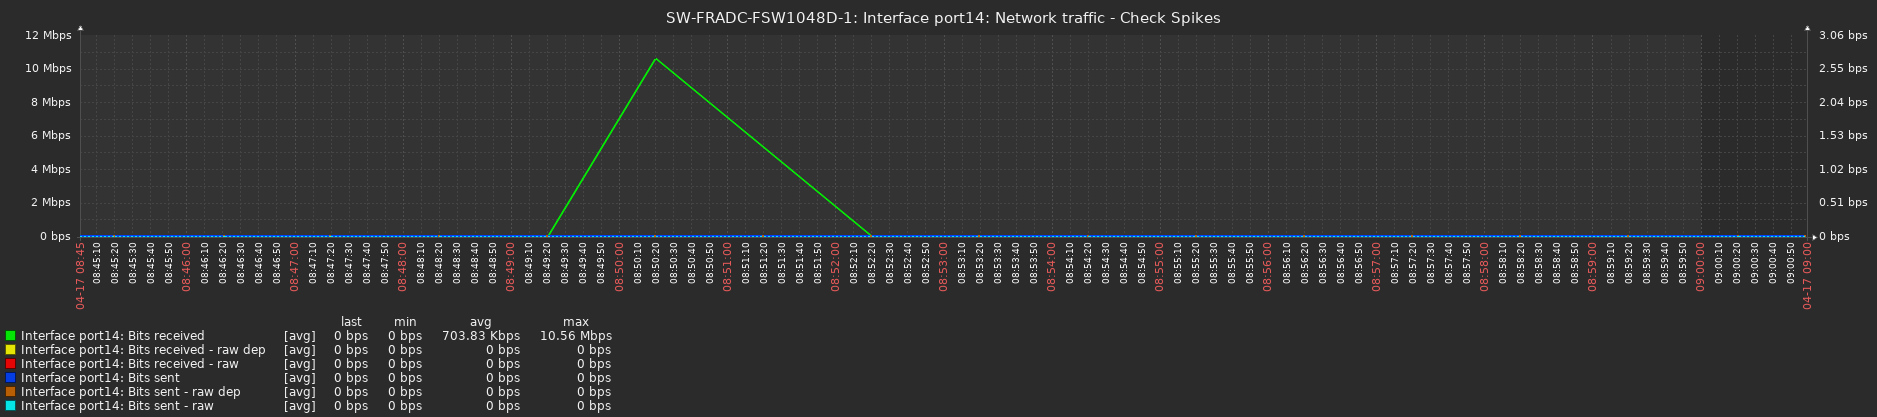
Interface DOWN with spike (value):
| Timestamp |
Interface port14: Bits received |
Interface port14: Bits received - raw |
Interface port14: Bits received - raw dep |
Interface port14: Bits sent |
Interface port14: Bits sent - raw |
Interface port14: Bits sent - raw dep |
| 2020-04-17 09:00:22 |
|
0 |
0 |
|
0 |
0 |
| 2020-04-17 09:00:21 |
0 |
|
|
0 |
|
|
| 2020-04-17 08:59:21 |
0 |
0 |
0 |
0 |
0 |
0 |
| 2020-04-17 08:58:21 |
0 |
0 |
0 |
0 |
0 |
0 |
| 2020-04-17 08:57:21 |
0 |
0 |
0 |
0 |
0 |
0 |
| 2020-04-17 08:56:21 |
0 |
0 |
0 |
0 |
0 |
0 |
| 2020-04-17 08:55:21 |
0 |
0 |
0 |
0 |
0 |
0 |
| 2020-04-17 08:54:21 |
0 |
0 |
0 |
0 |
0 |
0 |
| 2020-04-17 08:53:21 |
0 |
0 |
0 |
0 |
0 |
0 |
| 2020-04-17 08:52:21 |
0 |
0 |
0 |
0 |
0 |
0 |
| 2020-04-17 08:51:21 |
|
0 |
0 |
0 |
0 |
0 |
| 2020-04-17 08:50:21 |
10557504 |
0 |
0 |
0 |
0 |
0 |
| 2020-04-17 08:49:21 |
0 |
0 |
0 |
0 |
0 |
0 |
| 2020-04-17 08:48:21 |
0 |
0 |
0 |
0 |
0 |
0 |
| 2020-04-17 08:47:22 |
0 |
|
|
|
|
|
| 2020-04-17 08:47:21 |
|
0 |
0 |
0 |
0 |
0 |
| 2020-04-17 08:46:22 |
|
0 |
0 |
0 |
0 |
0 |
| 2020-04-17 08:46:21 |
0 |
|
|
|
|
|
| 2020-04-17 08:45:21 |
0 |
0 |
0 |
0 |
0 |
0 |
Displaying 19 of 19 found
Interface DOWN with spike (graph):
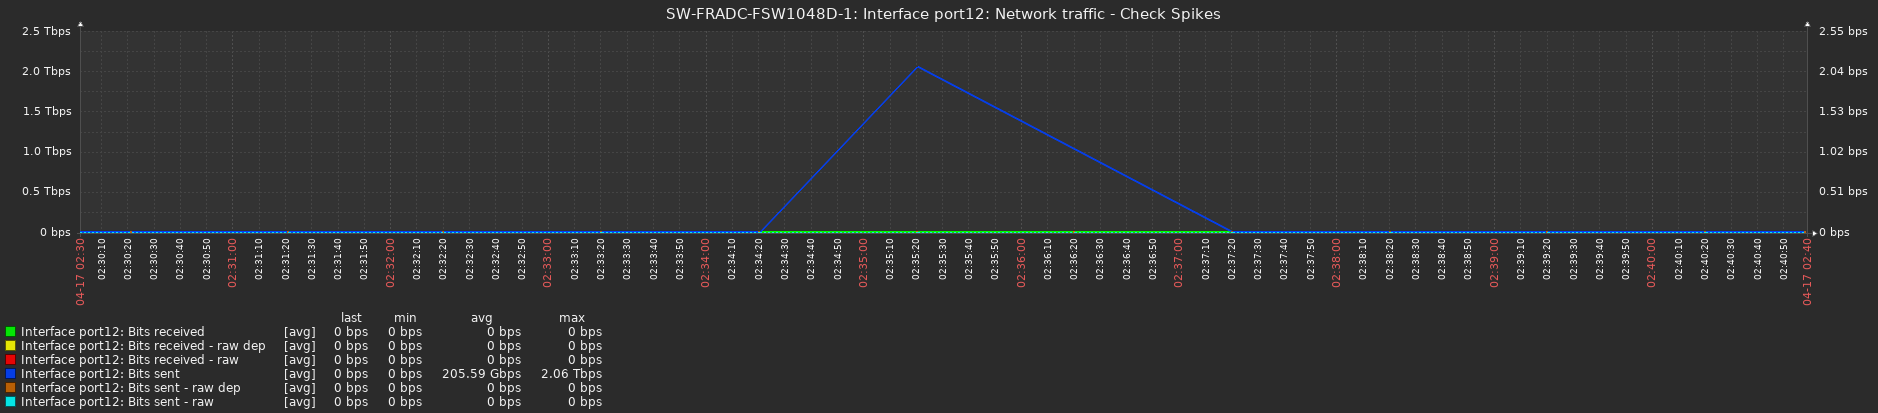
Interface DOWN with spike (value):
| Timestamp |
Interface port12: Bits received |
Interface port12: Bits received - raw |
Interface port12: Bits received - raw dep |
Interface port12: Bits sent |
Interface port12: Bits sent - raw |
Interface port12: Bits sent - raw dep |
| 2020-04-17 02:40:21 |
0 |
0 |
0 |
0 |
0 |
0 |
| 2020-04-17 02:39:21 |
0 |
0 |
0 |
0 |
0 |
0 |
| 2020-04-17 02:38:21 |
0 |
0 |
0 |
0 |
0 |
0 |
| 2020-04-17 02:37:21 |
0 |
0 |
0 |
0 |
0 |
0 |
| 2020-04-17 02:36:21 |
0 |
0 |
0 |
|
0 |
0 |
| 2020-04-17 02:35:21 |
0 |
0 |
0 |
2055904578488 |
0 |
0 |
| 2020-04-17 02:34:21 |
0 |
0 |
0 |
0 |
0 |
0 |
| 2020-04-17 02:33:21 |
0 |
0 |
0 |
0 |
0 |
0 |
| 2020-04-17 02:32:21 |
0 |
0 |
0 |
0 |
0 |
0 |
| 2020-04-17 02:31:22 |
0 |
0 |
0 |
0 |
0 |
0 |
| 2020-04-17 02:30:22 |
|
0 |
0 |
0 |
0 |
0 |
| 2020-04-17 02:30:21 |
0 |
|
|
|
|
|
Displaying 12 of 12 found
As you can see these spikes looks totally random.
Besides the fact that Cacti interval is 5 minutes and Zabbix is now configured to 1 minute, I got the same issue using the Zabbix interval of 3 and 5 minutes as well.
|
|
Spike in bps could be explained by some oddity in the way how switch updates counter of sent bytes.
There is a jump in bytes sent counter, after that growth and calculated bps is normal again.
| 10/05/2018 23:08:25 |
48371264 |
|
10/05/2018 23:04:32 |
120913174388169 |
| 10/05/2018 23:06:56 |
41859016 |
|
10/05/2018 23:03:03 |
120912874257789 |
| 10/05/2018 23:05:26 |
20095656 |
|
10/05/2018 23:01:32 |
119813994206077 |
| 10/05/2018 23:02:25 |
98309903584 |
|
10/05/2018 23:00:02 |
119816316961101 |
But case, where from zero bits sent is calculated some non zero value, could only happen in Zabbix server. However I could not reproduce it. And reading through code did not give me any idea, how this could happen.
| 2020-04-17 02:36:21 |
0 |
0 |
0 |
|
0 |
0 |
| 2020-04-17 02:35:21 |
0 |
0 |
0 |
2055904578488 |
0 |
0 |
| 2020-04-17 02:34:21 |
0 |
0 |
0 |
0 |
0 |
0 |
|
|
Please, let me know if there's any debug or anything else that I can do to help the troubleshooting of this issue.
|
|
Is only delta speed for second affected if so then maybe it is somehow related to time in the system for example time goes back.
wiper: From the posted data they are getting random data spikes, so does not seem likely.
|
|
In our case, we figured out that this was a hardware issue. The issue was caused by the SNMP bulk request that the hardware didn't know how to handle properly. It will be fixed in a new firmware version.
As a workaround, we disabled the SNMP bulk request on the host config and now it's working properly.
Also, this is the reason it was working on Cacti but not on Zabbix since Cacti wasn't using bulk requests.
Hope this can help other Zabbix users!
Thanks for the support and help.
|
|
No No
It is not a hardware issue. if it was, we will see a lot of spikes in all graphs, but there are a few spikes in graphs on random interfaces.
I also noticed that my BulkRequest is not enabled at all and still I have Spike in graphs
|
|
We are unable to reproduce the issue, if you can consistently reproduce the issue on small amount of items then maybe it would be possible for us to provide a patch for you that will include additional debug ?
|
|
zabbix 4.4.10 Found the problem again
zabbix 3.4.14 In 2018, the problem was found to be upgraded to 4.0 to fix, and now the problem is found again
https://support.zabbix.com/browse/ZBX-15215
|
|
Closing, because of the inability to reproduce.
|
|
We noticed this kind of behaviour when polling a Cisco ASR in high availability mode (so there is two physical devices, one logical vía SNMP). When the cluster failover to one device to another the bytes counter changes from the "physical" one in one router to the other and then you will find the peak. Maybe being able to use in preprocessing the value of another item will be useful so you can filter this situation.
|
|
Could you please be so kind and take a look at ZBX-25917, it appears that issue can happen when device is restarted and polled at same moment so device would send 0 before it updates own counters.
|
Generated at Wed Mar 26 16:09:14 EET 2025 using Jira 9.12.4#9120004-sha1:625303b708afdb767e17cb2838290c41888e9ff0.