|
Duplicate |
|||
| duplicates |
|
异常流量峰值(尖峰) | Closed |
| duplicates |
|
SNMP Interface Speeds exceed physical... | Closed |
[ZBX-14322] Abnormal flow peak (peak) Created: 2018 May 04 Updated: 2018 May 15 Resolved: 2018 May 15 |
|
| Status: | Closed |
| Project: | ZABBIX BUGS AND ISSUES |
| Component/s: | Frontend (F) |
| Affects Version/s: | 3.4.10rc1 |
| Fix Version/s: | None |
| Type: | Incident report | Priority: | Major |
| Reporter: | 李阳 | Assignee: | Unassigned |
| Resolution: | Duplicate | Votes: | 0 |
| Labels: | Abnormal, traffic | ||
| Remaining Estimate: | Not Specified | ||
| Time Spent: | Not Specified | ||
| Original Estimate: | Not Specified | ||
| Environment: |
centos7 |
||
| Attachments: |
|
||||||||||||
| Issue Links: |
|
||||||||||||
| Description |
|
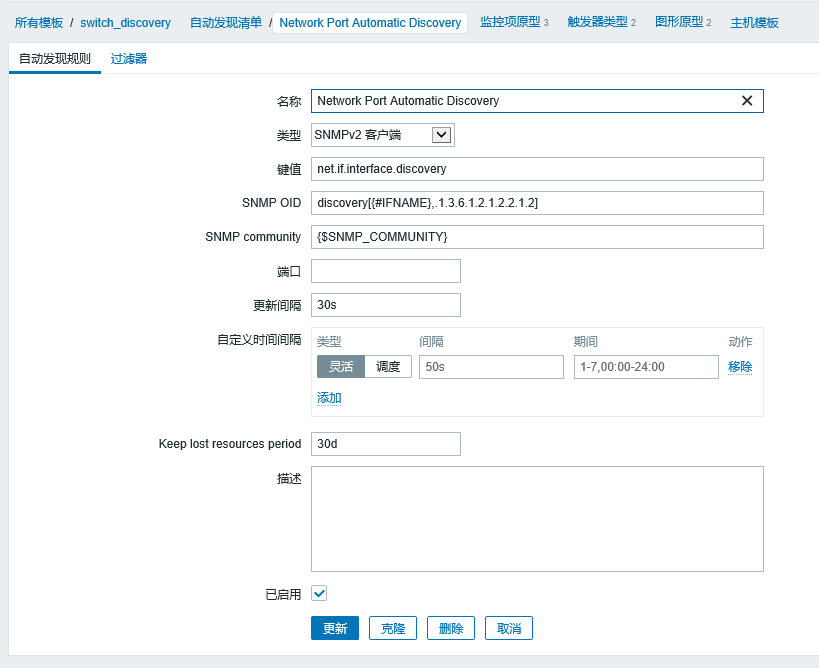
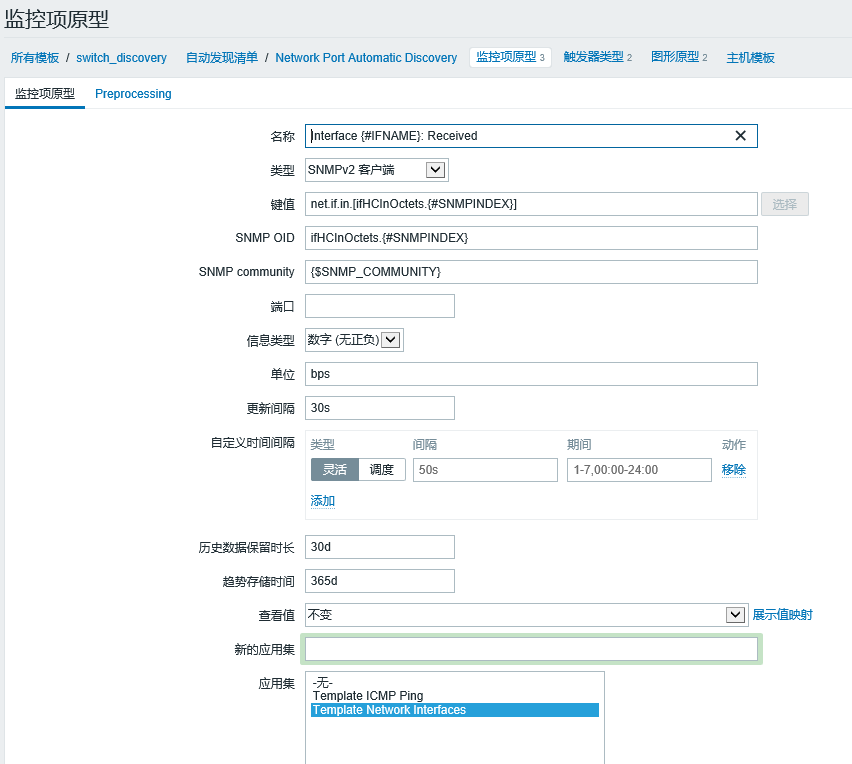
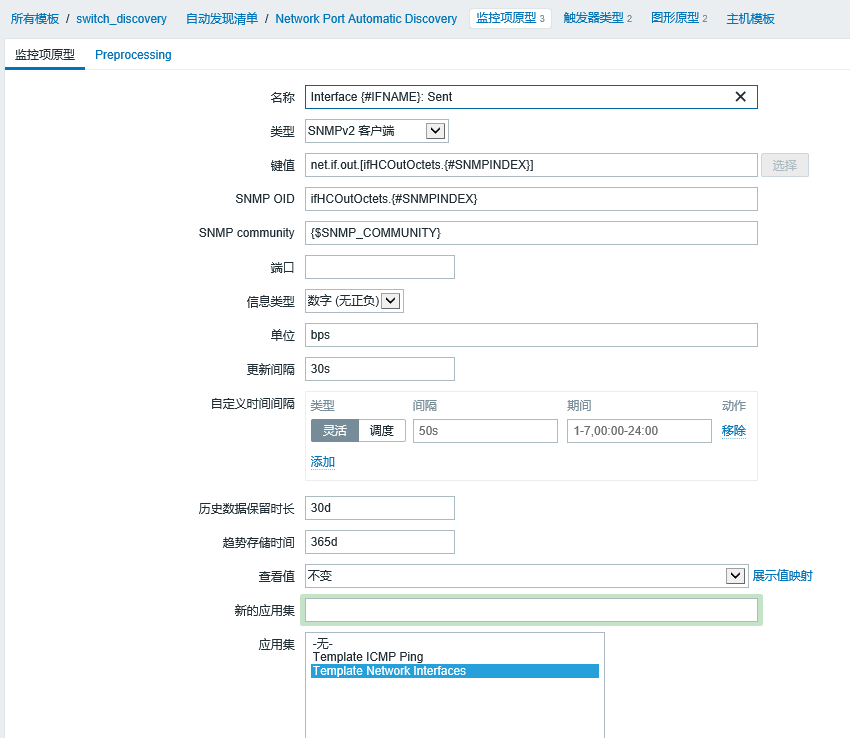
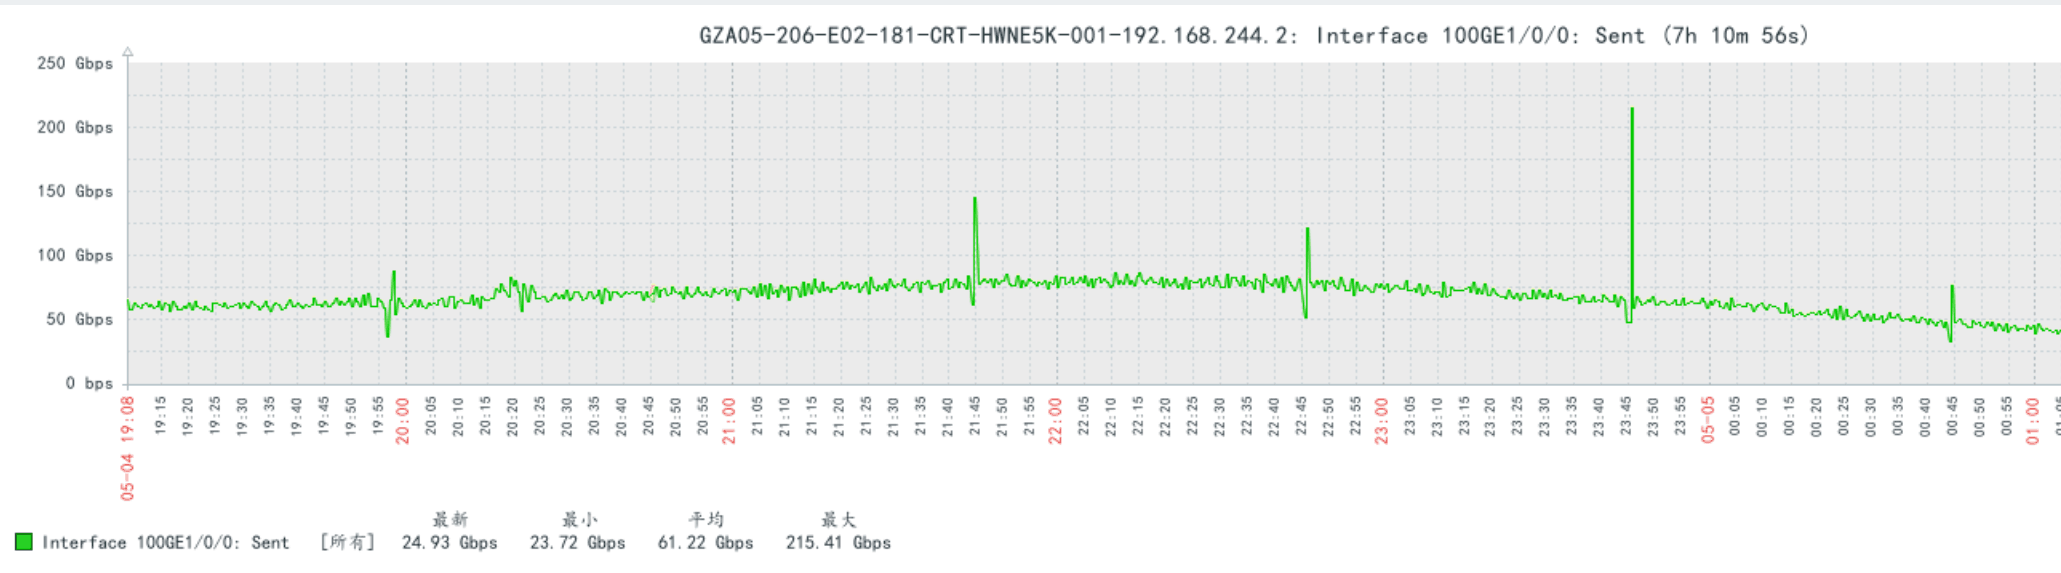
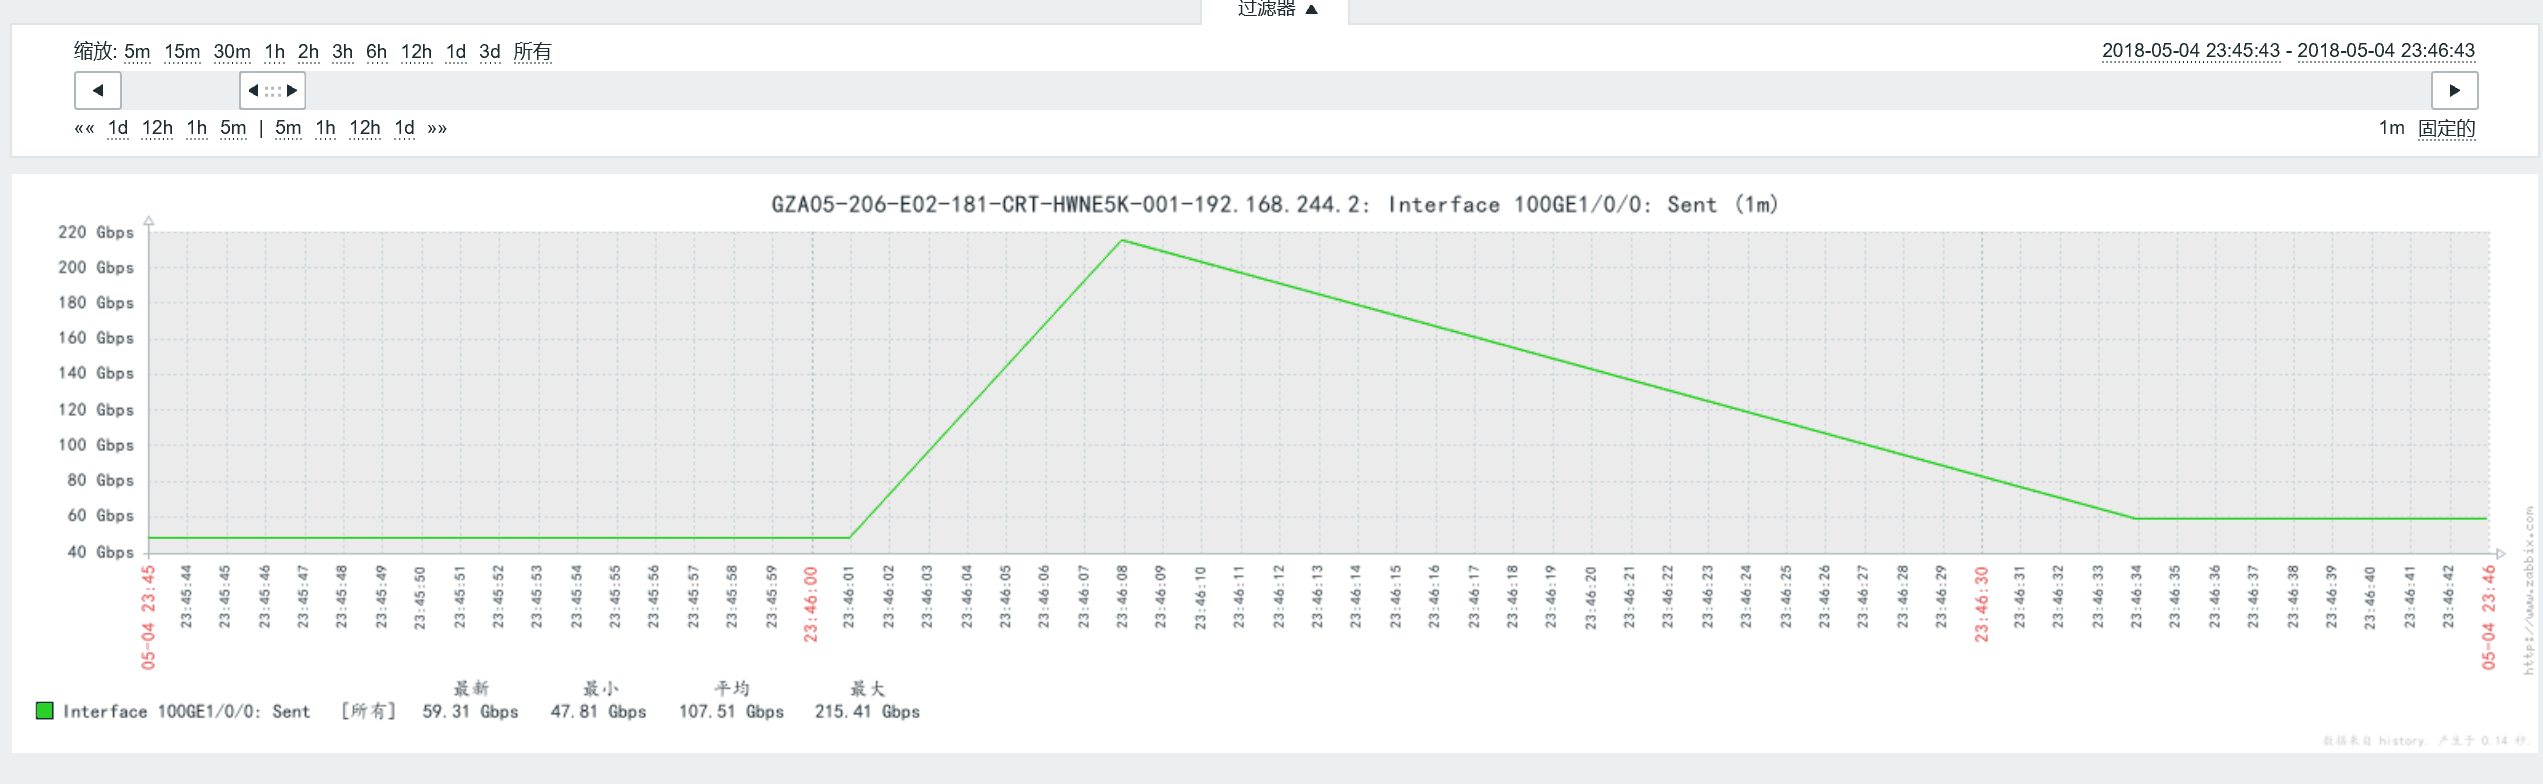
Snmpv2 protocol acquisition switch flow, found that the flow chart is abnormal peak, peak value is greater than the network card rate, don't know why have this data, trouble experienced eldest brother, to give some directions. See attachment for specific configuration and flow chart. |
| Comments |
| Comment by Alexey Pustovalov [ 2018 May 04 ] |
|
Are you sure that you need multiply? I suppose you need to use 0.125 multiplier. |
| Comment by Glebs Ivanovskis (Inactive) [ 2018 May 05 ] |
|
Multiplier 8 is correct if octets need to be converted into bits. I think that the issue may be caused by overflow of 32-bit counters. 64-bit counters should be used. |
| Comment by Glebs Ivanovskis (Inactive) [ 2018 May 05 ] |
|
Is the host monitored by proxy or directly by server? |
| Comment by 李阳 [ 2018 May 07 ] |
|
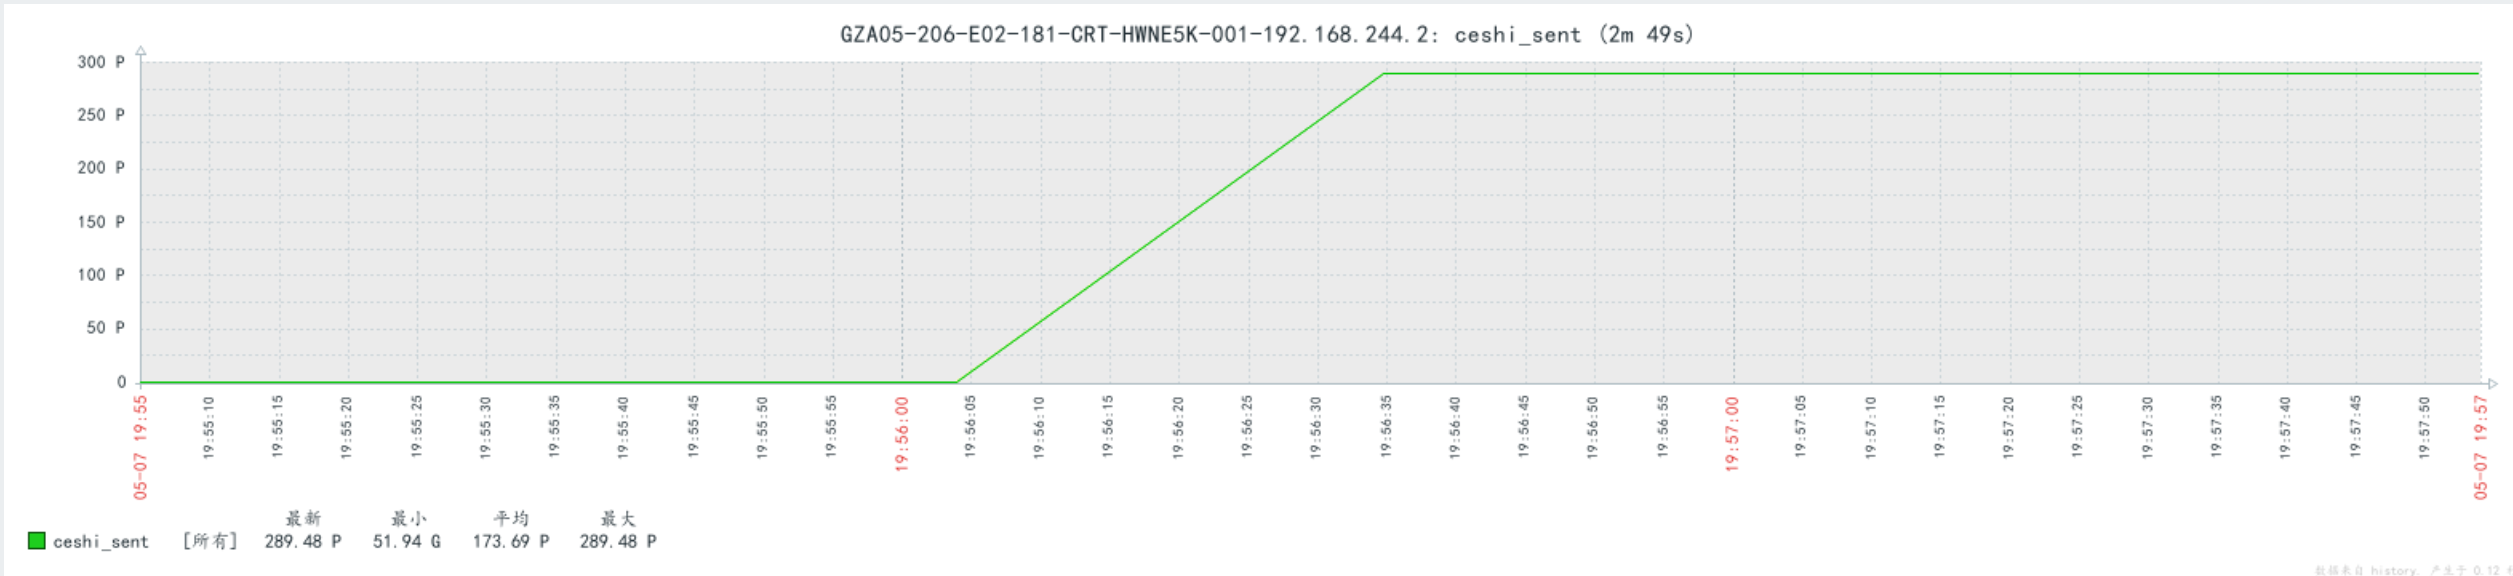
Hello, I am using the oid of counter64, which is collected by the server directly on the switch and there is no agent in the middle. |
| Comment by Glebs Ivanovskis (Inactive) [ 2018 May 07 ] |
|
Hm, is it a coincidence that all abnormal spikes in the graph are in the beginning of the hour? Can you show Zabbix server performance graphs for the same period of time? Is bulk mode enabled for that interface? |
| Comment by Glebs Ivanovskis (Inactive) [ 2018 May 07 ] |
|
Can you create an item with identical OID, but without preprocessing? We would like to see raw values gathered by Zabbix at the time of anomalous spikes. |
| Comment by 李阳 [ 2018 May 07 ] |
|
|
| Comment by 李阳 [ 2018 May 07 ] |
|
|
| Comment by Glebs Ivanovskis (Inactive) [ 2018 May 07 ] |
|
Please show values, not the graph. |
| Comment by 李阳 [ 2018 May 07 ] |
|
Latest data can only display a currently acquired value. How can we display all data values? |
| Comment by Glebs Ivanovskis (Inactive) [ 2018 May 07 ] |
|
| Comment by Glebs Ivanovskis (Inactive) [ 2018 May 15 ] |
|
Closing as Duplicate of |