|
Duplicate |
|||
| is duplicated by |
|
Too slow dashboard when big events table | Closed |
[ZBX-15176] Zabbix Dashboard load very slow on 4.0 and 3.4 Created: 2018 Nov 16 Updated: 2018 Nov 16 Resolved: 2018 Nov 16 |
|
| Status: | Closed |
| Project: | ZABBIX BUGS AND ISSUES |
| Component/s: | API (A), Frontend (F) |
| Affects Version/s: | 4.0.1 |
| Fix Version/s: | None |
| Type: | Problem report | Priority: | Critical |
| Reporter: | liuzhihao | Assignee: | Unassigned |
| Resolution: | Duplicate | Votes: | 0 |
| Labels: | api, frontend | ||
| Remaining Estimate: | Not Specified | ||
| Time Spent: | Not Specified | ||
| Original Estimate: | Not Specified | ||
| Environment: |
System version: Amazon 2(CentOS 7) 4CPU 16G Memory |
||
| Attachments: |
|
||||||||
| Issue Links: |
|
||||||||
| Description |
|
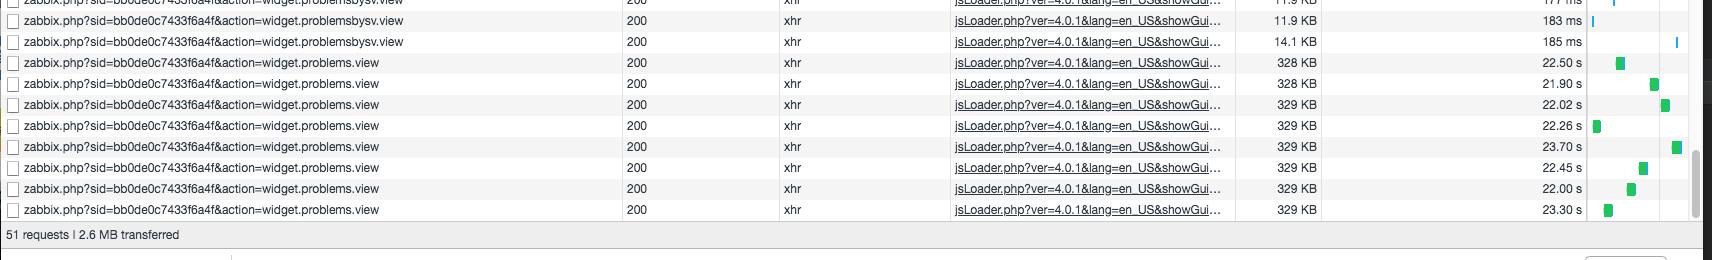
hello, we update zabbix 2.4 to 3.4 , In the dashboard, the problem is always displayed in the load, the loading time is 20-50s. upgrade 4.0.1 version, the problem still exists. Problems api: http://127.0.0.1/zabbix.php?sid=bb0de0c7433f6a4f&action=widget.problems.view Load size: 329k Load time: 20 ~ 50s Php slow log: [16-Nov-2018 04:16:23] [pool www] pid 21993 script_filename = /usr/share/zabbix/zabbix.php [0x00007effdf2ceaf8] mysqli_query() /usr/share/zabbix/include/db.inc.php:364 [0x00007effdf2cdbe8] DBselect() /usr/share/zabbix/include/classes/api/services/CEvent.php:478 [0x00007effdf2c9d60] getEvents() /usr/share/zabbix/include/classes/api/services/CEvent.php:132 [0x00007ffd4316c510] get() unknown:0 [0x00007effdf2c8db0] call_user_func_array() /usr/share/zabbix/include/classes/api/clients/CLocalApiClient.php:123 [0x00007effdf2c8390] callMethod() /usr/share/zabbix/include/classes/api/wrappers/CFrontendApiWrapper.php:97 [0x00007effdf2c8170] callClientMethod() /usr/share/zabbix/include/classes/api/wrappers/CApiWrapper.php:94 [0x00007effdf2c8020] callMethod() /usr/share/zabbix/include/classes/api/wrappers/CFrontendApiWrapper.php:63 [0x00007effdf2c7be0] callMethod() /usr/share/zabbix/include/classes/api/wrappers/CApiWrapper.php:82 [0x00007ffd4316ced0] __call() unknown:0 [0x00007effdf2c7840] get() /usr/share/zabbix/include/events.inc.php:479 [0x00007effdf2c48d0] make_popup_eventlist() /usr/share/zabbix/app/views/monitoring.widget.problems.view.php:156 [0x00007effdf2c0c58] +++ dump failed Database sql: SELECT DISTINCT e.eventid,e.clock,e.ns,e.objectid,er1.r_eventid FROM events e LEFT JOIN event_recovery er1 ON er1.eventid=e.eventid WHERE e.source='0' AND e.object='0' AND e.objectid='99996' AND e.eventid<='12910327' AND e.value='1' ORDER BY e.eventid DESC LIMIT 20
How can I solve this problem? thinks! |
| Comments |
| Comment by Vladislavs Sokurenko [ 2018 Nov 16 ] |
|
Please provide explain for the query |
| Comment by liuzhihao [ 2018 Nov 16 ] |
|
HI, This query sql is zabbix generation , I try Manual execution time is 0.7s. |
| Comment by Alexander Vladishev [ 2018 Nov 16 ] |
|
Closed as duplicate of |