|
Causes |
|||
| caused by |
|
Convert configuration cache mutexes t... | Closed |

[ZBX-15200] Number of items periodically spikes Created: 2018 Nov 22 Updated: 2024 Apr 10 Resolved: 2018 Dec 02 |
|
| Status: | Closed |
| Project: | ZABBIX BUGS AND ISSUES |
| Component/s: | Server (S) |
| Affects Version/s: | 4.0.1 |
| Fix Version/s: | 4.0.3rc1, 4.2.0alpha1, 4.2 (plan) |
| Type: | Problem report | Priority: | Minor |
| Reporter: | Alexander Ivanes | Assignee: | Vladislavs Sokurenko |
| Resolution: | Fixed | Votes: | 0 |
| Labels: | None | ||
| Remaining Estimate: | Not Specified | ||
| Time Spent: | Not Specified | ||
| Original Estimate: | Not Specified | ||
| Environment: |
Linux 4.13.0-39-generic #44~16.04.1-Ubuntu SMP Thu Apr 5 16:43:10 UTC 2018 x86_64 x86_64 x86_64 GNU/Linux |
||
| Attachments: |
|
||||||||
| Issue Links: |
|
||||||||
| Team: | |
||||||||
| Sprint: | Sprint 46, Nov 2018 | ||||||||
| Story Points: | 0.125 | ||||||||
| Description |
|
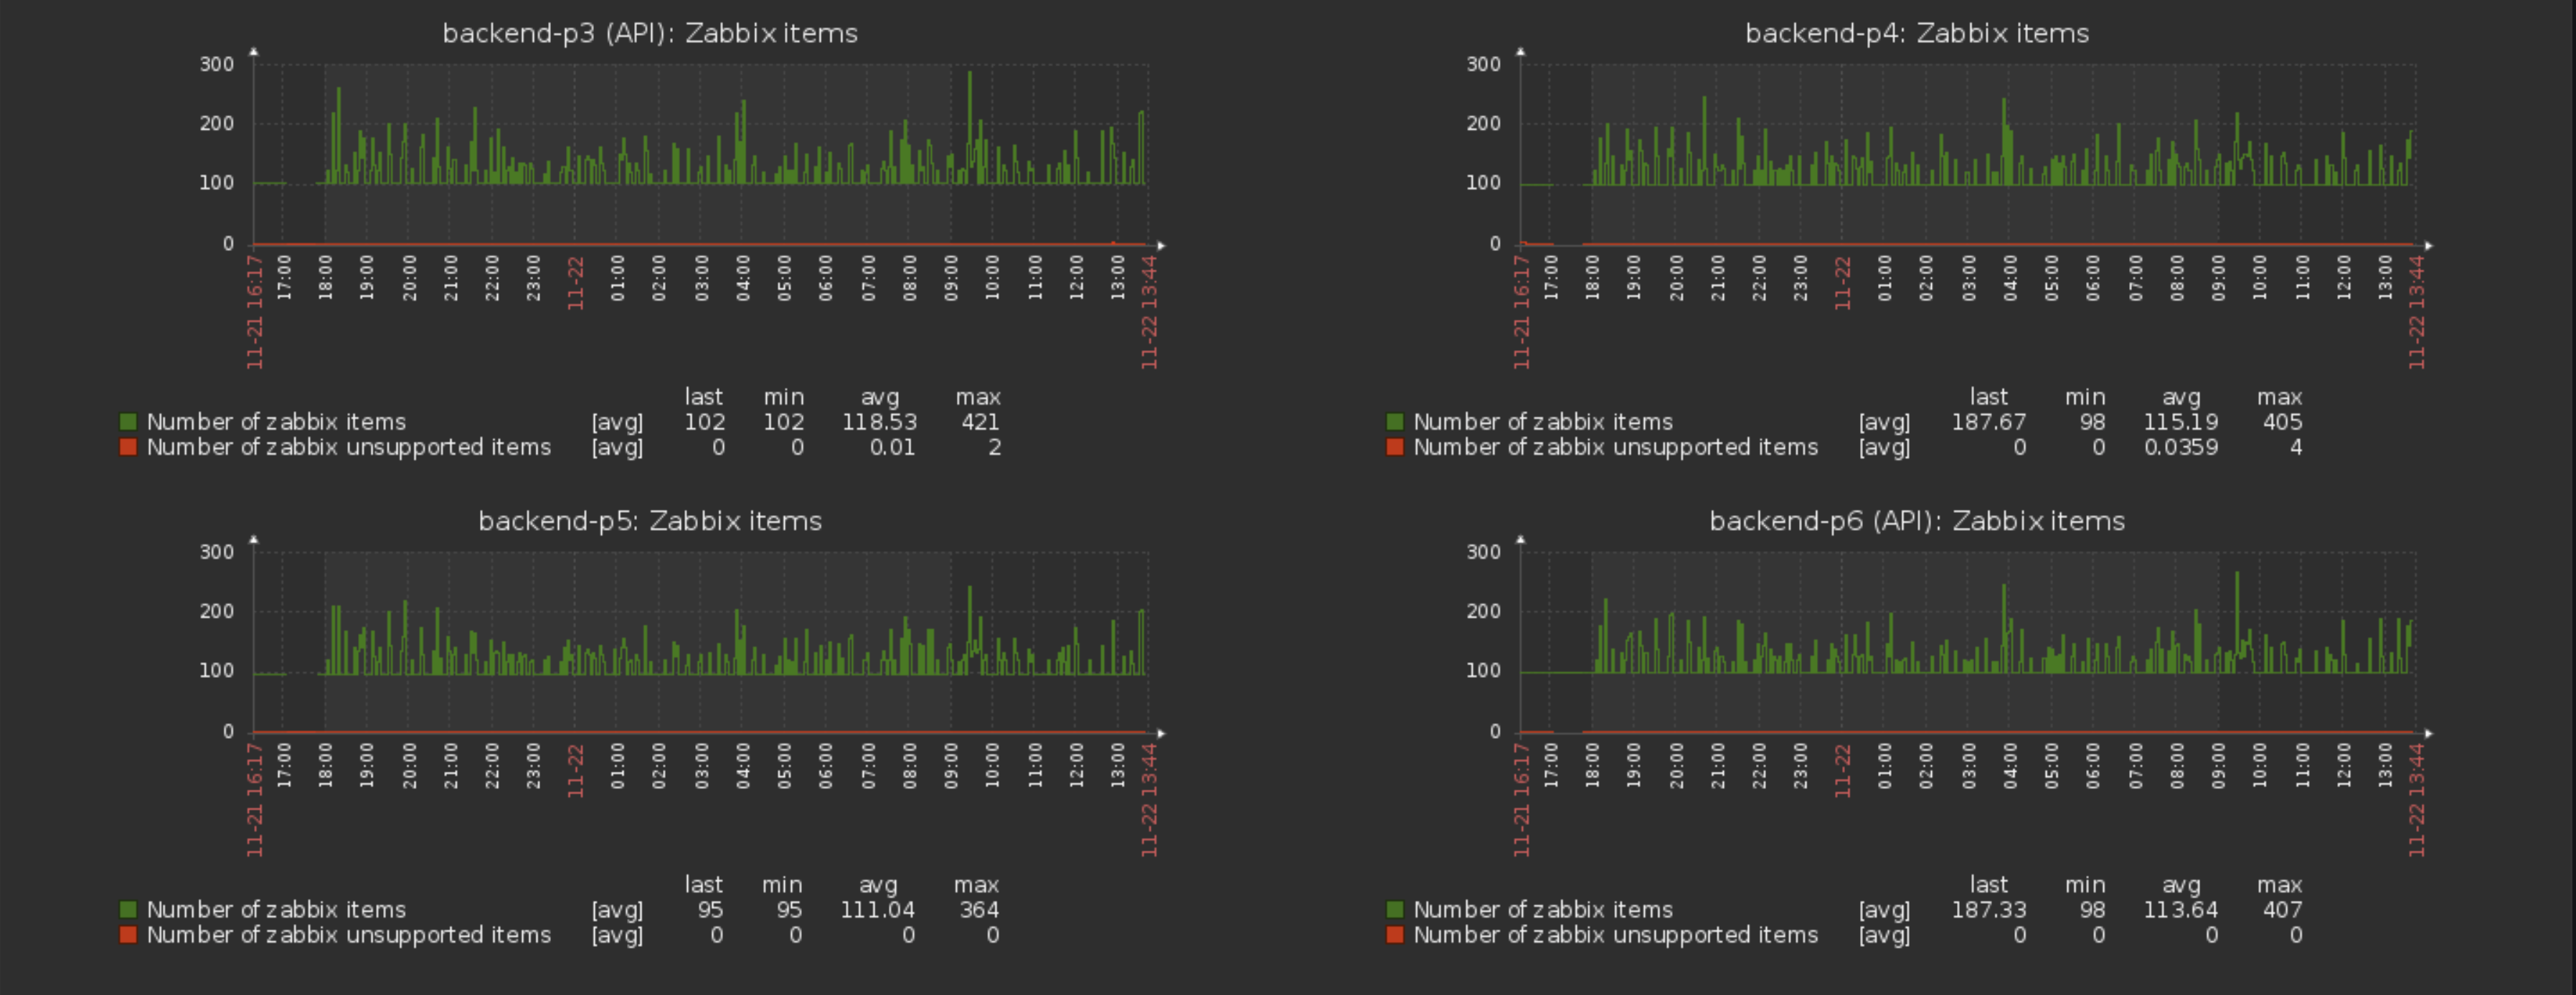
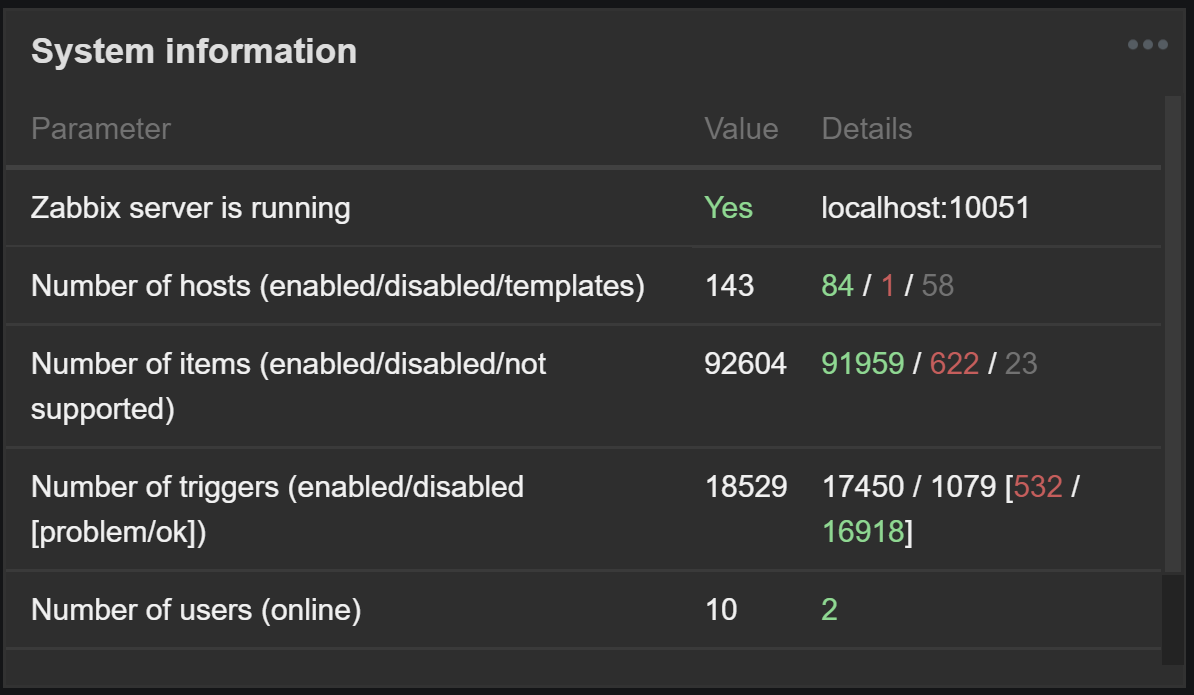
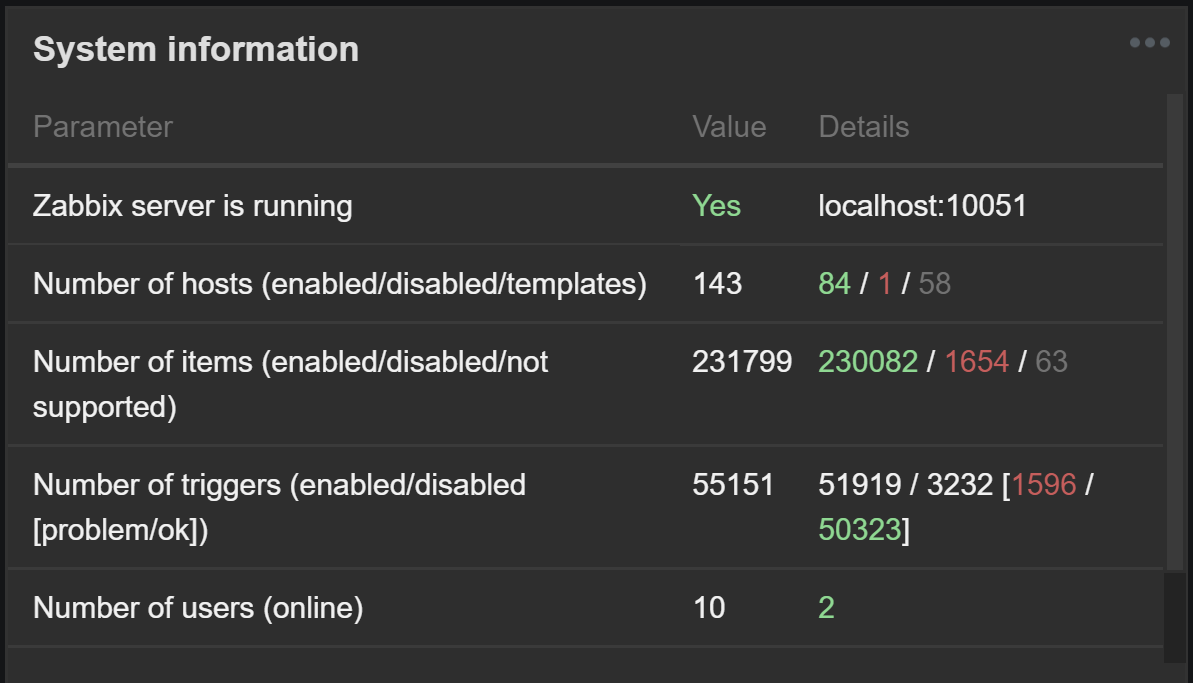
We monitor number of items on the host (through zabbix internal key zabbix[host,,items]). After upgrading to 4.0.1 (from 3.4.x) it sometimes return strange values (see attached screenshot). There's no information in agent\server\postgres logs.
|
| Comments |
| Comment by Edgar Akhmetshin [ 2018 Nov 22 ] |
|
Hello, Alexander Do you use node autodetection, autodiscovery and LLD? How many hosts do you monitor? Regards, |
| Comment by richlv [ 2018 Nov 22 ] |
|
What's the unexpected thing there, is the item count not matching what's on the host? |
| Comment by Alexander Ivanes [ 2018 Nov 22 ] |
|
Yes, we are using LLD and autodiscovery. I also have first thought about LLD, but it's usually retain created items and not deleting them immediately. I captured two system states on this screenshots (number of hosts remains the same):
|
| Comment by Edgar Akhmetshin [ 2018 Nov 22 ] |
You have more than 2 times the number of data elements on the second screenshot. What do you monitor and which templates do you use? Regards, |
| Comment by Alexander Ivanes [ 2018 Nov 22 ] |
Well... everything. Databases, CPU, disks, you name it. Most of it are our custom templates, some with LLD (databases, disks, etc.), some not. What is strange is that every single host has that kind of problem (and spikes timestamp is identical for every single one of them) and we have separate templates for windows and linux machines (except Zabbix agent template which has not LLD rule). So it's not specific template that cause this kind of behavior. |
| Comment by richlv [ 2018 Nov 22 ] |
|
First thing to check - whether any of your LLD rules have a low or even 0 retention period. |
| Comment by Alexander Ivanes [ 2018 Nov 22 ] |
We have at minimum 7 day retention for all LLD rules. And we don't have scripts that affect that behavior.
Can you give me an example query for this one? I don't have much experience with API or zabbix database structure. |
| Comment by Alexander Ivanes [ 2018 Nov 22 ] |
|
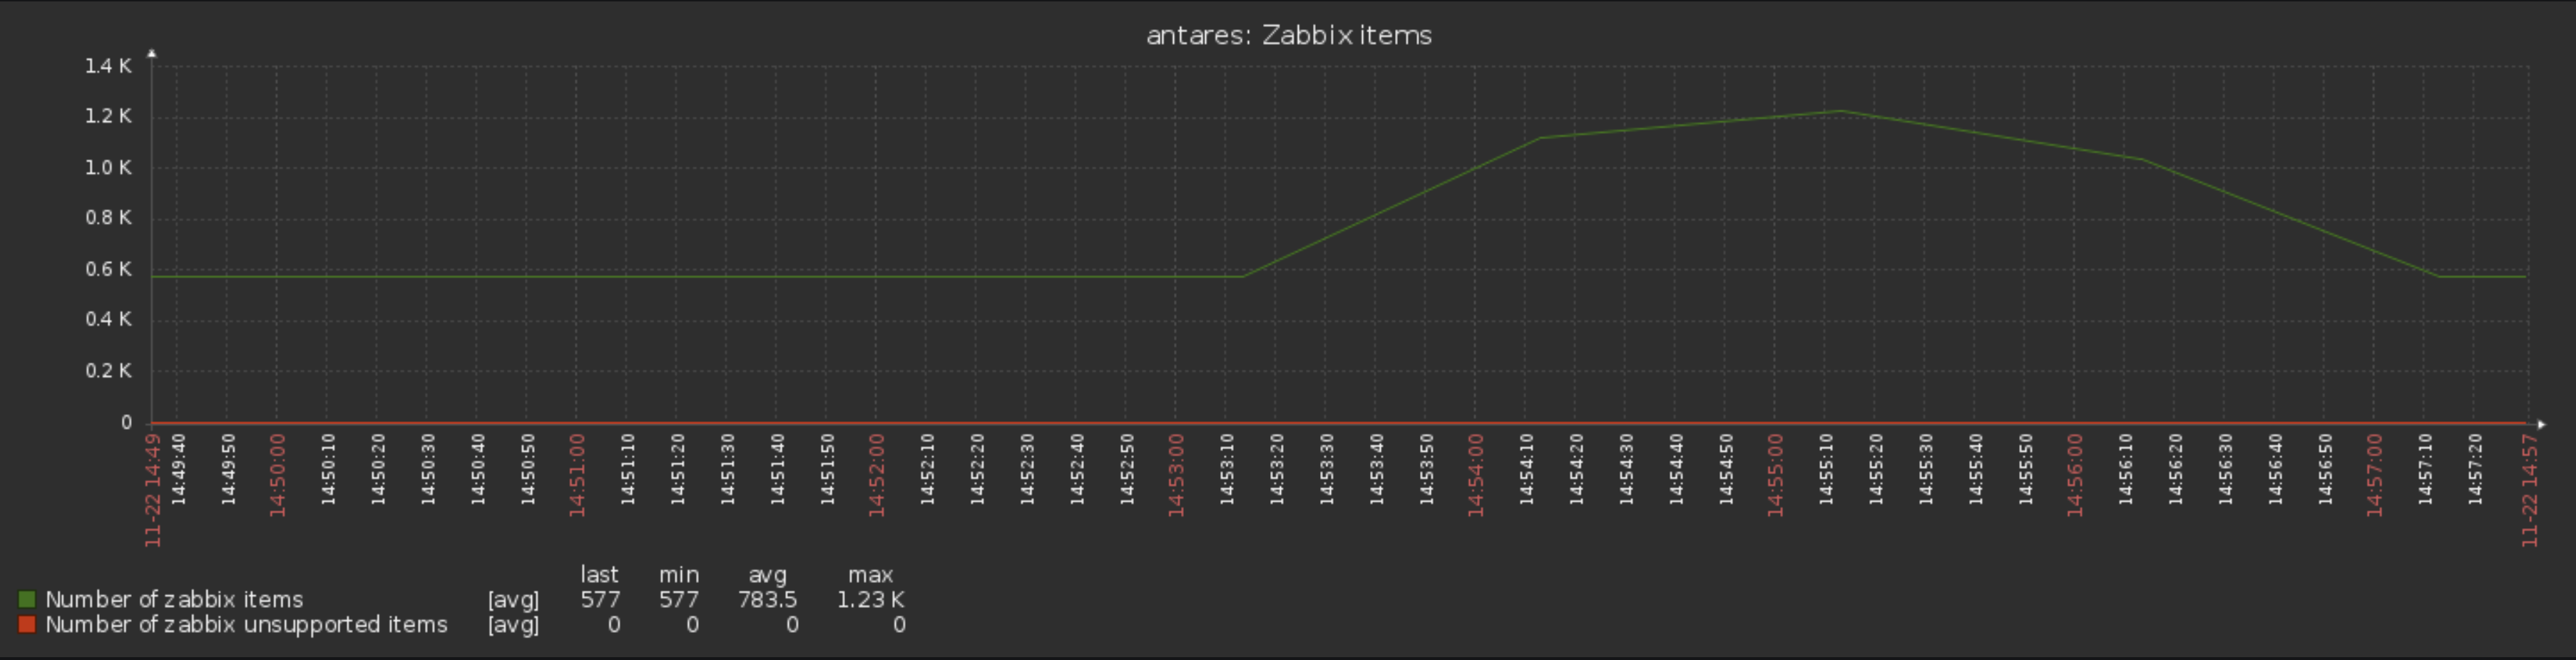
Also in this picture you can see that there was couple of minutes that zabbix[host,,items] returns high values, but i checked host items at that period and there was none additional items in the list. |
| Comment by Ingus Vilnis [ 2018 Nov 22 ] |
|
I do observe the very same behavior in two of my Zabbix instances both currently at 4.0.0. but have not been able to identify what is causing it. More details. So far observed only on Linux / Windows hosts but I now added the item count template to SNMP devices as well. Will see later. The spikes happens at random times, usually on majority of hosts, and sometimes individual hosts. Irregular spikes and in my case not matching the zabbix[items] spikes happen for zabbix[triggers] item. And the same but sometimes matching, sometimes not - zabbix[hosts] I do have Active Agent Autoregistration as well as Network Discovery but they send emails upon every new host. No correlation there. |
| Comment by richlv [ 2018 Nov 22 ] |
|
Does anybody observe this on a host without LLD? Alexander, in any case, to discuss debugging this via API/DB, I'd suggest joining us in the IRC channel - https://zabbix.org/wiki/Getting_help#IRC . |
| Comment by Alexander Ivanes [ 2018 Nov 22 ] |
We don't have hosts without LLD unfortunately, but i'll try disabling LLD on one host to see what'll happen. |
| Comment by Alexander Ivanes [ 2018 Nov 22 ] |
|
Disabling LLD on host doesn't help at all. I ran select (select * from items where hostid=<some test hostid>;) every 3 seconds until there's another spike on that host. There's no changes in DB. Regards, |
| Comment by Vladislavs Sokurenko [ 2018 Nov 22 ] |
|
Can you please do select count(*) from items where flags=0; select count(*) from items where flags=4; |
| Comment by Alexander Ivanes [ 2018 Nov 22 ] |
|
8010; Again: no changes in DB. |
| Comment by Vladislavs Sokurenko [ 2018 Nov 22 ] |
|
Will you be able to test a patch ? Index: src/libs/zbxdbcache/dbconfig.c =================================================================== --- src/libs/zbxdbcache/dbconfig.c (revision 87085) +++ src/libs/zbxdbcache/dbconfig.c (working copy) @@ -9781,7 +9781,7 @@ zbx_uint64_t count; const ZBX_DC_HOST *dc_host; - RDLOCK_CACHE; + WRLOCK_CACHE; dc_status_update(); @@ -9813,7 +9813,7 @@ zbx_uint64_t count; const ZBX_DC_HOST *dc_host; - RDLOCK_CACHE; + WRLOCK_CACHE; dc_status_update(); @@ -9840,7 +9840,7 @@ { zbx_uint64_t count; - RDLOCK_CACHE; + WRLOCK_CACHE; dc_status_update(); |
| Comment by Alexander Ivanes [ 2018 Nov 22 ] |
Sure, but tomorrow if you don't mind. Regards, |
| Comment by Vladislavs Sokurenko [ 2018 Nov 22 ] |
|
it's fine, I think this is the cause but you can check out the patch to confirm, thanks ! |
| Comment by Alexander Ivanes [ 2018 Nov 23 ] |
|
Patched version works fine. Two hours without the spikes so far. |
| Comment by Vladislavs Sokurenko [ 2018 Nov 26 ] |
|
Fixed calculation of hosts, items, triggers count and required performance in development branch: |
| Comment by Andris Zeila [ 2018 Nov 26 ] |
|
Successfully tested, added few explanatory comments in r87223 |
| Comment by Vladislavs Sokurenko [ 2018 Nov 27 ] |
|
Fixed in:
|