|
Can you please provide output of following command ps -ax | grep housekeeper
|
|
Here you go:
root@VIAMON01:~# ps -ax | grep housekeeper
8532 ? S 75:51 /usr/sbin/zabbix_server: housekeeper [deleted 1072744 hist/trends, 0 items/triggers, 485 events, 0 sessions, 0 alarms, 48 audit items in 326.620899 sec, idle for 1 h
9599 pts/0 S+ 0:00 grep --color=auto housekeeper
root@VIAMON01:~#
And this is in the current log:
8532:20181127:230214.167 executing housekeeper
8532:20181127:230757.736 housekeeper [deleted 1109245 hist/trends, 0 items/triggers, 582 events, 49160 problems, 0 sessions, 0 alarms, 48 audit items in 343.568039 sec, idle for 1 hour(s)]
8532:20181128:000758.490 executing housekeeper
8532:20181128:001339.866 housekeeper [deleted 1081922 hist/trends, 0 items/triggers, 632 events, 41895 problems, 0 sessions, 0 alarms, 48 audit items in 341.374635 sec, idle for 1 hour(s)]
8532:20181128:011340.629 executing housekeeper
8532:20181128:011923.259 housekeeper [deleted 1074623 hist/trends, 0 items/triggers, 616 events, 46619 problems, 0 sessions, 0 alarms, 48 audit items in 342.629022 sec, idle for 1 hour(s)]
8532:20181128:021924.059 executing housekeeper
8532:20181128:022440.779 housekeeper [deleted 1067853 hist/trends, 0 items/triggers, 645 events, 43583 problems, 0 sessions, 0 alarms, 48 audit items in 316.719123 sec, idle for 1 hour(s)]
8532:20181128:032443.143 executing housekeeper
8532:20181128:033006.734 housekeeper [deleted 1066194 hist/trends, 0 items/triggers, 4181 events, 44856 problems, 0 sessions, 0 alarms, 48 audit items in 323.589667 sec, idle for 1 hour(s)]
8532:20181128:043007.437 executing housekeeper
8532:20181128:043617.637 housekeeper [deleted 1067690 hist/trends, 0 items/triggers, 11451 events, 42967 problems, 0 sessions, 0 alarms, 48 audit items in 370.199575 sec, idle for 1 hour(s)]
8532:20181128:053618.360 executing housekeeper
8532:20181128:054140.004 housekeeper [deleted 1073042 hist/trends, 0 items/triggers, 475 events, 48047 problems, 0 sessions, 0 alarms, 48 audit items in 321.642726 sec, idle for 1 hour(s)]
8532:20181128:064140.767 executing housekeeper
8532:20181128:064707.390 housekeeper [deleted 1072744 hist/trends, 0 items/triggers, 485 events, 46757 problems, 0 sessions, 0 alarms, 48 audit items in 326.620899 sec, idle for 1 hour(s)]
|
|
Hi Vladislavs,
Here's the housekeeper config:
### Option: HousekeepingFrequency
# How often Zabbix will perform housekeeping procedure (in hours).
# Housekeeping is removing unnecessary information from history, alert, and alarms tables.
#
# Mandatory: no
# Range: 1-24
# Default:
# HousekeepingFrequency=1
### Option: MaxHousekeeperDelete
# The table "housekeeper" contains "tasks" for housekeeping procedure in the format:
# [housekeeperid], [tablename], [field], [value].
# No more than 'MaxHousekeeperDelete' rows (corresponding to [tablename], [field], [value])
# will be deleted per one task in one housekeeping cycle.
# SQLite3 does not use this parameter, deletes all corresponding rows without a limit.
# If set to 0 then no limit is used at all. In this case you must know what you are doing!
#
# Mandatory: no
# Range: 0-1000000
# Default:
# MaxHousekeeperDelete=500
As you can see it's all defaults, which I would think could be the problem but from the log it seems that far more than the default of 500 rows are being deleted in each cycle?
S
|
|
Hi Vladislavs,
Any thoughts on this?
Thanks,
S
|
|
It deletes 1 million records per hour and I believe this is happening
How often Zabbix will perform housekeeping procedure (in hours).
Housekeeping is removing outdated information from the database.
Note: To prevent housekeeper from being overloaded (for example, when history and trend periods are greatly reduced), no more than 4 times HousekeepingFrequency hours of outdated information are deleted in one housekeeping cycle, for each item. Thus, if HousekeepingFrequency is 1, no more than 4 hours of outdated information (starting from the oldest entry) will be deleted per cycle.
Note: To lower load on server startup housekeeping is postponed for 30 minutes after server start. Thus, if HousekeepingFrequency is 1, the very first housekeeping procedure after server start will run after 30 minutes, and will repeat with one hour delay thereafter. This postponing behavior is in place since Zabbix 2.4.0.
Since Zabbix 3.0.0 it is possible to disable automatic housekeeping by setting HousekeepingFrequency to 0. In this case the housekeeping procedure can only be started by housekeeper_execute runtime control option and the period of outdated information deleted in one housekeeping cycle is 4 times the period since the last housekeeping cycle, but not less than 4 hours and not greater than 4 days.
See also runtime control options.
Currently there is no indication of a bug, did table sizes decrease since issue was reported ?
|
|
Hi Vladislavs,
Unfortunately, it's actually increased.
| Table |
MB |
Rows |
| trends_uint |
21,272 |
308,960,609 |
| history_uint |
19,207 |
47,716,390 |
| event_recovery |
13,756 |
69,603,359 |
| EVENTS |
12,862 |
168,186,559 |
| trends |
2,612 |
36,170,968 |
| history_text |
1,691 |
1,847,822 |
| history |
1,612 |
3,453,486 |
| history_str |
567 |
3,333,972 |
| |
|
|
What I'm not clear on is why if the housekeeper runs with our settings, we still have data back to 2014?
Is it worth setting MaxHousekeeperDelete to 10,000,000 to get the old records cleared out?
|
|
Sorry but MaxHousekeeperDelete is unrelated.
Does this value change after you execute housekeepr manually ?
select min(clock) from history_uint;
|
|
1412783475 - Wednesday, 8 October 2014 15:51:15
This is when we first deployed Zabbix.
|
|
Vladislavs, is there any risk in me running a delete on all values in the tables where the clock is less than 1514764800 (2018-01-01)?
Maybe this is the quickest way to resolve the left over data?
S
|
|
Sean, yes, you can do that on the history tables, but if housekeeper has not deleted those old records, this might be a bug.
Or maybe, some items have been configured with very long history?
Can you check the itemid in those old history records and take a look at the item table, to see how long the history should be for those items?
A more recommended solution for removing history would be to monitor the housekeeper process like this:
grep housekeeper /var/log/zabbix/zabbix_server.log
and manually execute housekeeper, when you see that it is idle:
zabbix_server -R housekeeper_execute
It would be really useful for us, to see, if there is a problem with housekeeper. And if those old items will be deleted by housekeeper, if it finishes deleting all the other history
|
|
Item configuration should not matter because
we've reduced the history period to 1d in Administration > Housekeeping
|
|
The item might have been with that history setting before this was introduced. I am no sure, if housekeeper first deletes the oldest records, if not, it might have not yet gotten to these oldest ones.
|
|
Thank you both for your responses.
The override on the history (and events etc.) was a recent edition to try to reduce the DB size ahead of the v3 to v4 upgrade which we have planned.
Here are the last two runs of the housekeeper:
8532:20181203:101202.850 housekeeper [deleted 1056775 hist/trends, 124 items/triggers, 674 events, 53768 problems, 0 sessions, 0 alarms, 451 audit items in 404.063582 sec, idle for 1 hour(s)]

 8532:20181203:111921.769 housekeeper [deleted 1031998 hist/trends, 0 items/triggers, 636 events, 55726 problems, 0 sessions, 0 alarms, 224 audit items in 438.031691 sec, idle for 1 hour(s)]
Each time, just over 1m records are deleted and it runs for about 7min.
Is there a way for it to run for longer?
And to Edgar's point, will it delete the oldest data first, or the newest?
|
|
It seems that housekeeper may not delete oldest records of deleted items if they are way older than the oldest records of other items.
vso thanks a lot glebs ! you mean that no longer than a day can be deleted in that case ?
cyclone I mean that when you do select min(clock) from history; you may be looking at deleted items and maybe housekeeper gave up on them. I think it's worth checking oldest records by item:
Then check if these items still exist:
vso that's interesting, possible cause is described in ZBX-13140
Note that similar problem exists for history, since new history will be added while item remain in cache and this can be after housekeeper was executed. But still history will be cleared after max storage period while events will no longer be cleared.
|
|
You could try something like that to determine itemid with oldest history
select * from history_uint order by clock limit 1;
Then increase log level for housekeeper and see if there are any delete queries for that itemid
zabbix_server -R log_level_increase=housekeeper
|
|
Here you go:
8532:20181203:134431.452 forced execution of the housekeeper
 8532:20181203:134431.452 executing housekeeper
 8532:20181203:134431.452 __zbx_zbx_setproctitle() title:'housekeeper [connecting to the database]'
 8532:20181203:134431.453 __zbx_zbx_setproctitle() title:'housekeeper [removing old history and trends]'
 8532:20181203:134813.685 __zbx_zbx_setproctitle() title:'housekeeper [removing old problems]'
 8532:20181203:134814.574 __zbx_zbx_setproctitle() title:'housekeeper [removing old events]'
 8532:20181203:134814.674 __zbx_zbx_setproctitle() title:'housekeeper [removing old sessions]'
 8532:20181203:134814.675 __zbx_zbx_setproctitle() title:'housekeeper [removing old service alarms]'
 8532:20181203:134814.675 __zbx_zbx_setproctitle() title:'housekeeper [removing old audit log items]'
 8532:20181203:134814.683 __zbx_zbx_setproctitle() title:'housekeeper [removing deleted items data]'
 8532:20181203:134814.683 query [txnlev:0] [select housekeeperid,tablename,field,value from housekeeper where tablename in ('history','history_log','history_str','history_text','history_uint','trends','trends_uint','events') order by tablename]
 8532:20181203:134814.684 housekeeper [deleted 324064 hist/trends, 0 items/triggers, 539 events, 11532 problems, 0 sessions, 0 alarms, 48 audit items in 223.230491 sec, idle for 1 hour(s)]
 8532:20181203:134814.684 __zbx_zbx_setproctitle() title:'housekeeper [deleted 324064 hist/trends, 0 items/triggers, 539 events, 0 sessions, 0 alarms, 48 audit items in 223.230491 sec, idle for 1 hour(s)]'
select itemid,min(clock) as min_clock from history group by itemid order by min_clock asc limit 10;
| 26924 |
1538909324 |
| 26936 |
1538909336 |
| 158300 |
1538909393 |
| 27032 |
1538909440 |
| 27110 |
1538909518 |
| 27113 |
1538909521 |
| 27116 |
1538909524 |
| 27119 |
1538909527 |
| 27122 |
1538909529 |
| 31953 |
1538909554 |
select * from items where itemid in (26924,26936,158300,27032,27110,27113,27116,27119,27122,31953);
| 26924 |
0 |
|
|
10121 |
Free disk space on l: in % |
vfs.fs.size[l:,pfree] |
10m |
90d |
365d |
0 |
0 |
|
% |
|
0 |
|
|
|
|
0 |
|
\N |
\N |
|
|
0 |
|
|
|
|
0 |
0 |
3 |
|
|
0 |
30d |
0 |
0 |
0 |
|
0 |
|
\N |
| 26936 |
0 |
public |
interfaces.ifTable.ifEntry.ifInOctets.1 |
10121 |
Free disk space on m: in % |
vfs.fs.size[m:,pfree] |
10m |
90d |
365d |
0 |
0 |
|
% |
|
0 |
|
|
|
|
0 |
|
\N |
\N |
last("vfs.fs.size[m:,free]")/last("vfs.fs.size[m:,total]") |
|
0 |
|
|
|
|
0 |
0 |
3 |
|
|
0 |
30d |
0 |
0 |
0 |
|
0 |
|
\N |
| 27032 |
0 |
public |
interfaces.ifTable.ifEntry.ifInOctets.1 |
10194 |
Free disk space on e: in % |
vfs.fs.size[e:,pfree] |
10m |
90d |
365d |
0 |
0 |
|
% |
|
0 |
|
|
|
|
0 |
|
\N |
\N |
last("vfs.fs.size[e:,free]")/last("vfs.fs.size[e:,total]") |
|
0 |
|
|
|
|
0 |
0 |
59 |
|
|
0 |
30d |
0 |
0 |
0 |
|
0 |
|
\N |
| 27110 |
0 |
public |
interfaces.ifTable.ifEntry.ifInOctets.1 |
10199 |
Free disk space on e: in % |
vfs.fs.size[e:,pfree] |
10m |
90d |
365d |
0 |
0 |
|
% |
|
0 |
|
|
|
|
0 |
|
\N |
\N |
last("vfs.fs.size[e:,free]")/last("vfs.fs.size[e:,total]") |
|
0 |
|
|
|
|
0 |
0 |
64 |
|
|
0 |
30d |
0 |
0 |
0 |
|
0 |
|
\N |
| 27113 |
0 |
|
|
10199 |
Free disk space on f: in % |
vfs.fs.size[f:,pfree] |
10m |
90d |
365d |
0 |
0 |
localhost |
% |
|
0 |
|
|
|
|
0 |
|
\N |
\N |
last("vfs.fs.size[f:,free]")/last("vfs.fs.size[f:,total]") |
|
0 |
|
|
|
|
0 |
0 |
64 |
|
|
0 |
30d |
0 |
0 |
0 |
|
0 |
|
\N |
| 27116 |
0 |
public |
interfaces.ifTable.ifEntry.ifInOctets.1 |
10199 |
Free disk space on g: in % |
vfs.fs.size[g:,pfree] |
10m |
90d |
365d |
0 |
0 |
|
% |
|
0 |
|
|
|
|
0 |
|
\N |
\N |
last("vfs.fs.size[g:,free]")/last("vfs.fs.size[g:,total]") |
|
0 |
|
|
|
|
0 |
0 |
64 |
|
|
0 |
30d |
0 |
0 |
0 |
|
0 |
|
\N |
| 27119 |
0 |
|
|
10199 |
Free disk space on h: in % |
vfs.fs.size[h:,pfree] |
10m |
90d |
365d |
0 |
0 |
localhost |
% |
|
0 |
|
|
|
|
0 |
|
\N |
\N |
last("vfs.fs.size[h:,free]")/last("vfs.fs.size[h:,total]") |
|
0 |
|
|
|
|
0 |
0 |
64 |
|
|
0 |
30d |
0 |
0 |
0 |
|
0 |
|
\N |
| 27122 |
0 |
|
|
10199 |
Free disk space on i: in % |
vfs.fs.size[i:,pfree] |
10m |
90d |
365d |
0 |
0 |
localhost |
% |
|
0 |
|
|
|
|
0 |
|
\N |
\N |
last("vfs.fs.size[i:,free]")/last("vfs.fs.size[i:,total]") |
|
0 |
|
|
|
|
0 |
0 |
64 |
|
|
0 |
30d |
0 |
0 |
0 |
|
0 |
|
\N |
| 31953 |
0 |
|
|
10084 |
Text Magic Balance |
textmagic.balance |
10m |
90d |
365d |
0 |
0 |
|
|
|
0 |
|
|
|
|
0 |
|
\N |
\N |
|
|
0 |
|
|
|
|
0 |
0 |
1 |
|
|
0 |
30d |
0 |
0 |
0 |
|
0 |
|
\N |
| 158300 |
10 |
|
|
10807 |
Enclosure[1] Power |
hp-msa.pl[\{$MSA1},\{$USER},\{$PASSWORD},"data", "enclosure", 1, "enclosure-power"] |
180 |
90d |
365d |
0 |
0 |
|
W |
|
0 |
|
|
|
|
0 |
|
\N |
\N |
|
|
0 |
|
|
|
|
0 |
4 |
905 |
|
|
0 |
30d |
0 |
0 |
0 |
|
0 |
|
\N |
select * from hosts where hostid in (10121,10121,10194,10199,10199,10199,10199,10199,10084,10807);
| 10084 |
\N |
VIAMON01 |
0 |
0 |
|
1 |
0 |
0 |
-1 |
2 |
|
|
0 |
0 |
0 |
0 |
\N |
0 |
0 |
0 |
0 |
0 |
|
|
0 |
0 |
0 |
|
VIAMON01 |
0 |
\N |
|
1 |
1 |
| 10121 |
\N |
VIAEX01 |
0 |
0 |
|
1 |
0 |
0 |
-1 |
2 |
|
|
0 |
0 |
0 |
0 |
\N |
0 |
0 |
0 |
0 |
0 |
|
|
0 |
0 |
0 |
|
VIAEX01 |
0 |
\N |
|
1 |
1 |
| 10194 |
11241 |
KRTHAYDC02 |
0 |
0 |
|
1 |
0 |
0 |
0 |
2 |
|
|
0 |
0 |
0 |
0 |
\N |
0 |
0 |
0 |
0 |
0 |
|
|
0 |
0 |
0 |
|
KRTHAYDC02 |
0 |
\N |
|
1 |
1 |
| 10199 |
11241 |
KRTHAYEXCH01 |
1 |
0 |
Get value from agent failed: cannot connect to [[192.168.0.9]:10050]: [113] No route to host |
2 |
0 |
0 |
0 |
2 |
|
|
0 |
0 |
0 |
0 |
\N |
0 |
0 |
0 |
0 |
0 |
|
|
0 |
0 |
0 |
|
KRTHAYEXCH01 |
0 |
\N |
|
1 |
1 |
| 10807 |
10786 |
SeligUK-SAN01 |
0 |
0 |
|
0 |
0 |
0 |
-1 |
2 |
|
|
0 |
0 |
0 |
1 |
\N |
0 |
0 |
0 |
0 |
0 |
|
|
0 |
0 |
0 |
|
SeligUK-SAN01 |
0 |
\N |
|
1 |
1 |
|
|
Hi guys,
I was just thinking, how big problem is there and where exactly is the issue. I.e. we know there is data old than the housekeeper override, but how much.
Here's my query to work this out:
select
 (select count(*) from history where clock < 1543590391) as 'history count', -- 3 days
 (select count(*) from history_uint where clock < 1543590391) as 'history_uint count', -- 3 days
 (select count(*) from history_text where clock < 1543590391) as 'history_text count', -- 3 days
 (select count(*) from events where clock < 1533308791) as 'events count', -- 4 months
 (select count(*) from trends where clock < 1512227191) as 'trends count', -- 1 year and 1 day
 (select count(*) from trends_uint where clock < 1512227191) as 'trends_uint count' -- 1 year and 1 day
from dual
Values are just a little longer than configured in the overrides:
| history count |
156,109 |
| history_uint count |
19,509,603 |
| history_text count |
1,139,830 |
| events count |
24,750,112 |
| trends count |
1,466 |
| trends_uint count |
7,609 |
So if we could address the history_uint and events tables, that would make a big difference.
S
|
|
I am sorry, but could you please do query that cyclone provided for all history tables ?
select itemid,min(clock) as min_clock from history_uint group by itemid order by min_clock asc limit 10;
select itemid,min(clock) as min_clock from trends_uint group by itemid order by min_clock asc limit 10;
Thanks allot !
|
|
Here you go:
select itemid,min(clock) as min_clock from history_uint group by itemid order by min_clock asc limit 10;
| 27735 |
1412783475 |
| 27736 |
1412783476 |
| 27738 |
1412783478 |
| 27729 |
1412783529 |
| 27730 |
1412783770 |
| 27731 |
1412783771 |
| 27746 |
1412786786 |
| 27728 |
1412789168 |
| 27740 |
1412801780 |
| 27732 |
1412814071 |
select itemid,min(clock) as min_clock from trends_uint group by itemid order by min_clock asc limit 10;
| 23943 |
1412769600 |
| 23944 |
1412769600 |
| 23946 |
1412769600 |
| 27729 |
1412780400 |
| 27730 |
1412780400 |
| 27731 |
1412780400 |
| 27735 |
1412780400 |
| 27736 |
1412780400 |
| 27738 |
1412780400 |
| 27630 |
1412784000 |
|
|
Do those items exist ?
|
|
Here you go:
select * from items where itemid in (23943,23944,23946,27630,27728,27729,27730,27731,27732,27735,27736,27738,27740,27746)
| 27728 |
0 |
|
|
10197 |
Total % CPU |
perf_counter["\Processor(_Total)\% Processor Time"] |
5m |
1w |
365d |
0 |
0 |
|
% |
|
0 |
|
|
|
|
0 |
|
27727 |
\N |
|
|
0 |
|
|
|
|
0 |
0 |
62 |
|
|
0 |
30d |
0 |
0 |
0 |
|
0 |
|
\N |
| 27729 |
0 |
|
|
10196 |
Total % CPU |
perf_counter["\Processor(_Total)\% Processor Time"] |
5m |
1w |
365d |
0 |
0 |
|
% |
|
0 |
|
|
|
|
0 |
|
27727 |
\N |
|
|
0 |
|
|
|
|
0 |
0 |
61 |
|
|
0 |
30d |
0 |
0 |
0 |
|
0 |
|
\N |
| 27730 |
0 |
|
|
10194 |
Total % CPU |
perf_counter["\Processor(_Total)\% Processor Time"] |
5m |
1w |
365d |
0 |
0 |
|
% |
|
0 |
|
|
|
|
0 |
|
27727 |
\N |
|
|
0 |
|
|
|
|
0 |
0 |
59 |
|
|
0 |
30d |
0 |
0 |
0 |
|
0 |
|
\N |
| 27731 |
0 |
|
|
10192 |
Total % CPU |
perf_counter["\Processor(_Total)\% Processor Time"] |
5m |
1w |
365d |
0 |
0 |
|
% |
|
0 |
|
|
|
|
0 |
|
27727 |
\N |
|
|
0 |
|
|
|
|
0 |
0 |
57 |
|
|
0 |
30d |
0 |
0 |
0 |
|
0 |
|
\N |
| 27732 |
0 |
|
|
10199 |
Total % CPU |
perf_counter["\Processor(_Total)\% Processor Time"] |
5m |
1w |
365d |
0 |
0 |
|
% |
|
0 |
|
|
|
|
0 |
|
27727 |
\N |
|
|
0 |
|
|
|
|
0 |
0 |
64 |
|
|
0 |
30d |
0 |
0 |
0 |
|
0 |
|
\N |
| 27735 |
0 |
|
|
10185 |
Total % CPU |
perf_counter["\Processor(_Total)\% Processor Time"] |
5m |
1w |
365d |
0 |
0 |
|
% |
|
0 |
|
|
|
|
0 |
|
27727 |
\N |
|
|
0 |
|
|
|
|
0 |
0 |
50 |
|
|
0 |
30d |
0 |
0 |
0 |
|
0 |
|
\N |
| 27736 |
0 |
|
|
10200 |
Total % CPU |
perf_counter["\Processor(_Total)\% Processor Time"] |
5m |
1w |
365d |
0 |
0 |
|
% |
|
0 |
|
|
|
|
0 |
|
27727 |
\N |
|
|
0 |
|
|
|
|
0 |
0 |
65 |
|
|
0 |
30d |
0 |
0 |
0 |
|
0 |
|
\N |
| 27738 |
0 |
|
|
10198 |
Total % CPU |
perf_counter["\Processor(_Total)\% Processor Time"] |
5m |
1w |
365d |
0 |
0 |
|
% |
|
0 |
|
|
|
|
0 |
|
27727 |
\N |
|
|
0 |
|
|
|
|
0 |
0 |
63 |
|
|
0 |
30d |
0 |
0 |
0 |
|
0 |
|
\N |
| 27740 |
0 |
|
|
10201 |
Total % CPU |
perf_counter["\Processor(_Total)\% Processor Time"] |
5m |
1w |
365d |
0 |
0 |
|
% |
|
0 |
|
|
|
|
0 |
|
27727 |
\N |
|
|
0 |
|
|
|
|
0 |
0 |
66 |
|
|
0 |
30d |
0 |
0 |
0 |
|
0 |
|
\N |
| 27746 |
0 |
|
|
10189 |
Total % CPU |
perf_counter["\Processor(_Total)\% Processor Time"] |
5m |
1w |
365d |
0 |
0 |
|
% |
|
0 |
|
|
|
|
0 |
|
27727 |
\N |
|
|
0 |
|
|
|
|
0 |
0 |
54 |
|
|
0 |
30d |
0 |
0 |
0 |
|
0 |
|
\N |
vso I am sorry it's very hard to understand, could you please select one value for example:
select * from items where itemid=27728\G
|
|
Could you please do:
show create table items;
select * from hosts where hostid=10197;
|
|
Here you go:
"items" "CREATE TABLE `items` (
 `itemid` bigint(20) unsigned NOT NULL,
 `type` int(11) NOT NULL DEFAULT '0',
 `snmp_community` varchar(64) COLLATE utf8mb4_bin NOT NULL DEFAULT '',
 `snmp_oid` varchar(512) COLLATE utf8_bin NOT NULL DEFAULT '',
 `hostid` bigint(20) unsigned NOT NULL,
 `name` varchar(255) COLLATE utf8_bin NOT NULL DEFAULT '',
 `key_` varchar(255) COLLATE utf8_bin NOT NULL DEFAULT '',
 `delay` varchar(1024) COLLATE utf8_bin NOT NULL DEFAULT '0',
 `history` varchar(255) COLLATE utf8_bin NOT NULL DEFAULT '90d',
 `trends` varchar(255) COLLATE utf8_bin NOT NULL DEFAULT '365d',
 `status` int(11) NOT NULL DEFAULT '0',
 `value_type` int(11) NOT NULL DEFAULT '0',
 `trapper_hosts` varchar(255) COLLATE utf8_bin NOT NULL DEFAULT '',
 `units` varchar(255) COLLATE utf8_bin NOT NULL DEFAULT '',
 `snmpv3_securityname` varchar(64) COLLATE utf8_bin NOT NULL DEFAULT '',
 `snmpv3_securitylevel` int(11) NOT NULL DEFAULT '0',
 `snmpv3_authpassphrase` varchar(64) COLLATE utf8_bin NOT NULL DEFAULT '',
 `snmpv3_privpassphrase` varchar(64) COLLATE utf8_bin NOT NULL DEFAULT '',
 `formula` varchar(255) COLLATE utf8_bin NOT NULL DEFAULT '',
 `error` varchar(2048) COLLATE utf8_bin NOT NULL DEFAULT '',
 `lastlogsize` bigint(20) unsigned NOT NULL DEFAULT '0',
 `logtimefmt` varchar(64) COLLATE utf8_bin NOT NULL DEFAULT '',
 `templateid` bigint(20) unsigned DEFAULT NULL,
 `valuemapid` bigint(20) unsigned DEFAULT NULL,
 `params` text COLLATE utf8_bin NOT NULL,
 `ipmi_sensor` varchar(128) COLLATE utf8_bin NOT NULL DEFAULT '',
 `authtype` int(11) NOT NULL DEFAULT '0',
 `username` varchar(64) COLLATE utf8_bin NOT NULL DEFAULT '',
 `password` varchar(64) COLLATE utf8_bin NOT NULL DEFAULT '',
 `publickey` varchar(64) COLLATE utf8_bin NOT NULL DEFAULT '',
 `privatekey` varchar(64) COLLATE utf8_bin NOT NULL DEFAULT '',
 `mtime` int(11) NOT NULL DEFAULT '0',
 `flags` int(11) NOT NULL DEFAULT '0',
 `interfaceid` bigint(20) unsigned DEFAULT NULL,
 `port` varchar(64) COLLATE utf8_bin NOT NULL DEFAULT '',
 `description` text COLLATE utf8_bin NOT NULL,
 `inventory_link` int(11) NOT NULL DEFAULT '0',
 `lifetime` varchar(255) COLLATE utf8_bin NOT NULL DEFAULT '30d',
 `snmpv3_authprotocol` int(11) NOT NULL DEFAULT '0',
 `snmpv3_privprotocol` int(11) NOT NULL DEFAULT '0',
 `state` int(11) NOT NULL DEFAULT '0',
 `snmpv3_contextname` varchar(255) COLLATE utf8_bin NOT NULL DEFAULT '',
 `evaltype` int(11) NOT NULL DEFAULT '0',
 `jmx_endpoint` varchar(255) COLLATE utf8_bin NOT NULL DEFAULT '',
 `master_itemid` bigint(20) unsigned DEFAULT NULL,
 PRIMARY KEY (`itemid`),
 UNIQUE KEY `items_1` (`hostid`,`key_`),
 KEY `items_3` (`status`),
 KEY `items_4` (`templateid`),
 KEY `items_5` (`valuemapid`),
 KEY `items_6` (`interfaceid`),
 KEY `items_7` (`master_itemid`),
 CONSTRAINT `c_items_1` FOREIGN KEY (`hostid`) REFERENCES `hosts` (`hostid`) ON DELETE CASCADE,
 CONSTRAINT `c_items_2` FOREIGN KEY (`templateid`) REFERENCES `items` (`itemid`) ON DELETE CASCADE,
 CONSTRAINT `c_items_3` FOREIGN KEY (`valuemapid`) REFERENCES `valuemaps` (`valuemapid`),
 CONSTRAINT `c_items_4` FOREIGN KEY (`interfaceid`) REFERENCES `interface` (`interfaceid`),
 CONSTRAINT `c_items_5` FOREIGN KEY (`master_itemid`) REFERENCES `items` (`itemid`) ON DELETE CASCADE
) ENGINE=InnoDB DEFAULT CHARACTER SET utf8mb4 COLLATE utf8mb4_bin"
select * from hosts where hostid=10197;
| 10197 |
11241 |
KRTHAYDC01 |
0 |
0 |
|
1 |
0 |
0 |
0 |
2 |
|
|
0 |
0 |
0 |
0 |
\N |
0 |
0 |
0 |
0 |
0 |
|
|
0 |
0 |
0 |
|
KRTHAYDC01 |
0 |
\N |
|
1 |
1 |
|
|
|
|
|
|
I'm sorry, I don't understand?
|
|
Please execute following query
select * from items where itemid=27728\G
Also it would be nice to have log level increased for housekeeper and attaching log
|
|
The logging was increased previously, unless you mean increasing it further? Here's the grep'd log:housekeeper.txt
select * from items where itemid=27728
| 27728 |
0 |
|
|
10197 |
Total % CPU |
perf_counter["\Processor(_Total)\% Processor Time"] |
5m |
1w |
365d |
0 |
0 |
|
% |
|
0 |
|
|
|
|
0 |
|
27727 |
\N |
|
|
0 |
|
|
|
|
0 |
0 |
62 |
|
|
0 |
30d |
0 |
0 |
0 |
|
0 |
|
\N |
|
|
I mean exactly
select * from items where itemid=27728\G
with \G in the end, otherwise it’s not readable
|
|
Also you can try grep in log for itemid 27728
|
|
Right, I'm running these from HeidiSQL, here you go:
mysql> select * from items where itemid=27728\G;
*************************** 1. row ***************************
 itemid: 27728
 type: 0
 snmp_community:
 snmp_oid:
 hostid: 10197
 name: Total % CPU
 key_: perf_counter["\Processor(_Total)\% Processor Time"]
 delay: 5m
 history: 1w
 trends: 365d
 status: 0
 value_type: 0
 trapper_hosts:
 units: %
 snmpv3_securityname:
 snmpv3_securitylevel: 0
snmpv3_authpassphrase:
snmpv3_privpassphrase:
 formula:
 error:
 lastlogsize: 0
 logtimefmt:
 templateid: 27727
 valuemapid: NULL
 params:
 ipmi_sensor:
 authtype: 0
 username:
 password:
 publickey:
 privatekey:
 mtime: 0
 flags: 0
 interfaceid: 62
 port:
 description:
 inventory_link: 0
 lifetime: 30d
 snmpv3_authprotocol: 0
 snmpv3_privprotocol: 0
 state: 0
 snmpv3_contextname:
 evaltype: 0
 jmx_endpoint:
 master_itemid: NULL
1 row in set (0.00 sec)
27728 wasn't found in the log but I had debug at 3 and a file size of 100MB so the log file was truncating too quickly. Now set debug to 2, increased log file to 500MB and increase debug on housekeeper only.
I'll check it in the morning again.
|
|
I see that history for itemid 27728 has a timestamp of 10/08/2014 while item is still present for it as well as host, both item and host status is 0 which is OK.
Can you please grep log to see if there are such entries at all:
|
|
I've increased the housekeeper log to 4 and manually started the housekeeper and yes I see many:
|
|
I just noticed this at the end of the housekeeping cycle:
After kicking off the housekeeper again without waiting for the next cycle in an house, here's the result:
Looking at the query, it limits to 5000, does this mean that a maximum of 5000 events will be deleted in each house keeping cycle?
We have 24m events records older than the override setting of 90 days, could this be why they aren't being cleared out? Here's the tail end of the log for your reference: housekeeper.txt
Though I note only 536 events were deleted. Why aren't far more events being deleted?
|
|
I am sorry, please also do, this would give clear picture of item and host that for some reason don't get history deleted:
select * from hosts where hostid=10197\G
select count(*),min(clock),max(clock) from history_uint where itemid=27728\G
|
|
|
|
I am a little bit confused because there are only 2 values, this could mean that housekeeper cleans up them every hour but for some reason they come from agent with such old timestamp.
Is it possible ?
|
|
Hi Vladislavs, what shall I check/do next to troubleshoot this?
|
|
You could try query below to determine the proxy and then check if there is anything wrong with time on that proxy.
select * from hosts where hostid=11241\G;
|
|
Looks fine to me:
|
|
I mean with fuzzytime item as an example
|
|
I don't understand, please explain.
|
|
Vladislavs, can you explain what you mean by fuzzytime in the context of the query?
|
|
I mean fuzzytime zabbix item, or system.localtime do you have access to that proxy to see if it has correct time ?
|
|
Right, I understand.
The time on KRTHAYPROXY01 is about 20s out:
| Name/Key |
Last Check |
Last Value |
| Host local time |
2018-12-11 08:28:58 |
2018-12-11 08:28:36 |
|
|
I believe it should have been this proxy:
KRT-PROXY01
It is strange that there are only 2 values and with old timestamps in database for the item with itemid 27728 I think they are received with incorrect timestamp, can you confirm this ?
|
|
Hmmm, looks OK to me:
|
|
Previously it was not fine, here is what previously was reported:
mysql> select count( * ),min(clock),max(clock) from history_uint where itemid=27728\G;
*************************** 1. row ***************************
count( * ): 2
min(clock): 1412789168
max(clock): 1412810168
1 row in set (0.00 sec)
Which is 10/08/2014 @ 5:26pm (UTC)
Do you still have old history entries in database or issue no longer occurs ?
|
|
Apologies, I was checking history, opposed to history_uint.
The values above do still exist in history_uint.
The proxy KRT-PROXY01 is actually host KRTHAYPROXY01.
|
|
There are only 2 history values for this item that is supposed to be polled every 5 minutes.
Those values are for type history_uint while new values come as float.
It means that at some point of 2014 you have changed item from history_uint to history and zabbix now only clear history, while history_uint contains old data.
I will try to reproduce it locally but issues seems clear now.
|
|
Correct, the table with issues appears to be history_uint and not history.
The events table is also an issue, could these two be related?
|
|
It should not be related to events table at all, events are only cleared if corresponding problem is resolved, is it possible that you have lots of unresolved problems ?
|
|
We currently have 69 triggers in a problem state.
And we have 24 million events older than the override set in housekeeping.
vso in this case please increase MaxHousekeeperDelete or set to 0 and see how it goes.
|
|
What is a reasonable / safe setting to start out?
vso this question could be addressed to our support unfortunately I cannot answer, would try 10000 though and see how long it took for housekeeper to delete those with ps -ax | grep housekeeper then increase accordingly.
|
|
I set MaxHousekeeperDelete to 10000 as suggested and manually ran the housekeeper with the following result:
Nope only 506 events were deleted. I'm not sure what the setting does as far more than 10,000 values are being deleted, 792,312 history/trends!
Is this setting being ignored?
|
|
Hi guys,
I've done another test, I set the MaxHousekeeperDelete to a value of 10 and the number of records deleted didn't change, leading me to believe this setting is being ignored, perhaps another bug?
|
|
MaxHousekeeperDelete is only relevant to items, that have been removed, so, for those items all history must be removed. And no more, than the value in this setting will be removed. (For safety, if you remove a large number of items on a big instance, housekeeper could run for very long time). This does not effect records, which should be deleted, because of history settings.
|
|
Understood, thank you.
So we're still not sure why the history and events aren't being deleted?
|
|
I would suggest running the houskeeper manually for some time, there is another, hard-coded, limit to how much actual history it will delete in one attempt.
|
|
We have 24 million events records and 19 million history_uint records which should be there.
Each run it only deleted around 500 events and 800,000 history/trends, so that's not a workable solution.
Do we need to get to the bottom of why they data is there and not being deleted or could we simply delete it directly in MySQL?
|
|
Thoughts on if we can simply delete the old data which isn't being cleared out?
|
|
Hi all,
Where are we on this issue?
In the meantime, could you provide advice on clearing out the old data so that we can upgrade our Zabbix instance?
Thanks,
S
|
|
You had 150 million events so this number slowly decreases ?
|
|
I ran the following query to show which tables aren't being cleared out by the housekeeper in-line with the housekeeper settings:
The results from yesterday:
And the results this morning:
As you can see, there are 50 million records in the event table which aren't being cleared out.
The total count on the event table is 247 million, is this normal? It's seems really high.
The event_recovery table is also massive at 123 million records.
|
|
Are those events open problems ? Only closed problems are cleared.
select count from problem where r_eventid is null; from problem where r_eventid is null;
|
|
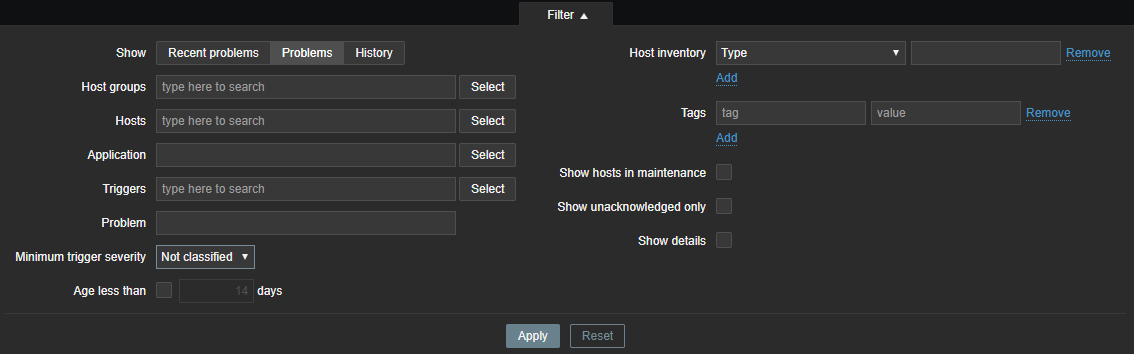
If I browse to Monitoring > Problems, and leave all configuration blank, there are 63 problems reported, not 247 million:

mysql> select count from problem where r_eventid is null\G;
-
-
-
-
-
-
-
-
-
-
-
-
-
-
-
-
-
-
-
-
-
-
-
-
-
-
- 1. row ***************************
count: 2947
1 row in set (0.00 sec)
|
|
does min clock in events slowly increase ?
select min(clock) from events;
Also what happened to history tables ? Did they eventually get cleaned ?
|
|
|
|
Here are the last two runs of the housekeeper with the count run before and after, the clock isn't increasing:
20258:20190104:102713.745 executing housekeeper
20258:20190104:103150.262 housekeeper [deleted 964550 hist/trends, 20 items/triggers, 657 events, 772 problems, 0 sessions, 0 alarms, 48 audit items in 276.516237 sec, idle for 1 hour(s)]
20258:20190104:113150.978 executing housekeeper
20258:20190104:113629.978 housekeeper [deleted 963810 hist/trends, 20 items/triggers, 824 events, 2704 problems, 0 sessions, 0 alarms, 48 audit items in 278.998533 sec, idle for 1 hour(s)]
The history table is looking far better now, here are the counts outside the housekeeper settings for yesterday, note this excludes the event_recovery table:
|
|
Please execute this:
select e.eventid from events e left join problem p on p.eventid=e.eventid where e.clock=1506511555;
|
|
Here you go:
|
|
select * from problem where eventid=35986830;
|
|
Here you go:
|
|
I see no reason why it wouldn't get deleted on 3.0.24, could you please provide screenshot of housekeeper settings ?
|
|
Note as stated originally, we're running v3.4.14.

The MaxHousekeeperDelete value hasn't made any difference at any point.
|
|
Did you restart server after changing MaxHousekeeperDelete ? I would check the log and look for "select from events" queries or "In housekeeping_process_rule() table:" keyword
From "In housekeeping_process_rule() table" keyword you can see the progress, for example in your log
14157:20181206:090744.631 In housekeeping_process_rule() table:'events' field_name:'eventid' filter:'events.source=0 and events.object=0 and not exists (select null from problem where events.eventid=problem.eventid) and not exists (select null from problem where events.eventid=problem.r_eventid)' min_clock:1516077850 now:1544086863
means that it currently delete till Tue Jan 16 06:44:10 EET 2018 while time was Thu Dec 6 11:01:03 EET 2018
So you need to wait until it reaches that time
|
|
I've increases debug to 4 and started the housekeeper.
In case it's relevant, I see loads of these:
And here are the events logs, nowhere near the min clock that actually exists:
End result:
|
|
Now min clock is Thu May 3 11:54:04 EEST 2018 while it was Tue Jan 16 06:44:10 EET 2018 so it's slowly moving forward.
|
|
So with 247 million records in the table, at an average of 747 per 1 hour cycle over the past 50 cycles, it's going to take 38 years to clear that down assuming new data doesn't arrive.
Surely this can't be correct?
|
|
It deletes 4 hours worth of events per hour so it can take long but not years, otherwise database will be overloaded.
|
|
I don't think there's an error in my maths, if 4h of events = 747 records, that's what is being deleted. That will take 38 years at the current rate.
Is there any way to speed this up? Is there a way to run the housekeeper manually but just for the events piece?
Remembering the motivation is to reduce the DB size as far as possible to allow us to upgrade to v4 with minimal downtime.
|
|
Actually there is an error, i'll explain:
Housekeeper deletes 4 hours of events at each iteration, but there is no limit on amount of events here. So, the actual amount of deleted events depends on how many events where generated in some historic 4 hour window.
As I stated before, you can manually execute housekeeper to run more frequently with command:
zabbix_server -R housekeeper_execute
You should watch how much load this creates on the DB and execute the command as frequently as the DB load allows.
|
|
This isn't useful in reducing the DB size. The housekeeper also isn't able to run continually for a period and has to be started manually which isn't useful either.
There is no way we've had 247 million+ events in 4.5 years we've run Zabbix, something along the way has gone crazy and massively increased the DB size, particularly the events table and the housekeeper isn't built to deal with this many records.
What would the impact be of truncating the events and event_recovery tables and starting the Server?
The upgrade process is way too inefficient to deal with tables this size.
|
|
I think the most important is to find out why are there so many events and if they keep on being generated in large amounts. Your setup is to store events for 90 days, all events prior to those 90 days should be cleared within a month if I am not mistaken. But I don’t guarantee that there are not millions more in the last 90 days
|
|
That's a good point, I just checked how many events there are in the last 90 days, 163 million!
How do we work out what is generating this activity?
|
|
Here are the events grouped by day, something is very busy in there:
|
|
Hi all,
I've just run the query above again and confirm the events are slowly being cleared:
So I think that housekeeping is working as expected.
I'm thinking about disabling the housekeeper in Zabbix and then running a cron job to run it every 1 min to speed up the clear out, could I have your thoughts on this approach please? This would start the housekeeper every minute after it last completed.
Lastly then, how could I work out what is creating the massive amount of events where seeing?
There is a point at which they start looking at the results above, so I guess something changed either in config or perhaps Zabbix build as we have been upgrading continually:
Looking at the type of events, the source is internal for a massive majority (99.7%):
And for those where the source is internal, the object type is mostly 4 (item, 85%) and 0 (trigger, 15%):
Triggers make sense I guess, but how do I work out the cause of the items events?
|
|
Do you have any warnings in the log ? How many unsupported items do you have ?
|
|
Yes this sort of thing:
But nowhere near millions per day.
|
|
Hmm, we do have 2,560 items not supported and I see we refresh unsupported after every 1min.
1,440 x 2,560 = 3,686,400
That could be it?
I've change the refresh interval to 15 min now.
|
|
You could check if this number grows after one minute ? you could also group by state please ?
And in the end please set Internal data storage period to one day
|
|
Here's every second for the last half hour:
I don't see a state column?
The housekeeper is now running every minute via a cron job and this is helping a lot, were up to July 2018 already:
|
|
Hi all,
Is there anything we can do to push this ahead as it's almost a year in the making?
With v4.4 now released I was hoping this would be part of that release so we're going to have to hold back on upgrading.
Thanks,
Sean
|
|
Fixed in:
- pre-4.0.14rc1 a10595f5919
- pre-4.2.8rc1 382d2b17552
- pre-4.4.1rc1 701997e66d2
- pre-5.0.0alpha1 (master) a583bd96d85
|
|
Thanks for all the updates, this may be obvious but when is this change likely to go GA in v4.2 or v4.4?
|
|
It is already merged in mentioned versions and will be available in next release, this shouldn't be too long.
|
|
Brilliant, thanks.
|
Generated at Fri May 29 19:55:18 EEST 2026 using Jira 10.3.18#10030018-sha1:5642e4ad348b6c2a83ebdba689d04763a2393cab.
