[ZBX-15406] Switch interface traffic graph is abnormal. Created: 2019 Jan 04 Updated: 2019 Jan 15 Resolved: 2019 Jan 09 |
|
| Status: | Closed |
| Project: | ZABBIX BUGS AND ISSUES |
| Component/s: | None |
| Affects Version/s: | None |
| Fix Version/s: | None |
| Type: | Problem report | Priority: | Major |
| Reporter: | Claude | Assignee: | Zabbix Support Team |
| Resolution: | Cannot Reproduce | Votes: | 0 |
| Labels: | graphs | ||
| Remaining Estimate: | Not Specified | ||
| Time Spent: | Not Specified | ||
| Original Estimate: | Not Specified | ||
| Environment: |
centos 7.0, zabbix 3.4.14 |
||
| Attachments: |
|
| Description |
|
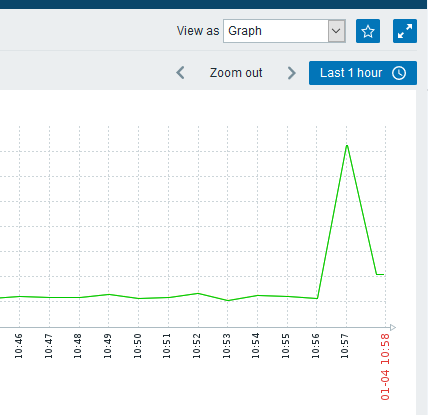
The zabbix monitors the interface traffic of the switch. In the interface graph, there are two input peaks of more than 6Gbps, and the same traffic can be found from another interface. However, this 6Gbps is incorrect. On the switch interface, the actual traffic peak is 1.4Gbps, and this is a 10GE interface. The interface of the downlink switch also has the same abnormal traffic peak. And the daily traffic never exceeds 1Gbps. Use snmpv2c. I wanna the graph to be correct. But I don't know what to do. Please help.
|
| Comments |
| Comment by Edgars Melveris [ 2019 Jan 04 ] |
|
Hello Claude! Can you please show us the configuration page for these items (also please include the preprocessing steps). Also, can you select a smaller period in the latest data, which includes the spikes and switch to "Show values" and show us the actual values for these items |
| Comment by Claude [ 2019 Jan 04 ] |
|
Hello Edgars: I attached pictures. Please take a look. Any questions let me know. |
| Comment by Edgars Melveris [ 2019 Jan 04 ] |
|
When you look at the graph of latest data, please select "Values" at the "View as" menu. And then also add them here
|
| Comment by Claude [ 2019 Jan 07 ] |
|
I found and put screenshot named "show values" here. Thanks. |
| Comment by Edgars Melveris [ 2019 Jan 07 ] |
|
Well the graphs are showing correct data, you actually have data in the DB, that differs so much. |
| Comment by Claude [ 2019 Jan 08 ] |
|
Thank you for your help. But it happened on our two devices which connect directly. See attachment topologic. The traffic goes down. The five 10GE interfaces marked red got abnormal. GE interface was normal. Also eth-trunk interfaces got abnormal. This is the only time abnormal. And traffic never exceeds 1G, except this time. Untill now our zabbix runs only 2 months. |
| Comment by Edgars Melveris [ 2019 Jan 08 ] |
|
We can't be sure how the statistics are calculated on the device itself and how that differs from the values returned by snmp. My guess would be, that the device calculates some average for a time period, so even if that period is small, the numbers will differ, as in this case Zabbix saves an absolute change. So far, nothing indicates a bug on Zabbix side.
I would believe that this also indicates, that there was a traffic spike between those devices. |
| Comment by Claude [ 2019 Jan 09 ] |
|
I'm going to do some tests and get more info. Also study more about SNMP. |
| Comment by Edgars Melveris [ 2019 Jan 09 ] |
|
Thanks for the update. |
| Comment by Claude [ 2019 Jan 15 ] |
|
I found the answer. |
| Comment by Edgars Melveris [ 2019 Jan 15 ] |
|
Hi, thanks for the feedback, glad you've found the answer. |