|
Duplicate |
|||
|
Sub-task |

[ZBX-15433] The log updated from disabled host is skipping after enable the host Created: 2019 Jan 10 Updated: 2024 Apr 10 |
|
| Status: | Need info |
| Project: | ZABBIX BUGS AND ISSUES |
| Component/s: | Agent (G) |
| Affects Version/s: | 3.0.24, 4.0.3 |
| Fix Version/s: | None |
| Type: | Problem report | Priority: | Trivial |
| Reporter: | Syusei YIn | Assignee: | Zabbix Development Team |
| Resolution: | Unresolved | Votes: | 1 |
| Labels: | None | ||
| Remaining Estimate: | Not Specified | ||
| Time Spent: | Not Specified | ||
| Original Estimate: | Not Specified | ||
| Attachments: |
|
||||||||
| Issue Links: |
|
||||||||
| Team: | |
||||||||
| Story Points: | 1 | ||||||||
| Description |
|
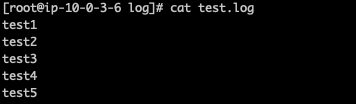
Steps to reproduce:
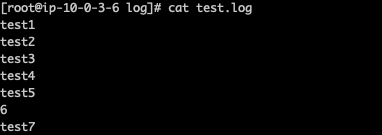
2. Enable host and update logfile(6 and test7 was updated value).
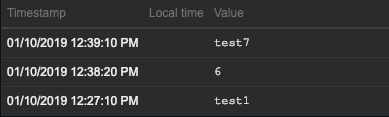
3. Latest data only shows the value updated after enabling host,
The same working on version 4.0.3 Best Regards, |
| Comments |
| Comment by Edgar Akhmetshin [ 2019 Jan 10 ] |
|
Hello Syusei, How did you turn off host monitoring? How is your log item configured? Was the log file created after monitoring off or before? Regards, |
| Comment by Andris Mednis [ 2019 Jan 21 ] |
|
Scenario 1. Host always enabled. Log item "enabled-disabled-enabled". For simplicity server config cache is updated quite often (e.g. once in 10 s), agent RefreshActiveChecks=300 (5 minutes). Initially agent gets list of active checks Agent requests and gets list of active checks, e.g.:
32718:20190121:115828.723 sending [{"request":"active checks","host":"Zabbix server","port":10070}]
32718:20190121:115828.726 got [{"response":"success","data":[{"key":"log[/home/zabbix30/ZBX-15433/test.log]","delay":30,"lastlogsize":191,"mtime":0}]}]
...
 32718:20190121:115933.776 JSON before sending [{"request":"agent data","data":[
          {"host":"Zabbix server","key":"log[/home/zabbix30/ZBX-15433/test.log]","value":"2 line","lastlogsize":14,"clock":1548064768,"ns":769621387},
...
	  {"host":"Zabbix server","key":"log[/home/zabbix30/ZBX-15433/test.log]","value":"18 line","lastlogsize":135,"clock":1548064768,"ns":770866183}],"clock":1548064773,"ns":776292871}]
 32718:20190121:115933.778 JSON back [{"response":"success","info":"processed: 17; failed: 0; total: 17; seconds spent: 0.001217"}]
 32718:20190121:115933.778 In check_response() response:'{"response":"success","info":"processed: 17; failed: 0; total: 17; seconds spent: 0.001217"}'
 32718:20190121:115933.778 info from server: 'processed: 17; failed: 0; total: 17; seconds spent: 0.001217'
 32718:20190121:115933.778 End of check_response():SUCCEED
When the item is disabled the agent does not yet know about it and continues checking and sending metrics: 32718:20190121:120058.842 JSON before sending [{"request":"agent data","data":[
{"host":"Zabbix server","key":"log[/home/zabbix30/ZBX-15433/test.log]","value":"79 line","lastlogsize":623,"clock":1548064858,"ns":833393258}],"clock":1548064858,"ns":842076608}]
32718:20190121:120058.843 JSON back [{"response":"success","info":"processed: 0; failed: 1; total: 1; seconds spent: 0.000934"}]
32718:20190121:120058.843 In check_response() response:'{"response":"success","info":"processed: 0; failed: 1; total: 1; seconds spent: 0.000934"}' <---- failed: 1
32718:20190121:120058.843 info from server: 'processed: 0; failed: 1; total: 1; seconds spent: 0.000934'
32718:20190121:120058.843 End of check_response():SUCCEED
32718:20190121:120058.844 OK
32718:20190121:120058.844 End of send_buffer():SUCCEED
As one can see, server still responds "response":"success",, but in "info" field there is "processed: 0; failed: 1;" - the metric were ignored by server because of status "disabled". If item is disabled longer than RefreshActiveChecks value on agent, then agent requests new active check list: 32718:20190121:120328.994 sending [{"request":"active checks","host":"Zabbix server","port":10070}]
32718:20190121:120329.001 got [{"response":"success","data":[]}]
Now agent sees that the metric should not be checked and erases it from the list (although there is an exception for log[] items in NOTSUPPORTED state with "skip" parameter set to 0). Once it is enabled again on server and agent requests the list of active checks, it gets 32718:20190121:120828.105 sending [{"request":"active checks","host":"Zabbix server","port":10070}]
32718:20190121:120828.112 got [{"response":"success","data":[{"key":"log[/home/zabbix30/ZBX-15433/test.log]","delay":30,"lastlogsize":615,"mtime":0}]}]
32718:20190121:120828.112 In add_check() key:'log[/home/zabbix30/ZBX-15433/test.log]' refresh:30 lastlogsize:615 mtime:0
32718:20190121:120828.112 End of add_check()
And here is a "miracle": although agent analyzed a lot of log records while the item was disabled, and all those records were sent to server and ignored there, now the agent gets proper 'lastlogsize' - just where the item was disabled. Monitoring of log file continues, without loosing any record as if the item was never disabled ! Well, the log file is analyzed again from the proper 'laslogsize', all matching records are resent again to server and now are accepted. |
| Comment by Andris Mednis [ 2019 Jan 21 ] |
|
Scenario 2. Same as Scenario 1, except item disabled shorter than RefreshActiveChecks. Initially all goes well, as in scenario 1. When item is disabled, agent continues sending log lines, but server ignores them - like in scenario 1: 5170:20190121:153555.769 JSON before sending [{"request":"agent data","data":[
{"host":"Zabbix server","key":"log[/home/zabbix30/ZBX-15433/test.log]","value":"20 line","lastlogsize":151,"clock":1548077755,"ns":763793397}],"clock":1548077755,"ns":769094877}]
5170:20190121:153555.770 JSON back [{"response":"success","info":"processed: 0; failed: 1; total: 1; seconds spent: 0.000543"}]
5170:20190121:153555.770 In check_response() response:'{"response":"success","info":"processed: 0; failed: 1; total: 1; seconds spent: 0.000543"}'
5170:20190121:153555.770 info from server: 'processed: 0; failed: 1; total: 1; seconds spent: 0.000543'
5170:20190121:153555.770 End of check_response():SUCCEED
5170:20190121:153555.770 OK
Item is enabled. Server starts to accept log lines again, agent sends: 5170:20190121:153655.825 JSON before sending [{"request":"agent data","data":[
{"host":"Zabbix server","key":"log[/home/zabbix30/ZBX-15433/test.log]","value":"80 line","lastlogsize":631,"clock":1548077815,"ns":817127834}],"clock":1548077815,"ns":825697853}]
5170:20190121:153655.826 JSON back [{"response":"success","info":"processed: 1; failed: 0; total: 1; seconds spent: 0.000608"}]
5170:20190121:153655.826 In check_response() response:'{"response":"success","info":"processed: 1; failed: 0; total: 1; seconds spent: 0.000608"}'
5170:20190121:153655.826 info from server: 'processed: 1; failed: 0; total: 1; seconds spent: 0.000608'
5170:20190121:153655.827 End of check_response():SUCCEED
5170:20190121:153655.827 OK
5170:20190121:153655.827 End of send_buffer():SUCCEED
Result: part of records were lost - no records in Zabbix DB, no triggers, no alerts activated. In Scenario 1 disabling item for longer than RefreshActiveChecks was saved by "miracle" - no data was lost. |
| Comment by Andris Mednis [ 2019 Jan 21 ] |
|
Scenario 3. Item always enabled. Host "enabled-disabled-enabled". Initially agent is sending data, host is enabled: 6752:20190121:163433.292 JSON before sending [{"request":"agent data","data":[
{"host":"Zabbix server","key":"log[/home/zabbix30/ZBX-15433/test.log]","value":"1 line","lastlogsize":7,"clock":1548081272,"ns":283671519}],"clock":1548081273,"ns":292688327}]
6752:20190121:163433.294 JSON back [{"response":"success","info":"processed: 1; failed: 0; total: 1; seconds spent: 0.000952"}]
6752:20190121:163433.294 In check_response() response:'{"response":"success","info":"processed: 1; failed: 0; total: 1; seconds spent: 0.000952"}'
6752:20190121:163433.294 info from server: 'processed: 1; failed: 0; total: 1; seconds spent: 0.000952'
6752:20190121:163433.294 End of check_response():SUCCEED
6752:20190121:163433.294 OK
Then host is disabled: 6752:20190121:163532.340 JSON before sending [{"request":"agent data","data":[
{"host":"Zabbix server","key":"log[/home/zabbix30/ZBX-15433/test.log]","value":"32 line","lastlogsize":247,"clock":1548081332,"ns":336024085}],"clock":1548081332,"ns":340079006}]
6752:20190121:163532.340 JSON back [{"response":"success","info":"processed: 0; failed: 1; total: 1; seconds spent: 0.000110"}]
6752:20190121:163532.340 In check_response() response:'{"response":"success","info":"processed: 0; failed: 1; total: 1; seconds spent: 0.000110"}'
6752:20190121:163532.340 info from server: 'processed: 0; failed: 1; total: 1; seconds spent: 0.000110'
6752:20190121:163532.340 End of check_response():SUCCEED
6752:20190121:163532.340 OK
Server response says "processed: 0; failed: 1" - but overall - "response":"success". 6752:20190121:163902.555 sending [{"request":"active checks","host":"Zabbix server","port":10070}]
6752:20190121:163902.557 got [{"response":"failed","info":"host [Zabbix server] not monitored"}]
6752:20190121:163902.557 In parse_list_of_checks()
6752:20190121:163902.557 no active checks on server [192.168.6.68:10091]: host [Zabbix server] not monitored
6752:20190121:163902.557 End of parse_list_of_checks():FAIL
6752:20190121:163902.558 End of refresh_active_checks():SUCCEED
Here agent had a chance to find out that host is not monitored, but no. Agent analyzes only "response":"failed" and continues with the old list of checks: 6752:20190121:163902.561 JSON before sending [{"request":"agent data","data":[
{"host":"Zabbix server","key":"log[/home/zabbix30/ZBX-15433/test.log]","value":"243 line","lastlogsize":2079,"clock":1548081542,"ns":558281543}],"clock":1548081542,"ns":561898491}]
6752:20190121:163902.562 JSON back [{"response":"success","info":"processed: 0; failed: 1; total: 1; seconds spent: 0.000075"}]
6752:20190121:163902.562 In check_response() response:'{"response":"success","info":"processed: 0; failed: 1; total: 1; seconds spent: 0.000075"}'
6752:20190121:163902.562 info from server: 'processed: 0; failed: 1; total: 1; seconds spent: 0.000075'
6752:20190121:163902.562 End of check_response():SUCCEED
6752:20190121:163902.562 OK
Then host is enabled, log lines start to be accepted: 6752:20190121:164102.682 JSON before sending [{"request":"agent data","data":[
{"host":"Zabbix server","key":"log[/home/zabbix30/ZBX-15433/test.log]","value":"363 line","lastlogsize":3159,"clock":1548081662,"ns":675796158}],"clock":1548081662,"ns":682734422}]
6752:20190121:164102.683 JSON back [{"response":"success","info":"processed: 1; failed: 0; total: 1; seconds spent: 0.000161"}]
6752:20190121:164102.683 In check_response() response:'{"response":"success","info":"processed: 1; failed: 0; total: 1; seconds spent: 0.000161"}'
6752:20190121:164102.683 info from server: 'processed: 1; failed: 0; total: 1; seconds spent: 0.000161'
6752:20190121:164102.683 End of check_response():SUCCEED
6752:20190121:164102.683 OK
Again - new list of active checks: 6752:20190121:164402.877 sending [{"request":"active checks","host":"Zabbix server","port":10070}]
6752:20190121:164402.877 before read
6752:20190121:164402.881 got [{"response":"success","data":[{"key":"log[/home/zabbix30/ZBX-15433/test.log]","delay":30,"lastlogsize":4770,"mtime":0}]}]
6752:20190121:164402.881 In parse_list_of_checks()
6752:20190121:164402.881 In add_check() key:'log[/home/zabbix30/ZBX-15433/test.log]' refresh:30 lastlogsize:4770 mtime:0
6752:20190121:164402.881 End of add_check()
Part of records were lost while host was disabled - just as reported in this ZBX. |
| Comment by Andris Mednis [ 2019 Jan 21 ] |
|
Scenarios described above show that agent should be informed by server that an item or host is disabled and stop checking the item immediately, without waiting until update of list of active checks. It would be better to suspend the check instead of deleting it because for log[], logrt[] items agent has some information (e.g. inodes, md5 sums of initial block of previously analyzed files) which is not yet stored on server between agent restarts. Keeping this information reduces possibility of false positives when item or host is enabled again. |
| Comment by Andris Mednis [ 2019 Jan 22 ] |
|
While we think how to prevent skipping log records we can also ask - are there users who might prefer skipping log records when they disable host or log/logrt item ? It could depend on how long a host/item is disabled. I guess - if a host is disabled 10 min, user might want to not lose any log record. If a host is disabled 1 day, - user might prefer skipping records. If there are then a more configurable "skip" option is needed. |
| Comment by Andris Mednis [ 2019 Jan 22 ] |
|
What can be done to prevent skipping log records? Case 1. Host is disabled. {"response":"success","info":"processed: 0; failed: 29; total: 29; seconds spent: 0.001519"}
Agent can be modified to recognize from this reply that nothing is "processed", all metrics "failed". Agend could suspend all active checks until it gets a new list of active checks (it won't happen until host is enabled again). Strictly speaking, a disabled host is not the only reason which can produce such reply. For example, "certificate issuer does not match" also can produce a similar reply (nothing "processed", all "failed"). Nevertheless, the same action on agent side (suspending active checks until getting a new list of checks) would be valid. Case 2. Some items are disabled while others are enabled. {"response":"success","info":"processed: 2; failed: 3; total: 5; seconds spent: 0.001802"}
and is not able to tell which metric to suspend, which one to continue checking. I think this can be fully solved only by modifying server to provide detailed response and agent to understand it - in fact, a protocol has to be enhanced, with keeping backward compatibility. |
| Comment by Andris Mednis [ 2019 Jan 22 ] |
|
Proposed solutions: 1. Basic solution. To prevent skipping of log records if host is disabled - modify agent to suspend active checks if server replies with "processed: 0; failed: N; total: N;". Resume checks according to a new list when it is received. This should solve the current issue. |
| Comment by Alexander Vladishev [ 2019 Jan 22 ] |
|
Similar issue: ZBXNEXT-38 |