|
I'd suggest briefly describing the latest known facts in here.
|
|
Hello Carl!
Can you add the output of these commands?
ps aux | grep "zabbix_server -c"
grep AlertScriptsPath /etc/zabbix/zabbix_server.conf
|
[root@mhdal05zm01 ~]# ps aux | grep "zabbix_server -c"
root 22635 0.0 0.0 112708 980 pts/0 S+ 08:31 0:00 grep --color=auto zabbix_server -c
root 28391 0.0 0.0 4861972 8636 ? S Jan25 0:00 /usr/sbin/zabbix_server -c /etc/zabbix/zabbix_server.conf
[root@mhdal05zm01 ~]# grep AlertScriptsPath /etc/zabbix/zabbix_server.conf
### Option: AlertScriptsPath
# AlertScriptsPath=$\{datadir}/zabbix/alertscripts
AlertScriptsPath=/usr/local/bin/
[root@mhdal05zm01 ~]#
|
|
Hello Carl,
first of all, let's concentrate on one problem at a time - about why the AlertScriptsPath parameter seems to be ignored - I have no idea, but it works here. I would suggest that this is misconfiguration.
About the alerts not being sent - I was not able to reproduce the issue, seems to work here.
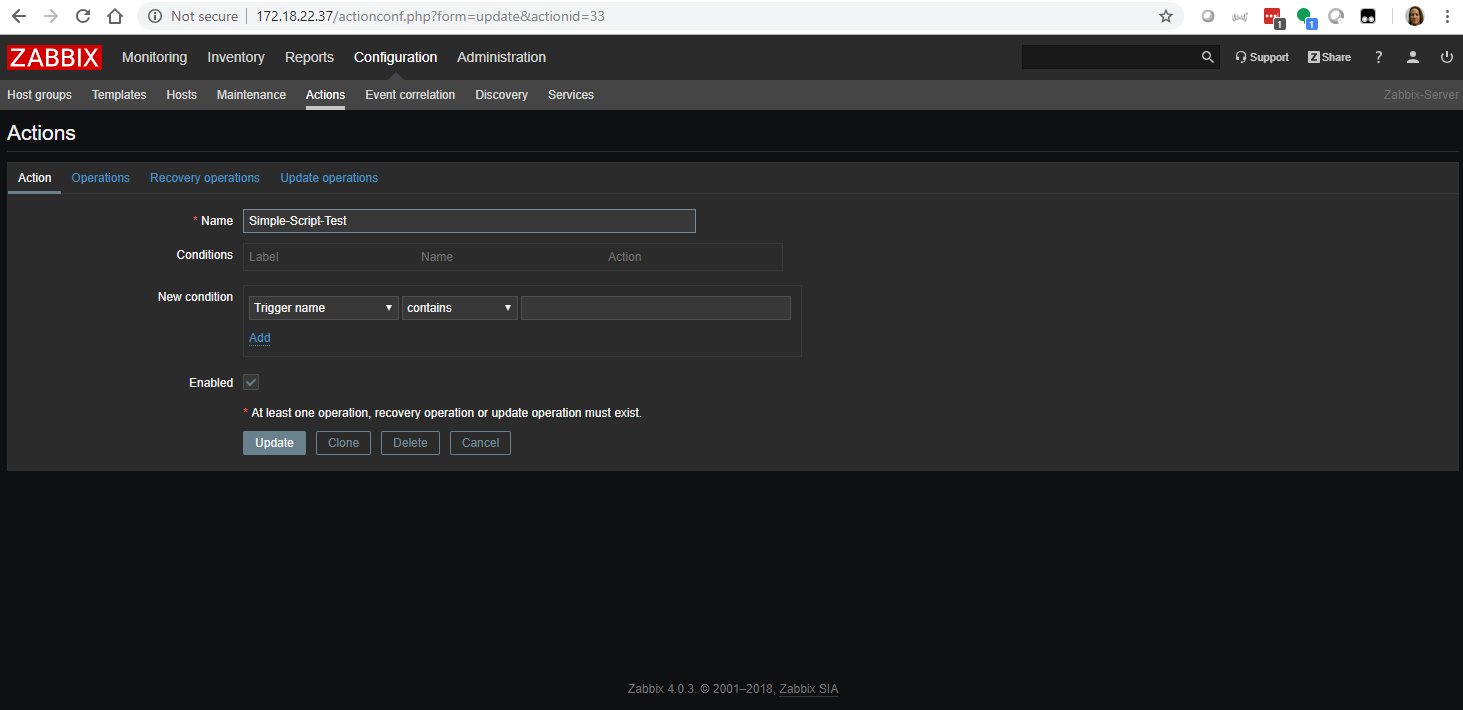
To make sure that I'm doing things the same way, can you please add screenshots from how you've configured the media type, media for the user, settings from the action that executes this script?
|
|
Thank you for the update Edgars. I will get those screenshots for you today. Additionally, I will see if I can setup a test instance of zabbix you can access and see if I can replicate the issue there.
Updates to follow.
Carl
|
|
I have attached the screenshots as requested. Additionally, I have pulled the DB records so you can see how they are configured.
Media Type
*************************** 5. row ***************************
mediatypeid: 7
type: 1
description: Simple Script Test
smtp_server:
smtp_helo:
smtp_email:
exec_path: simple-script-test
gsm_modem:
username:
passwd:
status: 0
smtp_port: 25
smtp_security: 0
smtp_verify_peer: 0
smtp_verify_host: 0
smtp_authentication: 0
exec_params: '{ALERT.SENDTO}'
'{ALERT.SUBJECT}'
'{ALERT.MESSAGE}'

maxsessions: 1
maxattempts: 3
attempt_interval: 3s

Media for user
*************************** 39. row ***************************
mediaid: 74
userid: 56
mediatypeid: 7
sendto: @carlslaughter
active: 0
severity: 63
period: 1-7,00:00-24:00
39 rows in set (0.00 sec)

[localhost zabbix40]>select * from actions where actionid=33\G
*************************** 1. row ***************************
actionid: 33
name: Simple-Script-Test
eventsource: 0
evaltype: 0
status: 0
esc_period: 1m
def_shortdata: SST Problem: {EVENT.NAME} {EVENT.ID} {ALERT.ID}
def_longdata: Problem started at {EVENT.TIME} on {EVENT.DATE}
r_shortdata: Resolved: {EVENT.NAME}
r_longdata: Problem has been resolved at {EVENT.RECOVERY.TIME} on {EVENT.RECOVERY.DATE}
Problem name: {EVENT.NAME}
Host: {HOST.NAME}
Severity: {TRIGGER.SEVERITY}

Original problem ID: {EVENT.ID}
{TRIGGER.URL}
formula:
pause_suppressed: 1
ack_shortdata: Acknowledged: {EVENT.NAME}
ack_longdata: {USER.FULLNAME} acknowledged problem at {ACK.DATE} {ACK.TIME} with the following message:
{ACK.MESSAGE}

Current problem status is {EVENT.STATUS}
1 row in set (0.00 sec)


[localhost zabbix40]>select * from opmessage where operationid=84\G
*************************** 1. row ***************************
operationid: 84
default_msg: 1
subject: - Slack bot Media Type - Problem: {EVENT.NAME}
message: Problem started at {EVENT.TIME} on {EVENT.DATE}
Problem name: {EVENT.NAME}
Host: {HOST.NAME}
Severity: {EVENT.SEVERITY}

Original problem ID: {EVENT.ID}
{TRIGGER.URL}
mediatypeid: 7
1 row in set (0.00 sec)
Carl
|
|
|
|
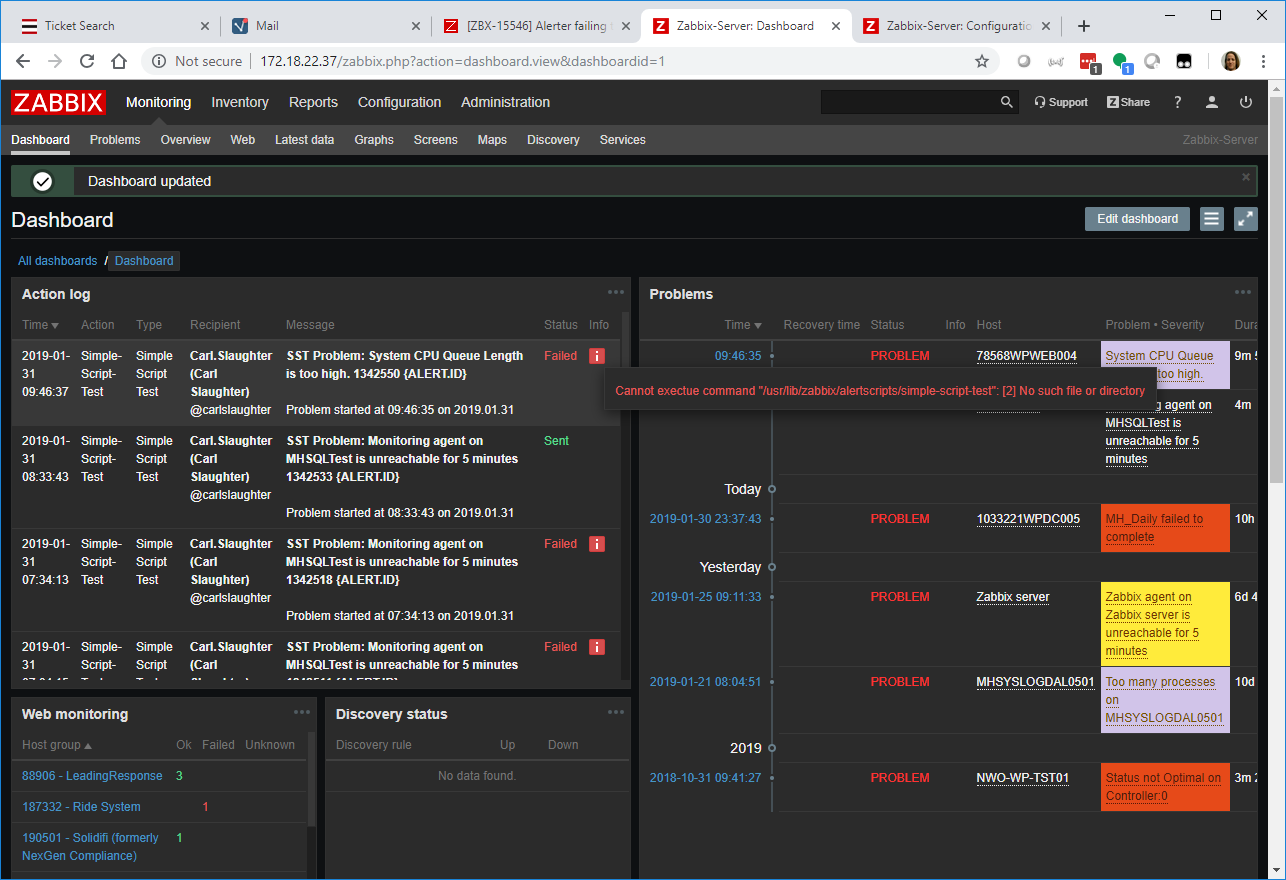
From the last screenshot, you can see that sometimes it works and other times it doesn't. I have been searching for anything that correlates to when it is working or when it's not, but cant seem to identify the external factor (it there is any).
Carl
|
|
There must be some other factor, as I am unable to reproduce the problem.
I created a setup exactly like yours, I have a one liner sending data to trapper item and trigger alarms all the time, not a single fail from 60 alerts.
I'm not yet sure what I'm looking for, but can you please provide the output of these commands?
select mediatypeid, type, description  from media_type;
 select  alertid, actionid, eventid, mediatypeid, error from alerts;
If the last one is too big, you can limit it to reasonable amount.
|
|
Hello Carl,
Please show the content of directory:
ls -l /usr/lib/zabbix/alertscripts
What is the status of SELinux
Screen  do not have conditions. Please create at least one condition and see does the action performs any better. do not have conditions. Please create at least one condition and see does the action performs any better.
Regards,
|
|
Edgars, Here is the output from the requested query.
[localhost zabbix40]>select mediatypeid, type, description from media_type;
 -----------------------------------

mediatypeid type description
-----------------------------------

1 0 Email   4 1 Slack 2   5 1 slack bot   6 1 Slack Web hook   7 1 Simple Script Test   8 2 SMS   9 3 Jabber
-----------------------------------
 7 rows in set (0.00 sec)
[localhost zabbix40]>
|
|
Aigars, Here is the requested directory listing
[root@mhdal05zm01 ~]# ls -l /usr/lib/zabbix/alertscripts
lrwxrwxrwx 1 zabbix zabbix 14 Jan 23 10:21 /usr/lib/zabbix/alertscripts -> /usr/local/bin
[root@mhdal05zm01 ~]# ls -l /usr/local/bin
total 52
-rw-r----- 1 zabbix zabbix 1973 Nov 13 11:21 alertscripts.tgz
-rwxr-x---+ 1 root root 5411 Jan 31 10:52 api-functions.sh
-rwxr-xr-x 1 zabbix zabbix 3704 Oct 19 09:14 create_ticket.sh
-rwxrwxr-x 1 zabbix zabbix 815 Jan 22 08:34 echo-to-log
-rwxr-xr-x 1 zabbix zabbix 659 Oct 5 15:13 nalarm
-rwxr-x--- 1 zabbix zabbix 7574 Jan 23 09:26 odbc_config.py
-rwxr-x--- 1 zabbix zabbix 156 Jan 25 08:37 simple-script-test
-rwxr-x--- 1 zabbix zabbix 1707 Jan 23 11:58 slack-alert.sh
-rwxr-x--- 1 zabbix zabbix 327 Nov 20 13:42 zabbixdb
-rwxr-x--- 1 zabbix zabbix 5206 Jan 22 09:18 zbx-notify
[root@mhdal05zm01 ~]#
Now keep in mind that my zabbix_server.conf has my alertscripts directory set to /usr/local/bin.
[root@mhdal05zm01 ~]# grep AlertScriptsPath /etc/zabbix/zabbix_server.conf
### Option: AlertScriptsPath
# AlertScriptsPath=$\{datadir}/zabbix/alertscripts
AlertScriptsPath=/usr/local/bin/
[root@mhdal05zm01 ~]#
Selinux is disabled as this had been an issue in the past.
[root@mhdal05zm01 ~]# getenforce
Disabled
[root@mhdal05zm01 ~]#
|
|
I can say that when looking at the logs, (I had disabled all my hosts and reduced all the pollers to 1 or 0 if possible.) that it looked like the poller would receive the value, process the trigger, and add an entry to the alert table. I would then se in the log that the alerter ran a select statement and would get 1 result back. On a failure, it would get no results back.
This is what originally got me to looking in the database to see if for some reason the record was not getting saved or passably mutilated in some way this causing the alerter's query to return 0 results.
Looking at the pollers insert statement, it always looked to be inserted as a status 0, but because the zabbix server process can't be started with "StartAlerters=0", I could never manually run a select statement on the alerts table fast enough to see if the new record was actually saved as status=0 and nothing in the error column or not. This is when I started manually resetting the records that failed back to status=0 and clearing out the error column to see if they fail again or not. I noticed that after manually updating the records, that the alerter process did not automatically pick them back up. I had assumed that it would based on the queries I was seeing in the logs earlier, but that was not the case. I had to restart the zabbix server process to get them picked up and processed. Once restarted, all the records were picked up and processed successfully. However any new alarms might or might not successfully process.
|
|
Did you add the result for this query? I can't find it.
select alertid, actionid, eventid, mediatypeid, error from alerts;
|
|
If I understand correctly, the nextcheck values for all the active (enabled) items (that are getting polled) is stored in memory and not in the DB. If this is correct, is it possible that the alerts are also stored in memory (message queue) and are picked up by the alerter process from there? "Alert Manager" process maybe?
Carl
|
|
It has several thousand rows. So I took the last portion and posted it. If you need the entire amount, I will have to output it to a file and attach it.
|
|
FYI, there is a typo on your error message
Cannot exectue command
Should be
Cannot execute command
|
|
Hello Carl,
It does not make very much sense if you configured in config 'AlertScriptsPath=/usr/local/bin/' but the message states a different path.
Please see if the zabbix_server are really using '/etc/zabbix/zabbix_server.conf'
ps aux|grep zabbix_server.conf
Please try to shut down the server daemon. Make sure all processes are gone. Then start again so the daemon picks up the latest conf.
Do you have any 'Include=' active in the config?
|
|
I agree, it makes no sense. I have checked several times and verified that the server IS using that config file.
I have stopped the service. confirmed it is not running, and restarted it, checked the log file and confirmed there that it did in fact pull that config file.
I have even rebooted and tried again. In every case it is showing to be using that config file.
I have verified that the server IS using that config file by modifying it and setting a value to an invalid setting to see if the server errors out on startup. (It did)
[root@mhdal05zm01 ~]# ps -eaf | grep zabbix_server
root 28391 1 0 Jan25 ? 00:00:00 /usr/sbin/zabbix_server -c /etc/zabbix/zabbix_server.conf
|
|
[root@mhdal05zm01 ~]# ps aux | grep zabbix_server
root 907 0.0 0.0 115300 1464 ? S 10:37 0:00 sh -c /usr/sbin/fping -C3 2>&1 </tmp/zabbix_server_28587.pinger;/usr/sbin/fping6 -C3 2>&1 </tmp/zabbix_server_28587.pinger;
root 912 0.0 0.0 112708 984 pts/0 S+ 10:37 0:00 grep --color=auto zabbix_server
root 28391 0.0 0.0 4861972 8636 ? S Jan25 0:00 /usr/sbin/zabbix_server -c /etc/zabbix/zabbix_server.conf
root 28396 0.0 0.0 4865844 11444 ? S Jan25 8:05 /usr/sbin/zabbix_server: configuration syncer [synced configuration in 0.148067 sec, idle 60 sec]
root 28397 0.0 0.0 4865340 3572 ? S Jan25 0:31 /usr/sbin/zabbix_server: ipmi manager #1 [scheduled 0, polled 0 values, idle 5.005415 sec during 5.005486 sec]
root 28398 0.0 0.0 4861972 2948 ? S Jan25 0:00 /usr/sbin/zabbix_server: alerter #1 [sent 0, failed 0 alerts, idle 240.328257 sec during 240.339549 sec]
root 28399 0.0 0.0 4863656 4912 ? S Jan25 0:53 /usr/sbin/zabbix_server: housekeeper [deleted 53177 hist/trends, 0 items/triggers, 1 events, 7 sessions, 0 alarms, 122 audit items in 16.132429 sec, idle for 1 hour(s)]
root 28400 0.0 0.0 4861972 3280 ? S Jan25 0:27 /usr/sbin/zabbix_server: timer #1 [updated 0 hosts, suppressed 0 events in 0.000589 sec, idle 59 sec]
root 28401 0.0 0.0 4861972 3456 ? S Jan25 0:27 /usr/sbin/zabbix_server: timer #2 [suppressed 0 events in 0.001585 sec, idle 59 sec]
root 28402 0.0 0.0 4861972 3408 ? S Jan25 0:25 /usr/sbin/zabbix_server: timer #3 [suppressed 0 events in 0.001067 sec, idle 59 sec]
root 28403 0.0 0.0 4861972 3404 ? S Jan25 0:27 /usr/sbin/zabbix_server: timer #4 [suppressed 0 events in 0.001483 sec, idle 59 sec]
root 28404 0.0 0.0 4861972 3468 ? S Jan25 0:27 /usr/sbin/zabbix_server: timer #5 [suppressed 0 events in 0.001136 sec, idle 59 sec]
root 28405 0.0 0.0 4861972 3400 ? S Jan25 0:25 /usr/sbin/zabbix_server: timer #6 [suppressed 0 events in 0.001672 sec, idle 59 sec]
root 28406 0.0 0.0 4861972 3460 ? S Jan25 0:25 /usr/sbin/zabbix_server: timer #7 [suppressed 0 events in 0.001096 sec, idle 59 sec]
root 28407 0.0 0.0 4861972 3404 ? S Jan25 0:26 /usr/sbin/zabbix_server: timer #8 [suppressed 0 events in 0.001314 sec, idle 59 sec]
root 28408 0.0 0.0 4861972 3448 ? S Jan25 0:26 /usr/sbin/zabbix_server: timer #9 [suppressed 0 events in 0.001157 sec, idle 59 sec]
root 28409 0.0 0.0 4861972 3452 ? S Jan25 0:25 /usr/sbin/zabbix_server: timer #10 [suppressed 0 events in 0.001411 sec, idle 59 sec]
root 28410 0.0 0.0 4963744 8376 ? S Jan25 1:22 /usr/sbin/zabbix_server: http poller #1 [got 0 values in 0.000808 sec, idle 5 sec]
root 28411 0.0 0.0 4963544 8272 ? S Jan25 1:43 /usr/sbin/zabbix_server: http poller #2 [got 0 values in 0.000729 sec, idle 5 sec]
root 28412 0.0 0.0 4963520 8184 ? S Jan25 1:05 /usr/sbin/zabbix_server: http poller #3 [got 0 values in 0.000782 sec, idle 5 sec]
root 28413 0.0 0.0 4963496 8164 ? S Jan25 1:00 /usr/sbin/zabbix_server: http poller #4 [got 0 values in 0.001532 sec, idle 5 sec]
root 28414 0.0 0.0 4964124 8508 ? S Jan25 1:32 /usr/sbin/zabbix_server: http poller #5 [got 0 values in 0.000777 sec, idle 5 sec]
root 28415 0.0 0.0 4966348 5460 ? S Jan25 0:14 /usr/sbin/zabbix_server: discoverer #1 [processed 0 rules in 0.000618 sec, idle 60 sec]
root 28416 0.0 0.0 4966348 5456 ? S Jan25 0:14 /usr/sbin/zabbix_server: discoverer #2 [processed 0 rules in 0.000692 sec, idle 60 sec]
root 28417 0.0 0.0 4966348 5456 ? S Jan25 0:14 /usr/sbin/zabbix_server: discoverer #3 [processed 0 rules in 0.000718 sec, idle 60 sec]
root 28418 0.0 0.0 4966348 5456 ? S Jan25 0:14 /usr/sbin/zabbix_server: discoverer #4 [processed 0 rules in 0.001397 sec, idle 60 sec]
root 28419 0.0 0.0 4966348 5456 ? S Jan25 0:14 /usr/sbin/zabbix_server: discoverer #5 [processed 0 rules in 0.000744 sec, idle 60 sec]
root 28420 0.0 0.0 4865020 10376 ? S Jan25 2:20 /usr/sbin/zabbix_server: history syncer #1 [processed 0 values, 1 triggers in 0.000270 sec, idle 1 sec]
root 28421 0.0 0.0 4864860 10280 ? S Jan25 2:19 /usr/sbin/zabbix_server: history syncer #2 [processed 0 values, 0 triggers in 0.000032 sec, idle 1 sec]
root 28422 0.0 0.0 4865032 10424 ? S Jan25 2:20 /usr/sbin/zabbix_server: history syncer #3 [processed 0 values, 0 triggers in 0.000025 sec, idle 1 sec]
root 28423 0.0 0.0 4864456 9736 ? S Jan25 2:20 /usr/sbin/zabbix_server: history syncer #4 [processed 0 values, 0 triggers in 0.000025 sec, idle 1 sec]
root 28424 0.0 0.0 4864484 10000 ? S Jan25 2:22 /usr/sbin/zabbix_server: history syncer #5 [processed 22 values, 6 triggers in 0.006187 sec, idle 1 sec]
root 28425 0.0 0.0 4864852 10380 ? S Jan25 2:21 /usr/sbin/zabbix_server: history syncer #6 [processed 0 values, 0 triggers in 0.000025 sec, idle 1 sec]
root 28427 0.0 0.0 4864872 10252 ? S Jan25 2:21 /usr/sbin/zabbix_server: history syncer #7 [processed 14 values, 6 triggers in 0.005061 sec, idle 1 sec]
root 28429 0.0 0.0 4864296 9672 ? S Jan25 2:20 /usr/sbin/zabbix_server: history syncer #8 [processed 0 values, 0 triggers in 0.000011 sec, idle 1 sec]
root 28431 0.0 0.0 4864860 10324 ? S Jan25 2:22 /usr/sbin/zabbix_server: history syncer #9 [processed 0 values, 0 triggers in 0.000020 sec, idle 1 sec]
root 28433 0.0 0.0 4864404 9744 ? S Jan25 2:22 /usr/sbin/zabbix_server: history syncer #10 [processed 0 values, 0 triggers in 0.000021 sec, idle 1 sec]
root 28435 0.0 0.0 4862056 4948 ? S Jan25 1:16 /usr/sbin/zabbix_server: escalator #1 [processed 0 escalations in 0.001984 sec, idle 3 sec]
root 28436 0.0 0.0 4861972 3436 ? S Jan25 0:00 /usr/sbin/zabbix_server: ipmi poller #1 [polled 0 values, idle 3599.842182 sec during 3599.842195 sec]
root 28437 0.0 0.0 4861972 3436 ? S Jan25 0:00 /usr/sbin/zabbix_server: ipmi poller #2 [polled 0 values, idle 3599.842176 sec during 3599.842190 sec]
root 28438 0.0 0.0 4861972 3140 ? S Jan25 0:36 /usr/sbin/zabbix_server: snmp trapper [processed data in 0.000042 sec, idle 1 sec]
root 28440 0.0 0.0 4861972 4032 ? S Jan25 0:17 /usr/sbin/zabbix_server: proxy poller #1 [exchanged data with 0 proxies in 0.000027 sec, idle 5 sec]
root 28441 0.0 0.0 4861972 4032 ? S Jan25 0:16 /usr/sbin/zabbix_server: proxy poller #2 [exchanged data with 0 proxies in 0.000024 sec, idle 5 sec]
root 28443 0.0 0.0 4861972 2904 ? S Jan25 0:39 /usr/sbin/zabbix_server: self-monitoring [processed data in 0.000031 sec, idle 1 sec]
root 28444 0.0 0.0 4861972 2872 ? S Jan25 0:17 /usr/sbin/zabbix_server: vmware collector #1 [updated 0, removed 0 VMware services in 0.000028 sec, idle 5 sec]
root 28445 0.0 0.0 4861972 2872 ? S Jan25 0:17 /usr/sbin/zabbix_server: vmware collector #2 [updated 0, removed 0 VMware services in 0.000027 sec, idle 5 sec]
root 28446 0.0 0.0 4861972 4292 ? S Jan25 0:23 /usr/sbin/zabbix_server: task manager [processed 0 task(s) in 0.000231 sec, idle 5 sec]
root 28449 0.0 0.0 4987216 14500 ? S Jan25 6:01 /usr/sbin/zabbix_server: poller #1 [got 0 values in 0.000025 sec, idle 1 sec]
root 28450 0.0 0.0 4987500 14644 ? S Jan25 6:00 /usr/sbin/zabbix_server: poller #2 [got 0 values in 0.000030 sec, idle 1 sec]
root 28452 0.0 0.0 4987496 14632 ? S Jan25 6:00 /usr/sbin/zabbix_server: poller #3 [got 0 values in 0.000024 sec, idle 1 sec]
root 28453 0.0 0.0 4987412 14676 ? S Jan25 6:10 /usr/sbin/zabbix_server: poller #4 [got 0 values in 0.000028 sec, idle 1 sec]
root 28454 0.0 0.0 4987412 14604 ? S Jan25 6:01 /usr/sbin/zabbix_server: poller #5 [got 0 values in 0.000036 sec, idle 1 sec]
root 28455 0.0 0.0 4987420 14604 ? S Jan25 5:59 /usr/sbin/zabbix_server: poller #6 [got 0 values in 0.000031 sec, idle 1 sec]
root 28457 0.0 0.0 4987416 14644 ? S Jan25 5:59 /usr/sbin/zabbix_server: poller #7 [got 10 values in 0.393259 sec, idle 1 sec]
root 28458 0.0 0.0 4987216 14492 ? S Jan25 6:03 /usr/sbin/zabbix_server: poller #8 [got 8 values in 1.097959 sec, idle 1 sec]
root 28459 0.0 0.0 4987424 14652 ? S Jan25 5:58 /usr/sbin/zabbix_server: poller #9 [got 1 values in 0.002673 sec, idle 1 sec]
root 28460 0.0 0.0 4987252 14508 ? S Jan25 5:57 /usr/sbin/zabbix_server: poller #10 [got 3 values in 0.067815 sec, idle 1 sec]
root 28461 0.0 0.0 4987484 14644 ? S Jan25 6:03 /usr/sbin/zabbix_server: poller #11 [got 0 values in 0.000031 sec, idle 1 sec]
root 28462 0.0 0.0 4987216 14512 ? S Jan25 6:01 /usr/sbin/zabbix_server: poller #12 [got 0 values in 0.000042 sec, idle 1 sec]
root 28463 0.0 0.0 4987428 14580 ? S Jan25 6:00 /usr/sbin/zabbix_server: poller #13 [got 1 values in 0.070767 sec, idle 1 sec]
root 28464 0.0 0.0 4987216 14492 ? S Jan25 6:02 /usr/sbin/zabbix_server: poller #14 [got 0 values in 0.000034 sec, idle 1 sec]
root 28465 0.0 0.0 4987496 14772 ? S Jan25 6:04 /usr/sbin/zabbix_server: poller #15 [got 13 values in 0.635530 sec, getting values]
root 28468 0.0 0.0 4987216 14528 ? S Jan25 6:04 /usr/sbin/zabbix_server: poller #16 [got 0 values in 0.000025 sec, idle 1 sec]
root 28469 0.0 0.0 4987428 14608 ? S Jan25 6:01 /usr/sbin/zabbix_server: poller #17 [got 0 values in 0.000025 sec, idle 1 sec]
root 28472 0.0 0.0 4987216 14512 ? S Jan25 6:07 /usr/sbin/zabbix_server: poller #18 [got 0 values in 0.000028 sec, idle 1 sec]
root 28473 0.0 0.0 4987252 14612 ? S Jan25 6:00 /usr/sbin/zabbix_server: poller #19 [got 0 values in 0.000024 sec, idle 1 sec]
root 28474 0.0 0.0 4987404 14648 ? S Jan25 6:02 /usr/sbin/zabbix_server: poller #20 [got 0 values in 0.000026 sec, idle 1 sec]
root 28475 0.0 0.0 4987252 14508 ? S Jan25 6:01 /usr/sbin/zabbix_server: poller #21 [got 0 values in 0.000025 sec, idle 1 sec]
root 28476 0.0 0.0 4987216 14512 ? S Jan25 6:02 /usr/sbin/zabbix_server: poller #22 [got 19 values in 0.930398 sec, idle 1 sec]
root 28477 0.0 0.0 4987432 14592 ? S Jan25 5:58 /usr/sbin/zabbix_server: poller #23 [got 0 values in 0.000025 sec, idle 1 sec]
root 28478 0.0 0.0 4987496 14728 ? S Jan25 6:04 /usr/sbin/zabbix_server: poller #24 [got 0 values in 0.000026 sec, idle 1 sec]
root 28479 0.0 0.0 4987252 14504 ? S Jan25 5:55 /usr/sbin/zabbix_server: poller #25 [got 0 values in 0.000025 sec, idle 1 sec]
root 28480 0.0 0.0 4970004 8628 ? S Jan25 0:39 /usr/sbin/zabbix_server: unreachable poller #1 [got 0 values in 0.000025 sec, idle 1 sec]
root 28481 0.0 0.0 4970004 8620 ? S Jan25 0:39 /usr/sbin/zabbix_server: unreachable poller #2 [got 0 values in 0.000045 sec, idle 1 sec]
root 28482 0.0 0.0 4970004 8656 ? S Jan25 0:39 /usr/sbin/zabbix_server: unreachable poller #3 [got 0 values in 0.000036 sec, idle 1 sec]
root 28483 0.0 0.0 4970004 8584 ? S Jan25 0:39 /usr/sbin/zabbix_server: unreachable poller #4 [got 0 values in 0.000025 sec, idle 1 sec]
root 28484 0.0 0.0 4970004 8592 ? S Jan25 0:39 /usr/sbin/zabbix_server: unreachable poller #5 [got 0 values in 0.000024 sec, idle 1 sec]
root 28485 0.0 0.0 4970004 8588 ? S Jan25 0:39 /usr/sbin/zabbix_server: unreachable poller #6 [got 0 values in 0.000047 sec, idle 1 sec]
root 28487 0.0 0.0 4970004 8604 ? S Jan25 0:38 /usr/sbin/zabbix_server: unreachable poller #7 [got 0 values in 0.000027 sec, idle 1 sec]
root 28488 0.0 0.0 4970004 8580 ? S Jan25 0:39 /usr/sbin/zabbix_server: unreachable poller #8 [got 0 values in 0.000024 sec, idle 1 sec]
root 28489 0.0 0.0 4970004 8620 ? S Jan25 0:39 /usr/sbin/zabbix_server: unreachable poller #9 [got 0 values in 0.000025 sec, idle 1 sec]
root 28490 0.0 0.0 4970004 8604 ? S Jan25 0:40 /usr/sbin/zabbix_server: unreachable poller #10 [got 0 values in 0.000031 sec, idle 1 sec]
root 28492 0.0 0.0 4890832 12956 ? S Jan25 0:10 /usr/sbin/zabbix_server: trapper #1 [processed data in 0.000134 sec, waiting for connection]
root 28493 0.0 0.0 4890840 15160 ? S Jan25 0:09 /usr/sbin/zabbix_server: trapper #2 [processed data in 0.000478 sec, waiting for connection]
root 28494 0.0 0.0 4890840 15024 ? S Jan25 0:10 /usr/sbin/zabbix_server: trapper #3 [processed data in 0.016694 sec, waiting for connection]
root 28495 0.0 0.0 4890832 15012 ? S Jan25 0:10 /usr/sbin/zabbix_server: trapper #4 [processed data in 0.000118 sec, waiting for connection]
root 28496 0.0 0.0 4890844 14924 ? S Jan25 0:10 /usr/sbin/zabbix_server: trapper #5 [processed data in 0.002135 sec, waiting for connection]
root 28497 0.0 0.0 4890824 15012 ? S Jan25 0:10 /usr/sbin/zabbix_server: trapper #6 [processed data in 0.000123 sec, waiting for connection]
root 28498 0.0 0.0 4890844 14904 ? S Jan25 0:10 /usr/sbin/zabbix_server: trapper #7 [processed data in 0.001253 sec, waiting for connection]
root 28500 0.0 0.0 4883956 9080 ? S Jan25 0:09 /usr/sbin/zabbix_server: trapper #8 [processed data in 0.000345 sec, waiting for connection]
root 28501 0.0 0.0 4883956 9584 ? S Jan25 0:10 /usr/sbin/zabbix_server: trapper #9 [processed data in 0.001907 sec, waiting for connection]
root 28503 0.0 0.0 4890844 15024 ? S Jan25 0:10 /usr/sbin/zabbix_server: trapper #10 [processed data in 0.000147 sec, waiting for connection]
root 28504 0.0 0.0 4890844 14996 ? S Jan25 0:10 /usr/sbin/zabbix_server: trapper #11 [processed data in 0.000140 sec, waiting for connection]
root 28505 0.0 0.0 4890844 15004 ? S Jan25 0:10 /usr/sbin/zabbix_server: trapper #12 [processed data in 0.000345 sec, waiting for connection]
root 28507 0.0 0.0 4890844 14968 ? S Jan25 0:10 /usr/sbin/zabbix_server: trapper #13 [processed data in 0.000431 sec, waiting for connection]
root 28512 0.0 0.0 4890840 15012 ? S Jan25 0:09 /usr/sbin/zabbix_server: trapper #14 [processed data in 0.002681 sec, waiting for connection]
root 28514 0.0 0.0 4890844 14940 ? S Jan25 0:10 /usr/sbin/zabbix_server: trapper #15 [processed data in 0.000555 sec, waiting for connection]
root 28516 0.0 0.0 4890840 14900 ? S Jan25 0:10 /usr/sbin/zabbix_server: trapper #16 [processed data in 0.000145 sec, waiting for connection]
root 28517 0.0 0.0 4883956 8840 ? S Jan25 0:10 /usr/sbin/zabbix_server: trapper #17 [processed data in 0.001078 sec, waiting for connection]
root 28518 0.0 0.0 4890824 15216 ? S Jan25 0:10 /usr/sbin/zabbix_server: trapper #18 [processed data in 0.000193 sec, waiting for connection]
root 28522 0.0 0.0 4890840 14948 ? S Jan25 0:10 /usr/sbin/zabbix_server: trapper #19 [processed data in 0.000460 sec, waiting for connection]
root 28524 0.0 0.0 4890844 15176 ? S Jan25 0:10 /usr/sbin/zabbix_server: trapper #20 [processed data in 0.000905 sec, waiting for connection]
root 28528 0.0 0.0 4883956 8924 ? S Jan25 0:10 /usr/sbin/zabbix_server: trapper #21 [processed data in 0.000132 sec, waiting for connection]
root 28529 0.0 0.0 4883956 8908 ? S Jan25 0:09 /usr/sbin/zabbix_server: trapper #22 [processed data in 0.000342 sec, waiting for connection]
root 28531 0.0 0.0 4890844 14996 ? S Jan25 0:10 /usr/sbin/zabbix_server: trapper #23 [processed data in 0.000531 sec, waiting for connection]
root 28534 0.0 0.0 4890844 15040 ? S Jan25 0:10 /usr/sbin/zabbix_server: trapper #24 [processed data in 0.000148 sec, waiting for connection]
root 28538 0.0 0.0 4890840 15020 ? S Jan25 0:10 /usr/sbin/zabbix_server: trapper #25 [processed data in 0.000524 sec, waiting for connection]
root 28539 0.0 0.0 4865340 3844 ? S Jan25 0:26 /usr/sbin/zabbix_server: icmp pinger #1 [got 0 values in 0.000024 sec, idle 3 sec]
root 28543 0.0 0.0 4865340 3848 ? S Jan25 0:25 /usr/sbin/zabbix_server: icmp pinger #2 [got 0 values in 0.000022 sec, idle 3 sec]
root 28545 0.0 0.0 4865340 3848 ? S Jan25 0:25 /usr/sbin/zabbix_server: icmp pinger #3 [got 0 values in 0.000024 sec, idle 3 sec]
root 28549 0.0 0.0 4865340 3844 ? S Jan25 0:25 /usr/sbin/zabbix_server: icmp pinger #4 [got 0 values in 0.000023 sec, idle 3 sec]
root 28552 0.0 0.0 4865340 3844 ? S Jan25 0:25 /usr/sbin/zabbix_server: icmp pinger #5 [got 0 values in 0.000023 sec, idle 3 sec]
root 28558 0.0 0.0 4865340 3844 ? S Jan25 0:26 /usr/sbin/zabbix_server: icmp pinger #6 [got 0 values in 0.000022 sec, idle 3 sec]
root 28561 0.0 0.0 4865340 3848 ? S Jan25 0:25 /usr/sbin/zabbix_server: icmp pinger #7 [got 0 values in 0.000024 sec, idle 3 sec]
root 28563 0.0 0.0 4865340 3844 ? S Jan25 0:26 /usr/sbin/zabbix_server: icmp pinger #8 [got 0 values in 0.000024 sec, idle 3 sec]
root 28569 0.0 0.0 4865340 3848 ? S Jan25 0:26 /usr/sbin/zabbix_server: icmp pinger #9 [got 0 values in 0.000023 sec, idle 3 sec]
root 28571 0.0 0.0 4865340 3844 ? S Jan25 0:26 /usr/sbin/zabbix_server: icmp pinger #10 [got 0 values in 0.000024 sec, idle 3 sec]
root 28574 0.0 0.0 4865340 3844 ? S Jan25 0:25 /usr/sbin/zabbix_server: icmp pinger #11 [got 0 values in 0.000027 sec, idle 3 sec]
root 28577 0.0 0.0 4865340 3844 ? S Jan25 0:26 /usr/sbin/zabbix_server: icmp pinger #12 [got 0 values in 0.000024 sec, idle 3 sec]
root 28578 0.0 0.0 4865340 3848 ? S Jan25 0:25 /usr/sbin/zabbix_server: icmp pinger #13 [got 0 values in 0.000023 sec, idle 3 sec]
root 28581 0.0 0.0 4865340 3844 ? S Jan25 0:25 /usr/sbin/zabbix_server: icmp pinger #14 [got 0 values in 0.000023 sec, idle 3 sec]
root 28582 0.0 0.0 4865340 3844 ? S Jan25 0:25 /usr/sbin/zabbix_server: icmp pinger #15 [got 0 values in 0.000023 sec, idle 3 sec]
root 28584 0.0 0.0 4865340 3848 ? S Jan25 0:25 /usr/sbin/zabbix_server: icmp pinger #16 [got 0 values in 0.000023 sec, idle 3 sec]
root 28585 0.0 0.0 4865340 3844 ? S Jan25 0:25 /usr/sbin/zabbix_server: icmp pinger #17 [got 0 values in 0.000024 sec, idle 3 sec]
root 28586 0.0 0.0 4865340 3844 ? S Jan25 0:26 /usr/sbin/zabbix_server: icmp pinger #18 [got 0 values in 0.000024 sec, idle 3 sec]
root 28587 0.0 0.0 4865344 3844 ? S Jan25 0:25 /usr/sbin/zabbix_server: icmp pinger #19 [pinging hosts]
root 28589 0.0 0.0 4865340 3844 ? S Jan25 0:25 /usr/sbin/zabbix_server: icmp pinger #20 [got 0 values in 0.000023 sec, idle 3 sec]
root 28593 0.0 0.0 4865340 3848 ? S Jan25 0:26 /usr/sbin/zabbix_server: icmp pinger #21 [got 0 values in 0.000024 sec, idle 3 sec]
root 28594 0.0 0.0 4865340 3848 ? S Jan25 0:26 /usr/sbin/zabbix_server: icmp pinger #22 [got 0 values in 0.000038 sec, idle 3 sec]
root 28596 0.0 0.0 4865340 3848 ? S Jan25 0:25 /usr/sbin/zabbix_server: icmp pinger #23 [got 0 values in 0.000026 sec, idle 3 sec]
root 28597 0.0 0.0 4865340 3844 ? S Jan25 0:25 /usr/sbin/zabbix_server: icmp pinger #24 [got 0 values in 0.000024 sec, idle 3 sec]
root 28598 0.0 0.0 4865340 3848 ? S Jan25 0:25 /usr/sbin/zabbix_server: icmp pinger #25 [got 0 values in 0.000025 sec, idle 3 sec]
root 28599 0.0 0.0 4861972 3656 ? S Jan25 1:48 /usr/sbin/zabbix_server: alert manager #1 [sent 0, failed 0 alerts, idle 5.006350 sec during 5.006433 sec]
root 28600 0.2 0.0 4862904 7336 ? S Jan25 25:05 /usr/sbin/zabbix_server: preprocessing manager #1 [queued 1, processed 124 values, idle 5.189594 sec during 5.192199 sec]
root 28601 0.0 0.0 4861972 2956 ? S Jan25 8:09 /usr/sbin/zabbix_server: preprocessing worker #1 started
root 28602 0.0 0.0 4861972 2872 ? S Jan25 0:02 /usr/sbin/zabbix_server: preprocessing worker #2 started
root 28603 0.0 0.0 4861972 2876 ? S Jan25 0:00 /usr/sbin/zabbix_server: preprocessing worker #3 started
[root@mhdal05zm01 ~]#
|
|
[root@mhdal05zm01 ~]# systemctl status zabbix-server.service
● zabbix-server.service - Zabbix Server
Loaded: loaded (/usr/lib/systemd/system/zabbix-server.service; enabled; vendor preset: disabled)
Active: active (running) since Fri 2019-01-25 10:48:08 CST; 6 days ago
Main PID: 28391 (zabbix_server)
CGroup: /system.slice/zabbix-server.service
├─28391 /usr/sbin/zabbix_server -c /etc/zabbix/zabbix_server.conf
├─28396 /usr/sbin/zabbix_server: configuration syncer [synced configuration in 0.151767 sec, idle 60 sec]
├─28397 /usr/sbin/zabbix_server: ipmi manager #1 [scheduled 0, polled 0 values, idle 5.005411 sec during 5.005486 sec]
├─28398 /usr/sbin/zabbix_server: alerter #1 [sent 0, failed 0 alerts, idle 240.328257 sec during 240.339549 sec]
├─28399 /usr/sbin/zabbix_server: housekeeper [deleted 53177 hist/trends, 0 items/triggers, 1 events, 7 sessions, 0 alarms, 122 audit items in 16.132429 sec, idle for 1 ho...
├─28400 /usr/sbin/zabbix_server: timer #1 [updated 0 hosts, suppressed 0 events in 0.000499 sec, idle 59 sec]
├─28401 /usr/sbin/zabbix_server: timer #2 [suppressed 0 events in 0.001585 sec, idle 59 sec]
├─28402 /usr/sbin/zabbix_server: timer #3 [suppressed 0 events in 0.001067 sec, idle 59 sec]
├─28403 /usr/sbin/zabbix_server: timer #4 [suppressed 0 events in 0.001483 sec, idle 59 sec]
├─28404 /usr/sbin/zabbix_server: timer #5 [suppressed 0 events in 0.001136 sec, idle 59 sec]
├─28405 /usr/sbin/zabbix_server: timer #6 [suppressed 0 events in 0.001672 sec, idle 59 sec]
├─28406 /usr/sbin/zabbix_server: timer #7 [suppressed 0 events in 0.001096 sec, idle 59 sec]
├─28407 /usr/sbin/zabbix_server: timer #8 [suppressed 0 events in 0.001314 sec, idle 59 sec]
├─28408 /usr/sbin/zabbix_server: timer #9 [suppressed 0 events in 0.001157 sec, idle 59 sec]
├─28409 /usr/sbin/zabbix_server: timer #10 [suppressed 0 events in 0.001411 sec, idle 59 sec]
├─28410 /usr/sbin/zabbix_server: http poller #1 [got 0 values in 0.000792 sec, idle 5 sec]
├─28411 /usr/sbin/zabbix_server: http poller #2 [got 0 values in 0.000825 sec, idle 5 sec]
├─28412 /usr/sbin/zabbix_server: http poller #3 [got 0 values in 0.000906 sec, idle 5 sec]
├─28413 /usr/sbin/zabbix_server: http poller #4 [got 0 values in 0.000790 sec, idle 5 sec]
├─28414 /usr/sbin/zabbix_server: http poller #5 [got 0 values in 0.000817 sec, idle 5 sec]
├─28415 /usr/sbin/zabbix_server: discoverer #1 [processed 0 rules in 0.001294 sec, idle 60 sec]
├─28416 /usr/sbin/zabbix_server: discoverer #2 [processed 0 rules in 0.000922 sec, idle 60 sec]
├─28417 /usr/sbin/zabbix_server: discoverer #3 [processed 0 rules in 0.001396 sec, idle 60 sec]
├─28418 /usr/sbin/zabbix_server: discoverer #4 [processed 0 rules in 0.000944 sec, idle 60 sec]
├─28419 /usr/sbin/zabbix_server: discoverer #5 [processed 0 rules in 0.001307 sec, idle 60 sec]
├─28420 /usr/sbin/zabbix_server: history syncer #1 [processed 0 values, 0 triggers in 0.000025 sec, idle 1 sec]
├─28421 /usr/sbin/zabbix_server: history syncer #2 [processed 0 values, 0 triggers in 0.000026 sec, idle 1 sec]
├─28422 /usr/sbin/zabbix_server: history syncer #3 [processed 0 values, 0 triggers in 0.000039 sec, idle 1 sec]
├─28423 /usr/sbin/zabbix_server: history syncer #4 [processed 0 values, 0 triggers in 0.000051 sec, idle 1 sec]
├─28424 /usr/sbin/zabbix_server: history syncer #5 [processed 0 values, 0 triggers in 0.000025 sec, idle 1 sec]
├─28425 /usr/sbin/zabbix_server: history syncer #6 [processed 8 values, 0 triggers in 0.004857 sec, idle 1 sec]
├─28427 /usr/sbin/zabbix_server: history syncer #7 [processed 0 values, 2 triggers in 0.000296 sec, idle 1 sec]
├─28429 /usr/sbin/zabbix_server: history syncer #8 [processed 14 values, 5 triggers in 0.005840 sec, idle 1 sec]
├─28431 /usr/sbin/zabbix_server: history syncer #9 [processed 0 values, 0 triggers in 0.000025 sec, idle 1 sec]
├─28433 /usr/sbin/zabbix_server: history syncer #10 [processed 0 values, 0 triggers in 0.000030 sec, idle 1 sec]
├─28435 /usr/sbin/zabbix_server: escalator #1 [processed 0 escalations in 0.004914 sec, idle 3 sec]
├─28436 /usr/sbin/zabbix_server: ipmi poller #1 [polled 0 values, idle 3599.842182 sec during 3599.842195 sec]
├─28437 /usr/sbin/zabbix_server: ipmi poller #2 [polled 0 values, idle 3599.842176 sec during 3599.842190 sec]
├─28438 /usr/sbin/zabbix_server: snmp trapper [processed data in 0.000026 sec, idle 1 sec]
├─28440 /usr/sbin/zabbix_server: proxy poller #1 [exchanged data with 0 proxies in 0.000027 sec, idle 5 sec]
├─28441 /usr/sbin/zabbix_server: proxy poller #2 [exchanged data with 0 proxies in 0.000027 sec, idle 5 sec]
├─28443 /usr/sbin/zabbix_server: self-monitoring [processed data in 0.000031 sec, idle 1 sec]
├─28444 /usr/sbin/zabbix_server: vmware collector #1 [updated 0, removed 0 VMware services in 0.000027 sec, idle 5 sec]
├─28445 /usr/sbin/zabbix_server: vmware collector #2 [updated 0, removed 0 VMware services in 0.000029 sec, idle 5 sec]
├─28446 /usr/sbin/zabbix_server: task manager [processed 0 task(s) in 0.000171 sec, idle 5 sec]
├─28449 /usr/sbin/zabbix_server: poller #1 [got 0 values in 0.000025 sec, idle 1 sec]
├─28450 /usr/sbin/zabbix_server: poller #2 [got 14 values in 2.070153 sec, idle 1 sec]
├─28452 /usr/sbin/zabbix_server: poller #3 [got 0 values in 0.000025 sec, idle 1 sec]
├─28453 /usr/sbin/zabbix_server: poller #4 [got 0 values in 0.000024 sec, idle 1 sec]
├─28454 /usr/sbin/zabbix_server: poller #5 [got 3 values in 0.026120 sec, idle 1 sec]
├─28455 /usr/sbin/zabbix_server: poller #6 [got 0 values in 0.000025 sec, idle 1 sec]
├─28457 /usr/sbin/zabbix_server: poller #7 [got 0 values in 0.000025 sec, getting values]
├─28458 /usr/sbin/zabbix_server: poller #8 [got 0 values in 0.000018 sec, idle 1 sec]
├─28459 /usr/sbin/zabbix_server: poller #9 [got 0 values in 0.000024 sec, idle 1 sec]
├─28460 /usr/sbin/zabbix_server: poller #10 [got 0 values in 0.000026 sec, idle 1 sec]
├─28461 /usr/sbin/zabbix_server: poller #11 [got 0 values in 0.000025 sec, idle 1 sec]
├─28462 /usr/sbin/zabbix_server: poller #12 [got 0 values in 0.000025 sec, idle 1 sec]
├─28463 /usr/sbin/zabbix_server: poller #13 [got 0 values in 0.000029 sec, idle 1 sec]
├─28464 /usr/sbin/zabbix_server: poller #14 [got 0 values in 0.000026 sec, idle 1 sec]
├─28465 /usr/sbin/zabbix_server: poller #15 [got 6 values in 0.827909 sec, getting values]
├─28468 /usr/sbin/zabbix_server: poller #16 [got 3 values in 0.244164 sec, getting values]
├─28469 /usr/sbin/zabbix_server: poller #17 [got 0 values in 0.000025 sec, idle 1 sec]
├─28472 /usr/sbin/zabbix_server: poller #18 [got 0 values in 0.000025 sec, idle 1 sec]
├─28473 /usr/sbin/zabbix_server: poller #19 [got 0 values in 0.000027 sec, idle 1 sec]
├─28474 /usr/sbin/zabbix_server: poller #20 [got 0 values in 0.000025 sec, idle 1 sec]
├─28475 /usr/sbin/zabbix_server: poller #21 [got 0 values in 0.000025 sec, idle 1 sec]
├─28476 /usr/sbin/zabbix_server: poller #22 [got 0 values in 0.000026 sec, idle 1 sec]
├─28477 /usr/sbin/zabbix_server: poller #23 [got 0 values in 0.000025 sec, idle 1 sec]
├─28478 /usr/sbin/zabbix_server: poller #24 [got 0 values in 0.000025 sec, idle 1 sec]
├─28479 /usr/sbin/zabbix_server: poller #25 [got 0 values in 0.000024 sec, idle 1 sec]
├─28480 /usr/sbin/zabbix_server: unreachable poller #1 [got 0 values in 0.000088 sec, idle 2 sec]
├─28481 /usr/sbin/zabbix_server: unreachable poller #2 [got 0 values in 0.000066 sec, idle 2 sec]
├─28482 /usr/sbin/zabbix_server: unreachable poller #3 [got 0 values in 0.000104 sec, idle 2 sec]
├─28483 /usr/sbin/zabbix_server: unreachable poller #4 [got 0 values in 0.000029 sec, idle 2 sec]
├─28484 /usr/sbin/zabbix_server: unreachable poller #5 [got 0 values in 0.000079 sec, idle 2 sec]
├─28485 /usr/sbin/zabbix_server: unreachable poller #6 [got 0 values in 0.000072 sec, idle 2 sec]
├─28487 /usr/sbin/zabbix_server: unreachable poller #7 [got 0 values in 0.000085 sec, idle 2 sec]
├─28488 /usr/sbin/zabbix_server: unreachable poller #8 [got 0 values in 0.000029 sec, idle 2 sec]
├─28489 /usr/sbin/zabbix_server: unreachable poller #9 [got 0 values in 0.000059 sec, idle 2 sec]
├─28490 /usr/sbin/zabbix_server: unreachable poller #10 [got 0 values in 0.000029 sec, idle 2 sec]
├─28492 /usr/sbin/zabbix_server: trapper #1 [processed data in 0.003677 sec, waiting for connection]
├─28493 /usr/sbin/zabbix_server: trapper #2 [processed data in 0.000669 sec, waiting for connection]
├─28494 /usr/sbin/zabbix_server: trapper #3 [processed data in 0.001309 sec, waiting for connection]
├─28495 /usr/sbin/zabbix_server: trapper #4 [processed data in 0.001283 sec, waiting for connection]
├─28496 /usr/sbin/zabbix_server: trapper #5 [processed data in 0.000569 sec, waiting for connection]
├─28497 /usr/sbin/zabbix_server: trapper #6 [processed data in 0.000372 sec, waiting for connection]
├─28498 /usr/sbin/zabbix_server: trapper #7 [processed data in 0.000557 sec, waiting for connection]
├─28500 /usr/sbin/zabbix_server: trapper #8 [processed data in 0.000518 sec, waiting for connection]
├─28501 /usr/sbin/zabbix_server: trapper #9 [processed data in 0.001907 sec, waiting for connection]
├─28503 /usr/sbin/zabbix_server: trapper #10 [processed data in 0.000147 sec, waiting for connection]
├─28504 /usr/sbin/zabbix_server: trapper #11 [processed data in 0.001411 sec, waiting for connection]
├─28505 /usr/sbin/zabbix_server: trapper #12 [processed data in 0.000558 sec, waiting for connection]
├─28507 /usr/sbin/zabbix_server: trapper #13 [processed data in 0.000125 sec, waiting for connection]
├─28512 /usr/sbin/zabbix_server: trapper #14 [processed data in 0.000542 sec, waiting for connection]
├─28514 /usr/sbin/zabbix_server: trapper #15 [processed data in 0.000174 sec, waiting for connection]
├─28516 /usr/sbin/zabbix_server: trapper #16 [processed data in 0.001276 sec, waiting for connection]
├─28517 /usr/sbin/zabbix_server: trapper #17 [processed data in 0.001078 sec, waiting for connection]
├─28518 /usr/sbin/zabbix_server: trapper #18 [processed data in 0.000483 sec, waiting for connection]
├─28522 /usr/sbin/zabbix_server: trapper #19 [processed data in 0.000527 sec, waiting for connection]
├─28524 /usr/sbin/zabbix_server: trapper #20 [processed data in 0.002379 sec, waiting for connection]
├─28528 /usr/sbin/zabbix_server: trapper #21 [processed data in 0.000546 sec, waiting for connection]
├─28529 /usr/sbin/zabbix_server: trapper #22 [processed data in 0.000593 sec, waiting for connection]
├─28531 /usr/sbin/zabbix_server: trapper #23 [processed data in 0.020136 sec, waiting for connection]
├─28534 /usr/sbin/zabbix_server: trapper #24 [processed data in 0.000620 sec, waiting for connection]
├─28538 /usr/sbin/zabbix_server: trapper #25 [processed data in 0.000155 sec, waiting for connection]
├─28539 /usr/sbin/zabbix_server: icmp pinger #1 [got 0 values in 0.000024 sec, idle 5 sec]
├─28543 /usr/sbin/zabbix_server: icmp pinger #2 [got 0 values in 0.000024 sec, idle 5 sec]
├─28545 /usr/sbin/zabbix_server: icmp pinger #3 [got 0 values in 0.000024 sec, idle 5 sec]
├─28549 /usr/sbin/zabbix_server: icmp pinger #4 [got 0 values in 0.000024 sec, idle 5 sec]
├─28552 /usr/sbin/zabbix_server: icmp pinger #5 [got 0 values in 0.000023 sec, idle 5 sec]
├─28558 /usr/sbin/zabbix_server: icmp pinger #6 [got 0 values in 0.000023 sec, idle 5 sec]
├─28561 /usr/sbin/zabbix_server: icmp pinger #7 [got 0 values in 0.000025 sec, idle 5 sec]
├─28563 /usr/sbin/zabbix_server: icmp pinger #8 [got 0 values in 0.000024 sec, idle 5 sec]
├─28569 /usr/sbin/zabbix_server: icmp pinger #9 [got 0 values in 0.000023 sec, idle 5 sec]
├─28571 /usr/sbin/zabbix_server: icmp pinger #10 [got 0 values in 0.000024 sec, idle 5 sec]
├─28574 /usr/sbin/zabbix_server: icmp pinger #11 [got 0 values in 0.000024 sec, idle 5 sec]
├─28577 /usr/sbin/zabbix_server: icmp pinger #12 [got 0 values in 0.000035 sec, idle 5 sec]
├─28578 /usr/sbin/zabbix_server: icmp pinger #13 [got 0 values in 0.000024 sec, idle 5 sec]
├─28581 /usr/sbin/zabbix_server: icmp pinger #14 [got 0 values in 0.000025 sec, idle 5 sec]
├─28582 /usr/sbin/zabbix_server: icmp pinger #15 [got 0 values in 0.000024 sec, idle 5 sec]
├─28584 /usr/sbin/zabbix_server: icmp pinger #16 [got 0 values in 0.000038 sec, idle 5 sec]
├─28585 /usr/sbin/zabbix_server: icmp pinger #17 [got 0 values in 0.000023 sec, idle 5 sec]
├─28586 /usr/sbin/zabbix_server: icmp pinger #18 [got 0 values in 0.000024 sec, idle 5 sec]
├─28587 /usr/sbin/zabbix_server: icmp pinger #19 [got 0 values in 0.000024 sec, idle 5 sec]
├─28589 /usr/sbin/zabbix_server: icmp pinger #20 [got 0 values in 0.000025 sec, idle 5 sec]
├─28593 /usr/sbin/zabbix_server: icmp pinger #21 [got 0 values in 0.000024 sec, idle 5 sec]
├─28594 /usr/sbin/zabbix_server: icmp pinger #22 [got 0 values in 0.000024 sec, idle 5 sec]
├─28596 /usr/sbin/zabbix_server: icmp pinger #23 [got 0 values in 0.000039 sec, idle 5 sec]
├─28597 /usr/sbin/zabbix_server: icmp pinger #24 [got 0 values in 0.000037 sec, idle 5 sec]
├─28598 /usr/sbin/zabbix_server: icmp pinger #25 [got 0 values in 0.000024 sec, idle 5 sec]
├─28599 /usr/sbin/zabbix_server: alert manager #1 [sent 0, failed 0 alerts, idle 5.006751 sec during 5.006824 sec]
├─28600 /usr/sbin/zabbix_server: preprocessing manager #1 [queued 1, processed 141 values, idle 5.361502 sec during 5.364276 sec]
├─28601 /usr/sbin/zabbix_server: preprocessing worker #1 started
├─28602 /usr/sbin/zabbix_server: preprocessing worker #2 started
└─28603 /usr/sbin/zabbix_server: preprocessing worker #3 started
Feb 01 07:22:28 mhdal05zm01.mhsl.local sudo[4525]: root : TTY=unknown ; PWD=/ ; USER=root ; COMMAND=/bin/nmap -T5 -F 10.0.85.18
Feb 01 08:18:37 mhdal05zm01.mhsl.local sudo[12858]: root : TTY=unknown ; PWD=/ ; USER=root ; COMMAND=/bin/nmap -T5 -F 10.1.149.2
Feb 01 08:22:07 mhdal05zm01.mhsl.local sudo[13321]: root : TTY=unknown ; PWD=/ ; USER=root ; COMMAND=/bin/nmap -T5 -F 127.0.0.1
Feb 01 08:22:28 mhdal05zm01.mhsl.local sudo[13382]: root : TTY=unknown ; PWD=/ ; USER=root ; COMMAND=/bin/nmap -T5 -F 10.0.85.18
Feb 01 09:18:37 mhdal05zm01.mhsl.local sudo[22047]: root : TTY=unknown ; PWD=/ ; USER=root ; COMMAND=/bin/nmap -T5 -F 10.1.149.2
Feb 01 09:22:07 mhdal05zm01.mhsl.local sudo[22522]: root : TTY=unknown ; PWD=/ ; USER=root ; COMMAND=/bin/nmap -T5 -F 127.0.0.1
Feb 01 09:22:28 mhdal05zm01.mhsl.local sudo[22582]: root : TTY=unknown ; PWD=/ ; USER=root ; COMMAND=/bin/nmap -T5 -F 10.0.85.18
Feb 01 10:18:37 mhdal05zm01.mhsl.local sudo[31260]: root : TTY=unknown ; PWD=/ ; USER=root ; COMMAND=/bin/nmap -T5 -F 10.1.149.2
Feb 01 10:22:07 mhdal05zm01.mhsl.local sudo[31713]: root : TTY=unknown ; PWD=/ ; USER=root ; COMMAND=/bin/nmap -T5 -F 127.0.0.1
Feb 01 10:22:28 mhdal05zm01.mhsl.local sudo[31771]: root : TTY=unknown ; PWD=/ ; USER=root ; COMMAND=/bin/nmap -T5 -F 10.0.85.18
[root@mhdal05zm01 ~]#
|
|
Not sure if this is of interest, but from the systemctl output you can see the server process has been running "active (running) since Fri 2019-01-25 10:48:08 CST;", but the alerter process shows that it has not processed any messages in that time (which is not true based on the db queries you have already seen.
alerter #1 [sent 0, failed 0 alerts, idle 240.328257 sec during 240.339549 sec]
[root@mhdal05zm01 ~]# systemctl status zabbix-server.service
● zabbix-server.service - Zabbix Server
Loaded: loaded (/usr/lib/systemd/system/zabbix-server.service; enabled; vendor preset: disabled)
Active: active (running) since Fri 2019-01-25 10:48:08 CST; 6 days ago
Main PID: 28391 (zabbix_server)
CGroup: /system.slice/zabbix-server.service
├─28391 /usr/sbin/zabbix_server -c /etc/zabbix/zabbix_server.conf
├─28396 /usr/sbin/zabbix_server: configuration syncer [synced configuration in 0.151767 sec, idle 60 sec]
├─28397 /usr/sbin/zabbix_server: ipmi manager #1 [scheduled 0, polled 0 values, idle 5.005411 sec during 5.005486 sec]
├─28398 /usr/sbin/zabbix_server: alerter #1 [sent 0, failed 0 alerts, idle 240.328257 sec during 240.339549 sec]
|
|
As an additional measure to ensure I am using that config file and only this specific instance is writing to this database, I have updated the passwords to all users with acces to this database. I then only updated the one config file "/etc/zabbix/zabbix_server.conf" with the new zabbix user password.
So this ensures that only this user/instance has access to the database.
10751:20190201:115205.021 Starting Zabbix Server. Zabbix 4.0.3 (revision 87993).
10751:20190201:115205.021 ****** Enabled features ******
10751:20190201:115205.022 SNMP monitoring: YES
10751:20190201:115205.022 IPMI monitoring: YES
10751:20190201:115205.022 Web monitoring: YES
10751:20190201:115205.022 VMware monitoring: YES
10751:20190201:115205.022 SMTP authentication: YES
10751:20190201:115205.022 Jabber notifications: YES
10751:20190201:115205.022 Ez Texting notifications: YES
10751:20190201:115205.022 ODBC: YES
10751:20190201:115205.022 SSH2 support: YES
10751:20190201:115205.022 IPv6 support: YES
10751:20190201:115205.022 TLS support: YES
10751:20190201:115205.022 ******************************
10751:20190201:115205.022 using configuration file: /etc/zabbix/zabbix_server.conf
|
|
I can provide you with a patch that contains additional debug information if you are willing to compile manually
|
|
Please place this on hold while I confirm the issue still exist after the most recent changes I made.
|
|
Please send me the patch info and I will have it on hand.
|
|
Please collect log and attach, no need to increase log level:
patch -p0 -iZBX-15546.diff
Patch: ZBX-15546.diff
|
|
I have confirmed this was an Issue on my end. I appreciate everyone's assistance on this and want to thank all you for the hard work you put into helping me isolate the root cause.
The root cause was a second HA instance of zabbix that was running. It was a failover instance of 4.0 that attached to the same DB (zabbix40) that was supposed to only be started up (manually) in the event of our primary zabbix server failure. I did not catch this earlier as I did not consider the possibility that the primary and failover zabbix servers were BOTH running at the same time.
I am not sure what you could do to prevent this in the future other than adding a column to the alerts table and saving the pid of the process that took or attempted to take the given action.
Once again. Thank you for all the help with this. It is really appreciated.
Carl Slaughter
|
Generated at Thu Sep 11 21:55:39 EEST 2025 using Jira 9.12.4#9120004-sha1:625303b708afdb767e17cb2838290c41888e9ff0.