[ZBX-15711] zabbix-server crashes on preprocessing a valid PCRE regex Created: 2019 Feb 22 Updated: 2024 Apr 10 Resolved: 2019 May 01 |
|
| Status: | Closed |
| Project: | ZABBIX BUGS AND ISSUES |
| Component/s: | Server (S) |
| Affects Version/s: | 4.0.4 |
| Fix Version/s: | 4.2 (plan) |
| Type: | Documentation task | Priority: | Critical |
| Reporter: | Ilya Kruchinin | Assignee: | Vladislavs Sokurenko |
| Resolution: | Fixed | Votes: | 0 |
| Labels: | None | ||
| Remaining Estimate: | Not Specified | ||
| Time Spent: | Not Specified | ||
| Original Estimate: | Not Specified | ||
| Environment: |
Ubuntu 18.04.2 |
||
| Attachments: |
|
| Team: | |
| Sprint: | Sprint 49 (Feb 2019), Sprint 50 (Mar 2019), Sprint 51 (Apr 2019) |
| Story Points: | 0.25 |
| Description |
|
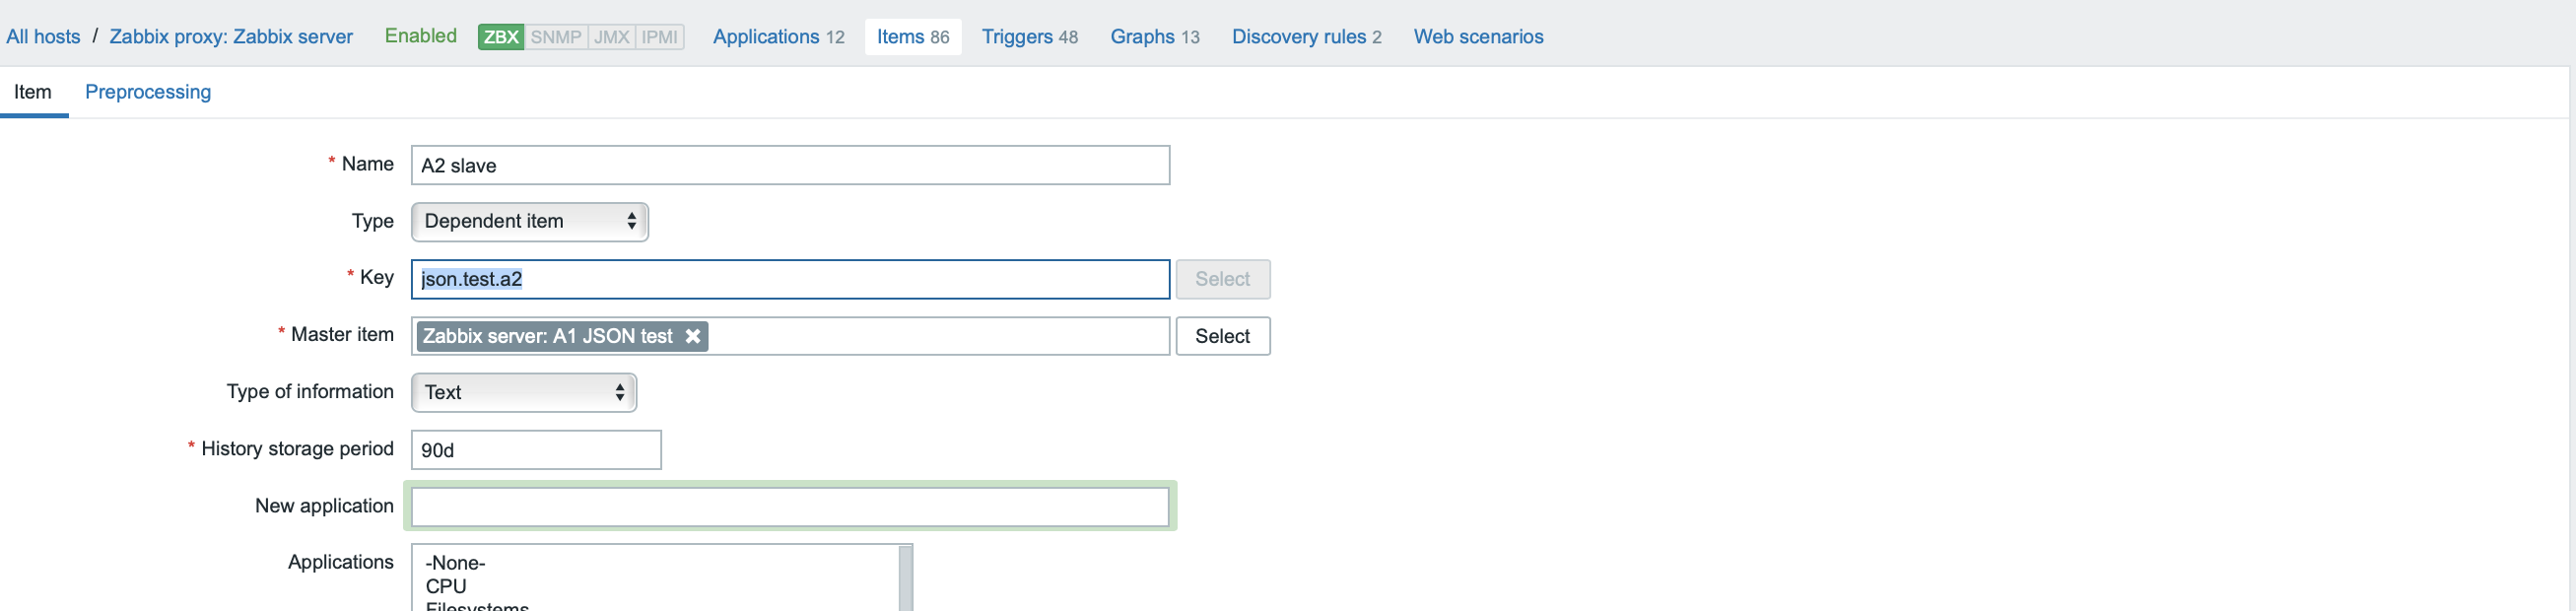
Steps to reproduce:
Result: 392:20190222:110914.069 server #33 started [preprocessing worker #3] 390:20190222:110914.145 server #31 started [preprocessing worker #1] 391:20190222:110914.146 server #32 started [preprocessing worker #2] 350:20190222:110916.458 One child process died (PID:392,exitcode/signal:11). Exiting ... zabbix_server [350]: Error waiting for process with PID 392: [10] No child processes 350:20190222:110916.512 syncing history data... 350:20190222:110918.675 syncing history data... 100.000000% 350:20190222:110918.675 syncing history data done 350:20190222:110918.675 syncing trend data... 350:20190222:110921.382 syncing trend data done 350:20190222:110921.383 Zabbix Server stopped. Zabbix 4.0.4 (revision 89349). Expected: |
| Comments |
| Comment by Ilya Kruchinin [ 2019 Feb 22 ] |
|
Both zabbix-server and zabbix-proxy are at version 4.0.4 (latest stable LTS). Once the regex preprocessing is removed using GUI (and purged history data on proxy by recreating sqlite DB, just in case) - it starts working fine again. The PCRE regex was checked for validity using "regexr.com" with "PCRE" mode (server-side). Please let me know how I can assist in further troubleshooting. |
| Comment by Edgar Akhmetshin [ 2019 Feb 22 ] |
|
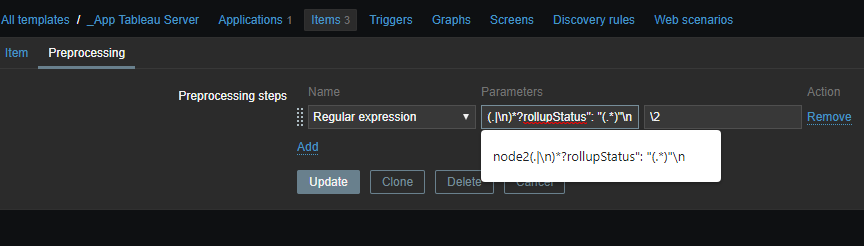
Hello Ilya, Thank you for reporting the issue. I cannot reproduce the problem using your regular expression or JSON Path: node2(.|\n)*?rollupStatus": "(.*)"\n $.clusterStatus.nodes[0].services[0].rollupStatus Test setup: edgar@owbr:~# lsb_release -d && zabbix_proxy -V| grep '(Zabbix)' && zabbix_server -V| grep '(Zabbix)' Description: Ubuntu 18.04.2 LTS zabbix_proxy (Zabbix) 4.0.4 zabbix_server (Zabbix) 4.0.4 Perhaps you missed some nuances in the steps to reproduce problem? Regards, |
| Comment by Ilya Kruchinin [ 2019 Feb 22 ] |
|
We can't use JSONPath as Zabbix only supports a subset (positional) lookup, and the position changes over time in the output. We have to use PCRE Regex as a workaround. I will now re-implement the monitoring and will update you again (but I've reproduced the issue consistently, numerous times before) within 20 minutes. Would you like me to provide a crashdump or logs with higher verbosity? |
| Comment by Ilya Kruchinin [ 2019 Feb 22 ] |
|
As soon as I put the data regex in, it crashed again upon receiving a new value. |
| Comment by Ilya Kruchinin [ 2019 Feb 22 ] |
|
|
| Comment by Edgar Akhmetshin [ 2019 Feb 22 ] |
|
Ilya, I do not suggest you use JSON, just checked the possible options # from both grep ^ /etc/apt/sources.list /etc/apt/sources.list.d/* # from server ldd /usr/sbin/zabbix_server objdump -Dswx /usr/sbin/zabbix_server # from proxy ldd /usr/sbin/zabbix_proxy objdump -Dswx /usr/sbin/zabbix_proxy Regards, |
| Comment by Ilya Kruchinin [ 2019 Feb 22 ] |
|
Zabbix is from the latest official deb packages from repo.zabbix.com repository Description: Ubuntu 18.04.2 LTS zabbix_server (Zabbix) 4.0.4
|
| Comment by Edgar Akhmetshin [ 2019 Feb 22 ] |
|
Good, also please show php and php PCRE version used: php -v php --ri pcre Regards, |
| Comment by Ilya Kruchinin [ 2019 Feb 22 ] |
| Comment by Ilya Kruchinin [ 2019 Feb 22 ] |
| Comment by Ilya Kruchinin [ 2019 Feb 22 ] |
|
PHP is NOT installed on the box that runs the zabbix-server component.
(//different VM, NOT on the same box as zabbix-server, which does NOT have php installed): root@ip-172-22-222-81:~# php -v pcre PCRE (Perl Compatible Regular Expressions) Support => enabled Directive => Local Value => Master Value |
| Comment by Ilya Kruchinin [ 2019 Feb 22 ] |
|
Same applies to proxy (latest official LTS version), but the proxy does not crash, only the server component crashes. See details. |
| Comment by Ilya Kruchinin [ 2019 Feb 22 ] |
|
I have provided all the info you requested. Could you please let me know if you need anything else?
|
| Comment by Edgar Akhmetshin [ 2019 Feb 22 ] |
|
Thank you, Ilya One last question: select * from item_preproc where params like '%node2%'\G; We will analyze information provided and perform some checks. Regards, |
| Comment by Ilya Kruchinin [ 2019 Feb 22 ] |
MySQL [zabbix]> select * from item_preproc where params like '%node2%'\G; *************************** 1. row *************************** item_preprocid: 38876 itemid: 133366 step: 1 type: 5 params: node2(.|\n)*?rollupStatus": "(.*)"\n \2 *************************** 2. row *************************** item_preprocid: 38877 itemid: 133367 step: 1 type: 5 params: node2(.|\n)*?rollupStatus": "(.*)"\n \2 *************************** 3. row *************************** item_preprocid: 38878 itemid: 133368 step: 2 type: 5 params: node2(.|\n)*?rollupStatus": "(.*)"\n \2 3 rows in set (0.00 sec) ERROR: No query specified MySQL [zabbix]> |
| Comment by Ilya Kruchinin [ 2019 Feb 22 ] |
|
itemid 133366 is in a template. 133367 is a host item (inherited from the template) 133368 is a host item on another host (inherited from template, but I DON'T know why in the DB it has a different step number (2, as for the first host and template it has step: 1). |
| Comment by Ilya Kruchinin [ 2019 Feb 22 ] |
|
Just in case (additional info). Out of the two monitored hosts, host with itemid=133367 is the one that has a valid parent data (e.g. it's parent item was successfully received) Th other host, with itemid=1333367 has NO parent data (hasn't been submitted even once, so the parent item is "unsupported").
Please test in your environment as well (this scenario). Thanks |
| Comment by Vladislavs Sokurenko [ 2019 Feb 22 ] |
|
Please provide backtrace, from the Zabbix server log, thanks ! |
| Comment by Glebs Ivanovskis [ 2019 Feb 22 ] |
|
Will the outcome of this regexp be any different? (?s)node2.*?rollupStatus": "([^"]*) Use \1 in Output. |
| Comment by Ilya Kruchinin [ 2019 Feb 26 ] |
|
Hi Glebs, If I use the regex you suggested, then an item becomes unsupported with the following error: Item preprocessing step #1 failed: cannot perform regular expression match: pattern does not match, type "string", value "{"clusterStatus":{"rollupRequestedDeploymentState":"Unknown","href":"/api/0.5/status","nodes":[{"rollupRequestedDeploymentState":"Unknown","nodeId":"node2","services":[{"rollupRequestedDeploymentState":"Enabled","instances":[{"processStatus":"Active","code":"ACTIVE","instanceId":"0","microservices":{},"timestampUtc":1551134603409,"binaryVersion":"20191.19.0202.2137","currentDeploymentState":"Enabled"}],"serviceName":"filestore","rollupStatus":"Running"},{"rollupRequestedDeploymentState":"Disabled","instances":[{"message":"java.net.ConnectException: Connection refused: connect","processStatus":"Stopped","instanceId":"0","microservices":{},"timestampUtc":1551134551846,"binaryVersion":"20191.19.0202.2137","currentDeploymentState":"Disabled"}],"serviceName":"siteimportexport","rollupStatus":"Stopped"},{"rollupRequestedDeploymentState":"Disabled","instances":[{"message":"java.net.ConnectException: Connection refused: connect","processStatus":"Stopped","instanceId":"0","microservices":{},"timestampUtc":1551134551846,"binaryVersion":"20191.19.0202.2137","currentDeploymentState":"Disabled"}],"serviceName":"databasemaintenance","rollupStatus":"Stopped"},{"rollupRequestedDeploymentState":"Enabled","instances":[{"processStatus":"Active","code":"PONG","instanceId":"0","microservices":{},"timestampUtc":1551134553831,"binaryVersion":"20191.19.0202.2137","currentDeploymentState":"Enabled"},{"processStatus":"Active","code":"PONG","instanceId":"1","microservices":{},"timestampUtc":1551134608202,"binaryVersion":"20191.19.0202.2137","currentDeploymentState":"Enabled"}],"serviceName":"cacheserver","rollupStatus":"Running"},{"rollupRequestedDeploymentState":"Enabled","instances":[{"processStatus":"Active","instanceId":"0","microservices":{},"timestampUtc":1551134603647,"binaryVersion":"20191.19.0202.2137","currentDeploymentState":"Enabled"},{"processStatus":"Active","instanceId":"1","microservices":{},"timestampUt
|
| Comment by Ilya Kruchinin [ 2019 Feb 26 ] |
|
Vladislavs, I will now try to find how to get the backtrace and provide you with details. |
| Comment by Glebs Ivanovskis [ 2019 Feb 26 ] |
|
Remove this space if you have switched to minified JSON format: (?s)node2.*?rollupStatus": "([^"]*)
^
Or insert \s* left and right of : to be safe. |
| Comment by Ilya Kruchinin [ 2019 Feb 26 ] |
|
@Vladislavs - I increased the log level by sending -R log_level_increase 4 times, the log is huge, but there is no line containing the word "Backtrace" in zabbix-server.log. Could you please let me know how I can "dump" the backtrace. @Glebs, trying this now and it works (no crash!) (?s)node2.*?rollupStatus"\s*:\s*"([^"]*)
Looks like the workaround suggested by Glebs is working. But I'd still love to get the actual issue fixed. |
| Comment by Ilya Kruchinin [ 2019 Feb 26 ] |
|
Not sure why there's no backtrace in the log file after increasing the log level - is there any other way I can get the backtrace info? Thanks. |
| Comment by Glebs Ivanovskis [ 2019 Feb 26 ] |
|
Backtrace is in the log file at any log level (provided the platform supports it) when the crash happens. If there are no more crashes, there are clearly no more backtraces. Maybe you can recover log files from earlier crashes? |
| Comment by Ilya Kruchinin [ 2019 Feb 26 ] |
|
Update: I may have an idea why you couldn't reproduce the issue. When I gave you the "payload" file, I copy-pasted it (it was not RAW data). Please disregard the previous payload file (zabbix_data.txt) and re-run the test using the RAW data file (payload saved by running: zabbix_get -s aumeltab01 -k 'tableau.status' > /tmp/payload_raw.txt) |
| Comment by Ilya Kruchinin [ 2019 Feb 26 ] |
|
Glebs, I caused the crash by putting the original regex, waited for it to happen, but there is definitely no "Backtrace" line in logs.
31345:20190226:100043.769 End of lld_applications_make():0 applications 31345:20190226:100043.769 In lld_applications_validate() 31345:20190226:100043.769 End of lld_applications_validate() 31345:20190226:100043.769 In lld_item_application_prototypes_get() 31345:20190226:100043.769 query [txnlev:0] [select application_prototypeid,itemid from item_application_prototype where itemid in (109548,109549)] 31344:20190226:100043.769 In lld_hostmacros_get() 31344:20190226:100043.769 query [txnlev:0] [select hm.macro,hm.value from hostmacro hm,items i where hm.hostid=i.hostid and i.itemid=125322] 31345:20190226:100043.769 query [txnlev:0] [select applicationid,itemid from items_applications where itemid in (109548,109549)] 31316:20190226:100043.778 One child process died (PID:31350,exitcode/signal:11). Exiting ... 31320:20190226:100043.778 Got signal [signal:15(SIGTERM),sender_pid:31316,sender_uid:112,reason:0]. Exiting ... 31321:20190226:100043.778 Got signal [signal:15(SIGTERM),sender_pid:31316,sender_uid:112,reason:0]. Exiting ... 31322:20190226:100043.780 Got signal [signal:15(SIGTERM),sender_pid:31316,sender_uid:112,reason:0]. Exiting ... 31328:20190226:100043.782 Got signal [signal:15(SIGTERM),sender_pid:31316,sender_uid:112,reason:0]. Exiting ... 31332:20190226:100043.784 Got signal [signal:15(SIGTERM),sender_pid:31316,sender_uid:112,reason:0]. Exiting ... 31338:20190226:100043.787 Got signal [signal:15(SIGTERM),sender_pid:31316,sender_uid:112,reason:0]. Exiting ... 31325:20190226:100043.788 Got signal [signal:15(SIGTERM),sender_pid:31316,sender_uid:112,reason:0]. Exiting ... 31347:20190226:100043.788 Got signal [signal:15(SIGTERM),sender_pid:31316,sender_uid:112,reason:0]. Exiting ... 31323:20190226:100043.790 Got signal [signal:15(SIGTERM),sender_pid:31316,sender_uid:112,reason:0]. Exiting ... 31327:20190226:100043.790 Got signal [signal:15(SIGTERM),sender_pid:31316,sender_uid:112,reason:0]. Exiting ... 31334:20190226:100043.792 Got signal [signal:15(SIGTERM),sender_pid:31316,sender_uid:112,reason:0]. Exiting ... 31330:20190226:100043.792 Got signal [signal:15(SIGTERM),sender_pid:31316,sender_uid:112,reason:0]. Exiting ... 31331:20190226:100043.797 Got signal [signal:15(SIGTERM),sender_pid:31316,sender_uid:112,reason:0]. Exiting ... 31333:20190226:100043.800 Got signal [signal:15(SIGTERM),sender_pid:31316,sender_uid:112,reason:0]. Exiting ... 31336:20190226:100043.802 Got signal [signal:15(SIGTERM),sender_pid:31316,sender_uid:112,reason:0]. Exiting ... 31340:20190226:100043.804 Got signal [signal:15(SIGTERM),sender_pid:31316,sender_uid:112,reason:0]. Exiting ... 31341:20190226:100043.806 Got signal [signal:15(SIGTERM),sender_pid:31316,sender_uid:112,reason:0]. Exiting ... 31342:20190226:100043.806 Got signal [signal:15(SIGTERM),sender_pid:31316,sender_uid:112,reason:0]. Exiting ... 31348:20190226:100043.807 Got signal [signal:15(SIGTERM),sender_pid:31316,sender_uid:112,reason:0]. Exiting ... 31337:20190226:100043.809 Got signal [signal:15(SIGTERM),sender_pid:31316,sender_uid:112,reason:0]. Exiting ... 31352:20190226:100043.809 Got signal [signal:15(SIGTERM),sender_pid:31316,sender_uid:112,reason:0]. Exiting ... 31335:20190226:100043.811 Got signal [signal:15(SIGTERM),sender_pid:31316,sender_uid:112,reason:0]. Exiting ... 31349:20190226:100043.811 Got signal [signal:15(SIGTERM),sender_pid:31316,sender_uid:112,reason:0]. Exiting ... 31329:20190226:100043.812 Got signal [signal:15(SIGTERM),sender_pid:31316,sender_uid:112,reason:0]. Exiting ... 31345:20190226:100043.813 Got signal [signal:15(SIGTERM),sender_pid:31316,sender_uid:112,reason:0]. Exiting ... 31344:20190226:100043.816 Got signal [signal:15(SIGTERM),sender_pid:31316,sender_uid:112,reason:0]. Exiting ... 31343:20190226:100043.816 Got signal [signal:15(SIGTERM),sender_pid:31316,sender_uid:112,reason:0]. Exiting ... 31326:20190226:100043.817 Got signal [signal:15(SIGTERM),sender_pid:31316,sender_uid:112,reason:0]. Exiting ... 31346:20190226:100043.818 Got signal [signal:15(SIGTERM),sender_pid:31316,sender_uid:112,reason:0]. Exiting ... 31339:20190226:100043.820 Got signal [signal:15(SIGTERM),sender_pid:31316,sender_uid:112,reason:0]. Exiting ... 31324:20190226:100043.822 Got signal [signal:15(SIGTERM),sender_pid:31316,sender_uid:112,reason:0]. Exiting ... 31316:20190226:100043.979 syncing history data... 31316:20190226:100043.979 syncing history data done 31316:20190226:100043.979 syncing trend data... 31316:20190226:100044.850 syncing trend data done 31316:20190226:100044.868 Zabbix Server stopped. Zabbix 4.0.4 (revision 89349). 28083:20190226:100054.911 Starting Zabbix Server. Zabbix 4.0.4 (revision 89349). 28083:20190226:100054.912 ****** Enabled features ****** 28083:20190226:100054.912 SNMP monitoring: YES 28083:20190226:100054.912 IPMI monitoring: YES 28083:20190226:100054.912 Web monitoring: YES 28083:20190226:100054.912 VMware monitoring: YES 28083:20190226:100054.912 SMTP authentication: YES 28083:20190226:100054.912 Jabber notifications: YES |
| Comment by Ilya Kruchinin [ 2019 Feb 26 ] |
|
@Edgar Could you please re-run your tests (to reproduce the bug) using the RAW payload file I have now provided as the one I provided originally was a copy-paste with incorrect line endings. |
| Comment by Glebs Ivanovskis [ 2019 Feb 26 ] |
|
Backtrace should be prior to that. Perhaps, your LogFileSize setting is too low and log file rotates too frequently. |
| Comment by Ilya Kruchinin [ 2019 Feb 26 ] |
|
@Glebs, the log file is over 1GB and it starts before the crash, followed by log level increase, waiting for the crash, then copying the log. I can assure you it was not rotated (during the test crash). It's simply not there (the backtrace).
-rw-r----- 1 zabbix zabbix 1345562503 Feb 26 10:50 zabbix_server.log -rw-rw-r-- 1 zabbix zabbix 13253978 Feb 26 10:00 zabbix_server.log.1 root@ip-172-22-222-109:/var/log/zabbix# grep -Ri 'backtrace' zabbix_server.log* root@ip-172-22-222-109:/var/log/zabbix# |
| Comment by Glebs Ivanovskis [ 2019 Feb 26 ] |
|
Try $ grep "Crashing" -A 100 ... |
| Comment by Ilya Kruchinin [ 2019 Feb 26 ] |
root@ip-172-22-222-109:/var/log/zabbix# grep -Ri 'crashing' zabbix_server* | wc -l 0 root@ip-172-22-222-109:/var/log/zabbix# ll zabbix_server.log* -rw-r----- 1 zabbix zabbix 1345565993 Feb 26 10:54 zabbix_server.log -rw-rw-r-- 1 zabbix zabbix 13253978 Feb 26 10:00 zabbix_server.log.1 |
| Comment by Ilya Kruchinin [ 2019 Feb 26 ] |
|
Looks like one of the subprocesses dies, and zabbix-server either kills itself (or is signalled by systemd to quit) without writing any "crashing" or "backtrace" to logs. |
| Comment by Ilya Kruchinin [ 2019 Feb 26 ] |
|
@Glebs, please see below for the PID you mentioned (the one that terminated) zabbix_server.log: 31350:20190226:100042.269 End of zbx_ipc_socket_read():SUCCEED zabbix_server.log: 31350:20190226:100042.269 In zbx_ipc_socket_write() zabbix_server.log: 31350:20190226:100042.269 End of zbx_ipc_socket_write():SUCCEED zabbix_server.log: 31350:20190226:100042.269 In zbx_ipc_socket_read() zabbix_server.log: 31350:20190226:100042.277 zbx_ipc_socket_read() code:2 size:70 data:2d 64 01 00 00 00 00 00 | 03 01 41 71 74 5c 0f 56 | cc 20 01 0b 00 00 00 33 | 39 31 35 37 36 38 35 30 | 33 00 01 03 03 47 ba 63 | e9 00 00 00 00 05 71 74 | 5c 06 ec 33 12 02 00 00 | 00 0a 01 00 00 00 00 01 | 02 00 00 00 38 00 zabbix_server.log: 31350:20190226:100042.277 End of zbx_ipc_socket_read():SUCCEED zabbix_server.log: 31350:20190226:100042.277 In zbx_ipc_socket_write() zabbix_server.log: 31350:20190226:100042.277 End of zbx_ipc_socket_write():SUCCEED zabbix_server.log: 31350:20190226:100042.277 In zbx_ipc_socket_read() zabbix_server.log: 31329:20190226:100042.343 fitted expression is: x = (33808384.000000) + (0.000000) * (5339.313502 + t) zabbix_server.log: 31350:20190226:100042.607 zbx_ipc_socket_read() code:2 size:69 data:3e c1 01 00 00 00 00 00 | 03 01 9e 73 74 5c 47 35 | e0 1a 01 0a 00 00 00 33 | 36 36 39 37 34 34 30 33 | 00 01 03 03 b1 95 de 15 | 00 00 00 00 62 73 74 5c | ec 7c 66 27 02 00 00 00 | 0a 01 00 00 00 00 01 02 | 00 00 00 38 00 zabbix_server.log: 31350:20190226:100042.607 End of zbx_ipc_socket_read():SUCCEED zabbix_server.log: 31350:20190226:100042.607 In zbx_ipc_socket_write() zabbix_server.log: 31350:20190226:100042.607 End of zbx_ipc_socket_write():SUCCEED zabbix_server.log: 31350:20190226:100042.607 In zbx_ipc_socket_read() zabbix_server.log: 31330:20190226:100042.635 1551134921.863581152 58.313500 zabbix_server.log: 31350:20190226:100042.774 zbx_ipc_socket_read() code:2 size:69 data:b9 6e 01 00 00 00 00 00 | 03 01 99 73 74 5c ad 27 | e2 21 01 0a 00 00 00 31 | 33 30 37 32 37 38 35 35 | 00 01 03 03 c3 bd ca 07 | 00 00 00 00 5d 73 74 5c | 7d 4d fd 1b 02 00 00 00 | 0a 01 00 00 00 00 01 02 | 00 00 00 38 00 zabbix_server.log: 31350:20190226:100042.774 End of zbx_ipc_socket_read():SUCCEED zabbix_server.log: 31350:20190226:100042.774 In zbx_ipc_socket_write() zabbix_server.log: 31350:20190226:100042.774 End of zbx_ipc_socket_write():SUCCEED zabbix_server.log: 31350:20190226:100042.774 In zbx_ipc_socket_read() zabbix_server.log: 31350:20190226:100043.046 zbx_ipc_socket_read() code:2 size:71 data:16 b8 01 00 00 00 00 00 | 03 01 9a 73 74 5c bb 64 | 29 0c 01 0c 00 00 00 35 | 33 31 31 35 31 38 31 39 | 30 35 00 01 03 03 6a df | e7 5d 0c 00 00 00 5e 73 | 74 5c e8 e3 e1 38 02 00 | 00 00 0a 01 00 00 00 00 | 01 02 00 00 00 38 00 zabbix_server.log: 31350:20190226:100043.046 End of zbx_ipc_socket_read():SUCCEED zabbix_server.log: 31350:20190226:100043.047 In zbx_ipc_socket_write() zabbix_server.log: 31350:20190226:100043.047 End of zbx_ipc_socket_write():SUCCEED zabbix_server.log: 31350:20190226:100043.047 In zbx_ipc_socket_read() zabbix_server.log: 31350:20190226:100043.528 zbx_ipc_socket_read() code:2 size:61 data:bd 97 01 00 00 00 00 00 | 03 01 41 71 74 5c 40 52 | b9 2a 01 02 00 00 00 30 | 00 01 03 03 00 00 00 00 | 00 00 00 00 05 71 74 5c | c8 8a 1e 17 02 00 00 00 | 0a 01 00 00 00 00 01 02 | 00 00 00 38 00 zabbix_server.log: 31350:20190226:100043.528 End of zbx_ipc_socket_read():SUCCEED zabbix_server.log: 31350:20190226:100043.528 In zbx_ipc_socket_write() zabbix_server.log: 31350:20190226:100043.528 End of zbx_ipc_socket_write():SUCCEED zabbix_server.log: 31350:20190226:100043.528 In zbx_ipc_socket_read() zabbix_server.log: 31350:20190226:100043.532 zbx_ipc_socket_read() code:2 size:61 data:15 9a 01 00 00 00 00 00 | 03 01 41 71 74 5c 16 6b | 27 2d 01 02 00 00 00 30 | 00 01 03 03 00 00 00 00 | 00 00 00 00 05 71 74 5c | d4 87 4d 1d 02 00 00 00 | 0a 01 00 00 00 00 01 02 | 00 00 00 38 00 zabbix_server.log: 31350:20190226:100043.532 End of zbx_ipc_socket_read():SUCCEED zabbix_server.log: 31350:20190226:100043.532 In zbx_ipc_socket_write() zabbix_server.log: 31350:20190226:100043.532 End of zbx_ipc_socket_write():SUCCEED zabbix_server.log: 31350:20190226:100043.532 In zbx_ipc_socket_read() zabbix_server.log: 31350:20190226:100043.540 zbx_ipc_socket_read() code:2 size:24529 data:19 09 02 00 00 00 00 00 | 04 01 41 71 74 5c 4f 82 | 37 2e 01 88 5f 00 00 7b | 22 63 6c 75 73 74 65 72 | 53 74 61 74 75 73 22 3a | 7b 22 72 6f 6c 6c 75 70 | 52 65 71 75 65 73 74 65 | 64 44 65 70 6c 6f 79 6d | 65 6e 74 53 74 61 74 65 | 22 3a 22 55 6e 6b 6e 6f | 77 6e 22 2c 22 68 72 65 | 66 22 3a 22 2f 61 70 69 | 2f 30 2e 35 2f 73 74 61 | 74 75 73 22 2c 22 6e 6f | 64 65 73 22 3a 5b 7b 22 | 72 6f 6c 6c 75 70 52 65 zabbix_server.log: 31350:20190226:100043.540 End of zbx_ipc_socket_read():SUCCEED zabbix_server.log: 31316:20190226:100043.778 One child process died (PID:31350,exitcode/signal:11). Exiting ... |
| Comment by Ilya Kruchinin [ 2019 Feb 26 ] |
|
I think it would be easier if @Edgar re-runs the tests with the "RAW" payload. This way he would be able to reproduce the bug. |
| Comment by Edgar Akhmetshin [ 2019 Feb 26 ] |
|
Hi! Zabbix 4.0.5 -> Proxy 4.0.5 -> Agent 4.0.4 + payload_raw.txt 21904:20190226:061400.538 zbx_ipc_socket_read() code:2 size:24533 data:cc 6f 00 00 00 00 00 00 | 04 01 07 bd 74 5c 72 59 | 8b 2c 01 8c 5f 00 00 7b | 22 63 6c 75 73 74 65 72 | 53 74 61 74 75 73 22 3a | 7b 22 72 6f 6c 6c 75 70 | 52 65 71 75 65 73 74 65 | 64 44 65 70 6c 6f 79 6d | 65 6e 74 53 74 61 74 65 | 22 3a 22 55 6e 6b 6e 6f | 77 6e 22 2c 22 68 72 65 | 66 22 3a 22 2f 61 70 69 | 2f 30 2e 35 2f 73 74 61 | 74 75 73 22 2c 22 6e 6f | 64 65 73 22 3a 5b 7b 22 | 72 6f 6c 6c 75 70 52 65 21904:20190226:061400.538 End of zbx_ipc_socket_read():SUCCEED 21862:20190226:061400.649 One child process died (PID:21904,exitcode/signal:11). Exiting ... zabbix_server [21862]: Error waiting for process with PID 21904: [10] No child processes
 21862:20190226:061400.649 One child process died (PID:21904,exitcode/signal:11). Exiting ...
 21862:20190226:061400.649 zbx_on_exit() called
 21873:20190226:061400.649 Got signal [signal:15(SIGTERM),sender_pid:21862,sender_uid:112,reason:0]. Exiting ...
 21881:20190226:061400.649 Got signal [signal:15(SIGTERM),sender_pid:21862,sender_uid:112,reason:0]. Exiting ...
 21882:20190226:061400.651 Got signal [signal:15(SIGTERM),sender_pid:21862,sender_uid:112,reason:0]. Exiting ...
 21880:20190226:061400.652 Got signal [signal:15(SIGTERM),sender_pid:21862,sender_uid:112,reason:0]. Exiting ...
 21884:20190226:061400.652 Got signal [signal:15(SIGTERM),sender_pid:21862,sender_uid:112,reason:0]. Exiting ...
 21891:20190226:061400.652 Got signal [signal:15(SIGTERM),sender_pid:21862,sender_uid:112,reason:0]. Exiting ...
 21866:20190226:061400.652 Got signal [signal:15(SIGTERM),sender_pid:21862,sender_uid:112,reason:0]. Exiting ...
 21896:20190226:061400.654 Got signal [signal:15(SIGTERM),sender_pid:21862,sender_uid:112,reason:0]. Exiting ...
 21897:20190226:061400.655 Got signal [signal:15(SIGTERM),sender_pid:21862,sender_uid:112,reason:0]. Exiting ...
 21867:20190226:061400.656 Got signal [signal:15(SIGTERM),sender_pid:21862,sender_uid:112,reason:0]. Exiting ...
 21893:20190226:061400.657 Got signal [signal:15(SIGTERM),sender_pid:21862,sender_uid:112,reason:0]. Exiting ...
 21868:20190226:061400.657 Got signal [signal:15(SIGTERM),sender_pid:21862,sender_uid:112,reason:0]. Exiting ...
 21895:20190226:061400.659 Got signal [signal:15(SIGTERM),sender_pid:21862,sender_uid:112,reason:0]. Exiting ...
 21869:20190226:061400.659 Got signal [signal:15(SIGTERM),sender_pid:21862,sender_uid:112,reason:0]. Exiting ...
 21876:20190226:061400.660 Got signal [signal:15(SIGTERM),sender_pid:21862,sender_uid:112,reason:0]. Exiting ...
 21870:20190226:061400.661 Got signal [signal:15(SIGTERM),sender_pid:21862,sender_uid:112,reason:0]. Exiting ...
 21888:20190226:061400.662 Got signal [signal:15(SIGTERM),sender_pid:21862,sender_uid:112,reason:0]. Exiting ...
 21871:20190226:061400.662 Got signal [signal:15(SIGTERM),sender_pid:21862,sender_uid:112,reason:0]. Exiting ...
 21892:20190226:061400.663 Got signal [signal:15(SIGTERM),sender_pid:21862,sender_uid:112,reason:0]. Exiting ...
 21872:20190226:061400.663 Got signal [signal:15(SIGTERM),sender_pid:21862,sender_uid:112,reason:0]. Exiting ...
 21874:20190226:061400.664 Got signal [signal:15(SIGTERM),sender_pid:21862,sender_uid:112,reason:0]. Exiting ...
 21875:20190226:061400.664 Got signal [signal:15(SIGTERM),sender_pid:21862,sender_uid:112,reason:0]. Exiting ...
 21877:20190226:061400.666 Got signal [signal:15(SIGTERM),sender_pid:21862,sender_uid:112,reason:0]. Exiting ...
 21878:20190226:061400.667 Got signal [signal:15(SIGTERM),sender_pid:21862,sender_uid:112,reason:0]. Exiting ...
 21883:20190226:061400.668 Got signal [signal:15(SIGTERM),sender_pid:21862,sender_uid:112,reason:0]. Exiting ...
 21885:20190226:061400.669 Got signal [signal:15(SIGTERM),sender_pid:21862,sender_uid:112,reason:0]. Exiting ...
 21886:20190226:061400.670 Got signal [signal:15(SIGTERM),sender_pid:21862,sender_uid:112,reason:0]. Exiting ...
 21887:20190226:061400.672 Got signal [signal:15(SIGTERM),sender_pid:21862,sender_uid:112,reason:0]. Exiting ...
 21889:20190226:061400.673 Got signal [signal:15(SIGTERM),sender_pid:21862,sender_uid:112,reason:0]. Exiting ...
 21903:20190226:061400.673 Got signal [signal:15(SIGTERM),sender_pid:21862,sender_uid:112,reason:0]. Exiting ...
 21894:20190226:061400.673 Got signal [signal:15(SIGTERM),sender_pid:21862,sender_uid:112,reason:0]. Exiting ...
 21906:20190226:061400.675 Got signal [signal:15(SIGTERM),sender_pid:21862,sender_uid:112,reason:0]. Exiting ...
 21890:20190226:061400.676 Got signal [signal:15(SIGTERM),sender_pid:21862,sender_uid:112,reason:0]. Exiting ...
 21901:20190226:061400.677 Got signal [signal:15(SIGTERM),sender_pid:21862,sender_uid:112,reason:0]. Exiting ...
 21902:20190226:061400.678 Got signal [signal:15(SIGTERM),sender_pid:21862,sender_uid:112,reason:0]. Exiting ...
zabbix_server [21862]: Error waiting for process with PID 21904: [10] No child processes
 21862:20190226:061400.680 In DBconnect() flag:1
 21862:20190226:061400.680 End of DBconnect():0
 21862:20190226:061400.680 In free_database_cache()
 21862:20190226:061400.680 In DCsync_all()
 21862:20190226:061400.680 In sync_history_cache_full() history_num:0
 21862:20190226:061400.681 syncing history data...
 21862:20190226:061400.681 syncing history data done
 21862:20190226:061400.681 End of sync_history_cache_full()
 21862:20190226:061400.681 In DCsync_trends() trends_num:0
 21862:20190226:061400.681 syncing trend data...
 21862:20190226:061400.681 query [txnlev:1] [begin;]
 21862:20190226:061400.681 query [txnlev:1] [commit;]
 21862:20190226:061400.681 syncing trend data done
 21862:20190226:061400.681 End of DCsync_trends()
 21862:20190226:061400.681 End of DCsync_all()
 21862:20190226:061400.681 End of free_database_cache()
 21862:20190226:061400.681 In free_configuration_cache()
 21862:20190226:061400.681 End of free_configuration_cache()
 21862:20190226:061400.681 In zbx_vc_destroy()
 21862:20190226:061400.681 End of zbx_vc_destroy()
 21862:20190226:061400.681 In zbx_vmware_destroy()
 21862:20190226:061400.681 End of zbx_vmware_destroy()
 21862:20190226:061400.681 In free_selfmon_collector() collector:0x7f2885a45000
 21862:20190226:061400.681 End of free_selfmon_collector()
 21862:20190226:061400.681 In zbx_unload_modules()
 21862:20190226:061400.681 End of zbx_unload_modules()
 21862:20190226:061400.681 Zabbix Server stopped. Zabbix 4.0.5 (revision 90164).
Regards, |
| Comment by Edgar Akhmetshin [ 2019 Feb 26 ] |
|
Log file attached: zabbix_server.log Regards, |
| Comment by Vladislavs Sokurenko [ 2019 Feb 26 ] |
|
Valgrind output: ==4918== Stack overflow in thread #1: can't grow stack to 0x1ffe801000 ==4918== Can't extend stack to 0x1ffe800f98 during signal delivery for thread 1: ==4918== no stack segment ==4918== ==4918== Process terminating with default action of signal 11 (SIGSEGV) ==4918== Access not within mapped region at address 0x1FFE800F98 ==4918== Stack overflow in thread #1: can't grow stack to 0x1ffe801000 ==4918== at 0x57F58D4: ??? (in /usr/lib64/libpcre.so.1.2.10) ==4918== If you believe this happened as a result of a stack ==4918== overflow in your program's main thread (unlikely but ==4918== possible), you can try to increase the size of the ==4918== main thread stack using the --main-stacksize= flag. ==4918== The main thread stack size used in this run was 8388608. ==4918== Stack overflow in thread #1: can't grow stack to 0x1ffe801000 ==4918== ==4918== Process terminating with default action of signal 11 (SIGSEGV) ==4918== Access not within mapped region at address 0x1FFE801E58 ==4918== Stack overflow in thread #1: can't grow stack to 0x1ffe801000 ==4918== at 0x482E14D: _vgnU_freeres (vg_preloaded.c:59) ==4918== If you believe this happened as a result of a stack ==4918== overflow in your program's main thread (unlikely but ==4918== possible), you can try to increase the size of the ==4918== main thread stack using the --main-stacksize= flag. ==4918== The main thread stack size used in this run was 8388608. |
| Comment by Glebs Ivanovskis [ 2019 Feb 26 ] |
|
Just curious, can you test this pattern too? node2(?:.|\n)*?rollupStatus": "(.*)"\n I guess the problem with original pattern was that there was a capturing group with non-greedy quantifier (.|\n)*?. Since it is non-greedy quantifier, it is subject to something called "backtracking"; and since the group inside is capturing, regexp engine needs to track its current contents all the time. If the implementation involves recursion and input text is long enough you may easily get a stack overflow. |
| Comment by Edgar Akhmetshin [ 2019 Feb 26 ] |
|
Glebs, The same behaviour, still crashing. Regards, |
| Comment by Ilya Kruchinin [ 2019 Feb 26 ] |
|
Glens, doesn't the question mark after * make it greedy? I mean (charset)*? is a greedy regex, matching only the first group, ignoring the rest, right? |
| Comment by Ilya Kruchinin [ 2019 Feb 26 ] |
|
Sorry, proceeding, not following. Both parts being greedy |
| Comment by Vladislavs Sokurenko [ 2019 Feb 26 ] |
|
Did issue start after some specific version ? Does this command help ? ulimit -s 16384 |
| Comment by Edgar Akhmetshin [ 2019 Feb 26 ] |
|
Vladislavs, Stack size suggested a little bit small, Zabbix server unable to start if you set this value through systemctl edit zabbix-server: [Service] LimitSTACK=infinity But value infinity solved crashing. Regards, |
| Comment by Glebs Ivanovskis [ 2019 Feb 26 ] |
Thank you, edgar.akhmetshin!
"Ignoring the rest" doesn't sound "greedy" to me. |
| Comment by Glebs Ivanovskis [ 2019 Feb 26 ] |
|
man pcrestack provides some useful insights, particularly:
Zabbix currently sets the recursion limit to 1000000, which is a bit optimistic and does not really protect against stack overflows. regex101.com claims that original pattern with payload_raw.txt |
| Comment by Vladislavs Sokurenko [ 2019 Feb 26 ] |
|
could you please also try pcretest program and see if it works ? For me it's same behavior as in Zabbix server ==192640== Stack overflow in thread #1: can't grow stack to 0x1ffe801000 ==192640== ==192640== Process terminating with default action of signal 11 (SIGSEGV): dumping core ==192640== Access not within mapped region at address 0x1FFE801FF8 ==192640== Stack overflow in thread #1: can't grow stack to 0x1ffe801000 ==192640== at 0x48D28CC: ??? (in /usr/lib64/libpcre.so.1.2.10) ==192640== If you believe this happened as a result of a stack ==192640== overflow in your program's main thread (unlikely but ==192640== possible), you can try to increase the size of the ==192640== main thread stack using the --main-stacksize= flag. ==192640== The main thread stack size used in this run was 8388608. ==192640== Stack overflow in thread #1: can't grow stack to 0x1ffe801000 ==192640== ==192640== Process terminating with default action of signal 11 (SIGSEGV) ==192640== Access not within mapped region at address 0x1FFE801FF0 ==192640== Stack overflow in thread #1: can't grow stack to 0x1ffe801000 ==192640== at 0x482E14D: _vgnU_freeres (vg_preloaded.c:59) ==192640== If you believe this happened as a result of a stack ==192640== overflow in your program's main thread (unlikely but ==192640== possible), you can try to increase the size of the ==192640== main thread stack using the --main-stacksize= flag. ==192640== The main thread stack size used in this run was 8388608. ==192640== ==192640== HEAP SUMMARY: ==192640== in use at exit: 390,963 bytes in 232 blocks ==192640== total heap usage: 1,664 allocs, 1,432 frees, 1,698,163 bytes allocated ==192640== ==192640== LEAK SUMMARY: ==192640== definitely lost: 0 bytes in 0 blocks ==192640== indirectly lost: 0 bytes in 0 blocks ==192640== possibly lost: 0 bytes in 0 blocks ==192640== still reachable: 390,963 bytes in 232 blocks ==192640== suppressed: 0 bytes in 0 blocks ==192640== Reachable blocks (those to which a pointer was found) are not shown. ==192640== To see them, rerun with: --leak-check=full --show-leak-kinds=all ==192640== ==192640== For counts of detected and suppressed errors, rerun with: -v ==192640== ERROR SUMMARY: 0 errors from 0 contexts (suppressed: 0 from 0) Segmentation fault (core dumped) |
| Comment by Vladislavs Sokurenko [ 2019 Feb 26 ] |
|
Also possible workaround: node2[[:ascii:]]*?rollupStatus": "(.*)"\n ((?s)node2.*?)rollupStatus": "(.*)"\n (?s)node2.*?rollupStatus": "([^\n]*)"\n |
| Comment by Vladislavs Sokurenko [ 2019 Feb 26 ] |
|
It looks like current recursion limit is 480 megabytes. It's up to user to ensure that there is enough memory for zabbix server to run so I suggest documenting this |
| Comment by Vladislavs Sokurenko [ 2019 Feb 26 ] |
|
(1) [D] Should add a warning here martins-v RESOLVED vso CLOSED |
| Comment by Glebs Ivanovskis [ 2019 May 09 ] |
|
There is no publicly visible comment regarding documentation parts which were updated in the scope of this ticket. |
| Comment by Vladislavs Sokurenko [ 2019 May 09 ] |
|
Should be visible now. |
| Comment by Glebs Ivanovskis [ 2019 May 09 ] |
|
Thanks! |