[ZBX-15731] history write cache abnormal Created: 2019 Feb 27 Updated: 2019 Mar 15 Resolved: 2019 Mar 15 |
|
| Status: | Closed |
| Project: | ZABBIX BUGS AND ISSUES |
| Component/s: | Server (S) |
| Affects Version/s: | 4.0.4 |
| Fix Version/s: | None |
| Type: | Problem report | Priority: | Critical |
| Reporter: | 岳青 | Assignee: | Aigars Kadikis |
| Resolution: | Fixed | Votes: | 0 |
| Labels: | None | ||
| Remaining Estimate: | Not Specified | ||
| Time Spent: | Not Specified | ||
| Original Estimate: | Not Specified | ||
| Environment: |
Zabbix version: |
||
| Attachments: |
|
| Description |
|
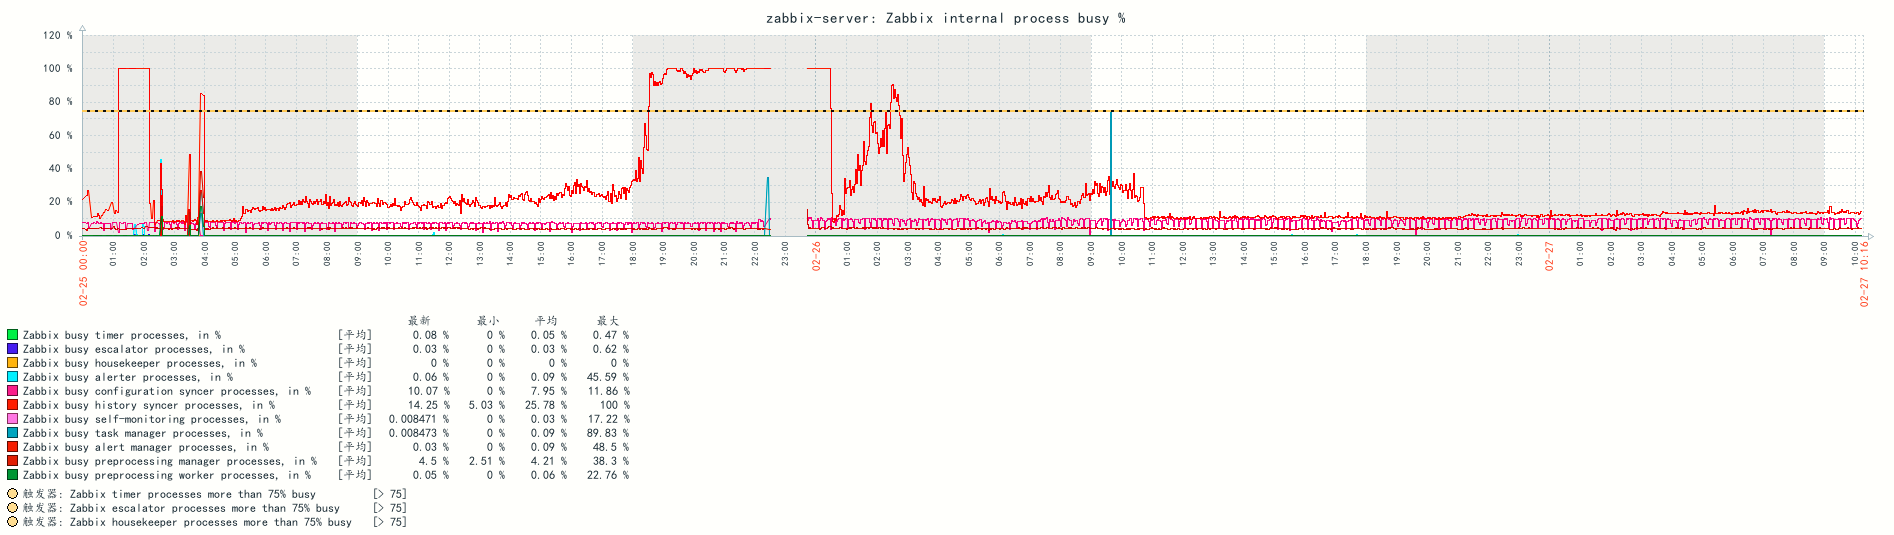
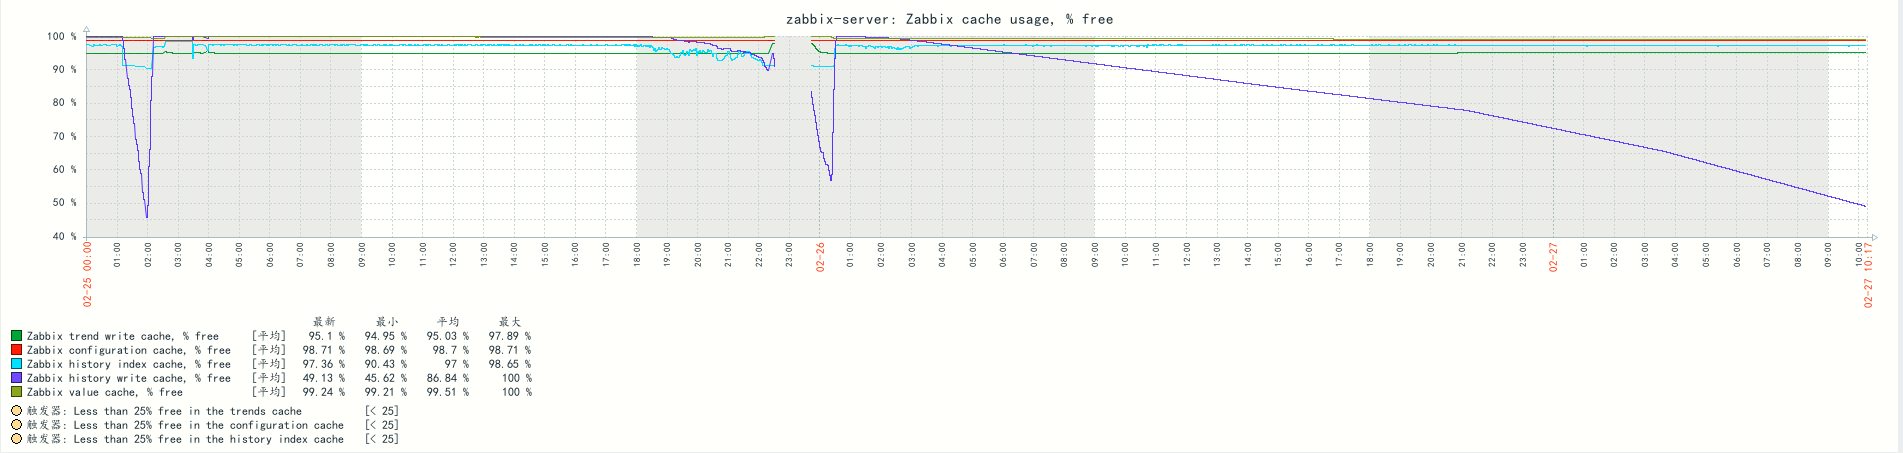
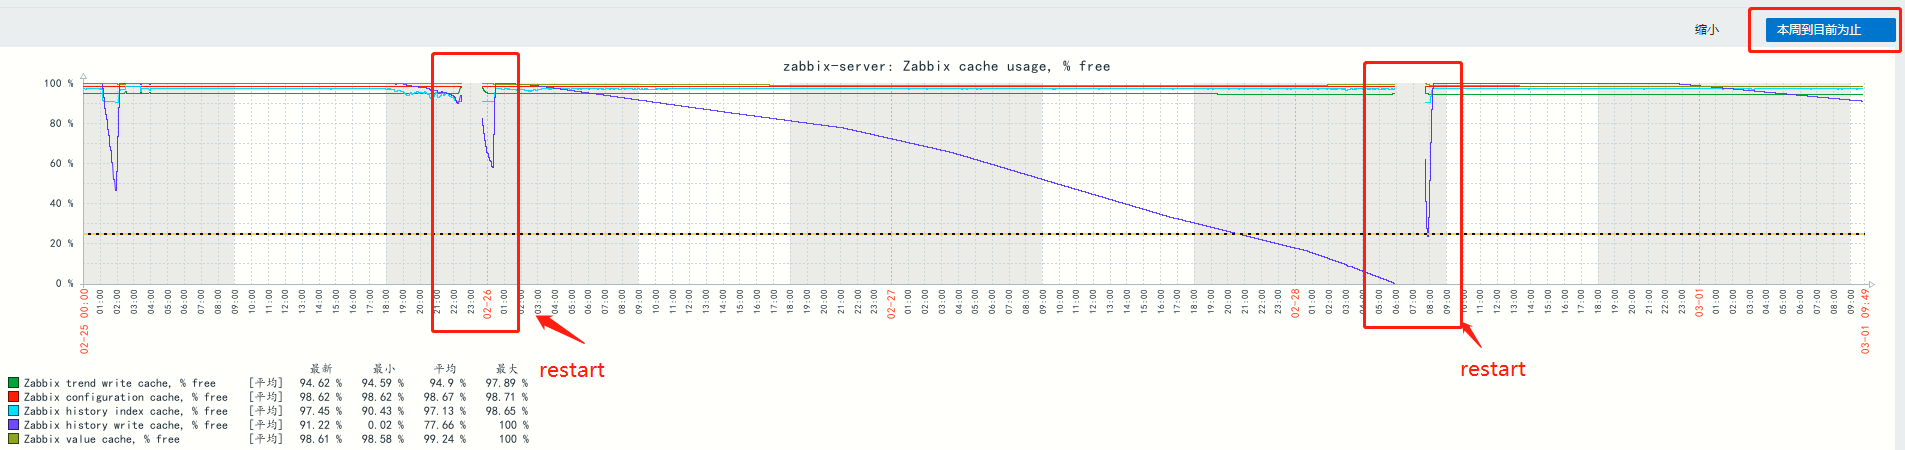
Hi, After the upgraded version, the history write cache parameter is abnormal, causing the web interface data loading delay, and the cache is getting lower and lower. zabbix_server.conf config ListenPort=10051
links https://support.zabbix.com/browse/ZBX-15662 |
| Comments |
| Comment by Aigars Kadikis [ 2019 Feb 27 ] |
|
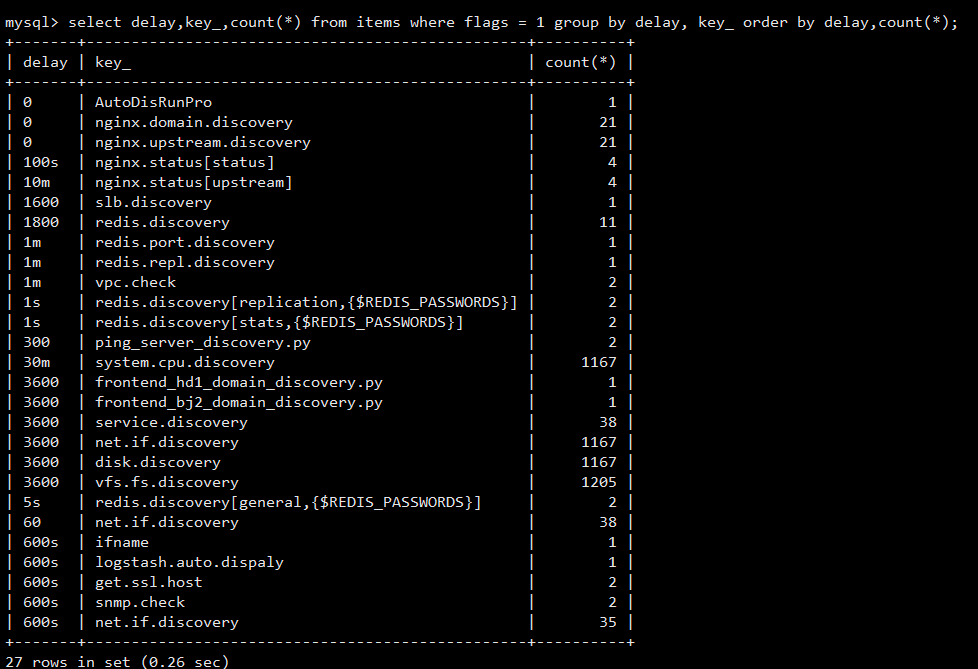
Hello! Please recheck if you got any frequent LLD rules: SELECT count(*),delay from items where flags = 1 GROUP BY delay ORDER BY count(*); This will show more precise info which discovery key is executing quite frequently. select delay,key_,count(*) from items where flags = 1 group by delay, key_ order by delay,count(*); Please look if you got rules installed to execute every 30s, 1m. Try to increase the time for those. Regards, |
| Comment by 岳青 [ 2019 Feb 28 ] |
|
Hi, This is the result of my inquiry. The monitoring items starting with redis are not applicable to the specific host, but the monitoring template of the co rresponding service is imported.
|
| Comment by 岳青 [ 2019 Feb 28 ] |
|
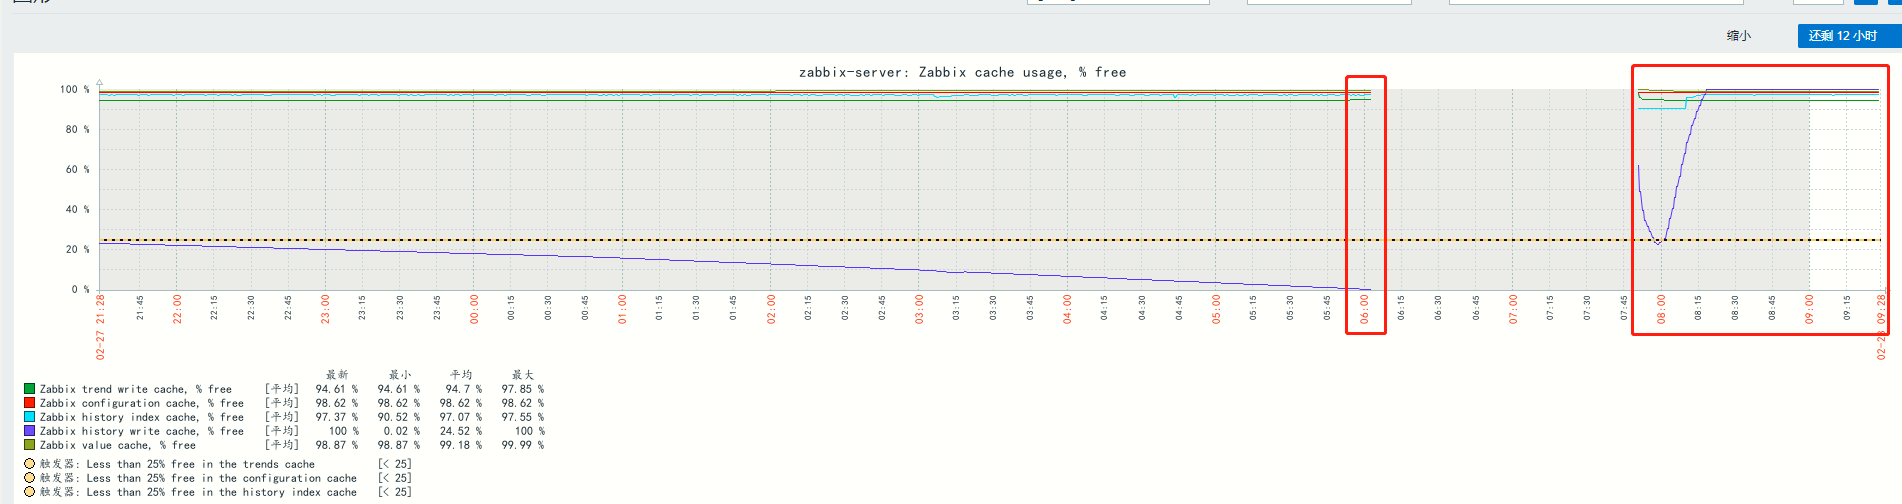
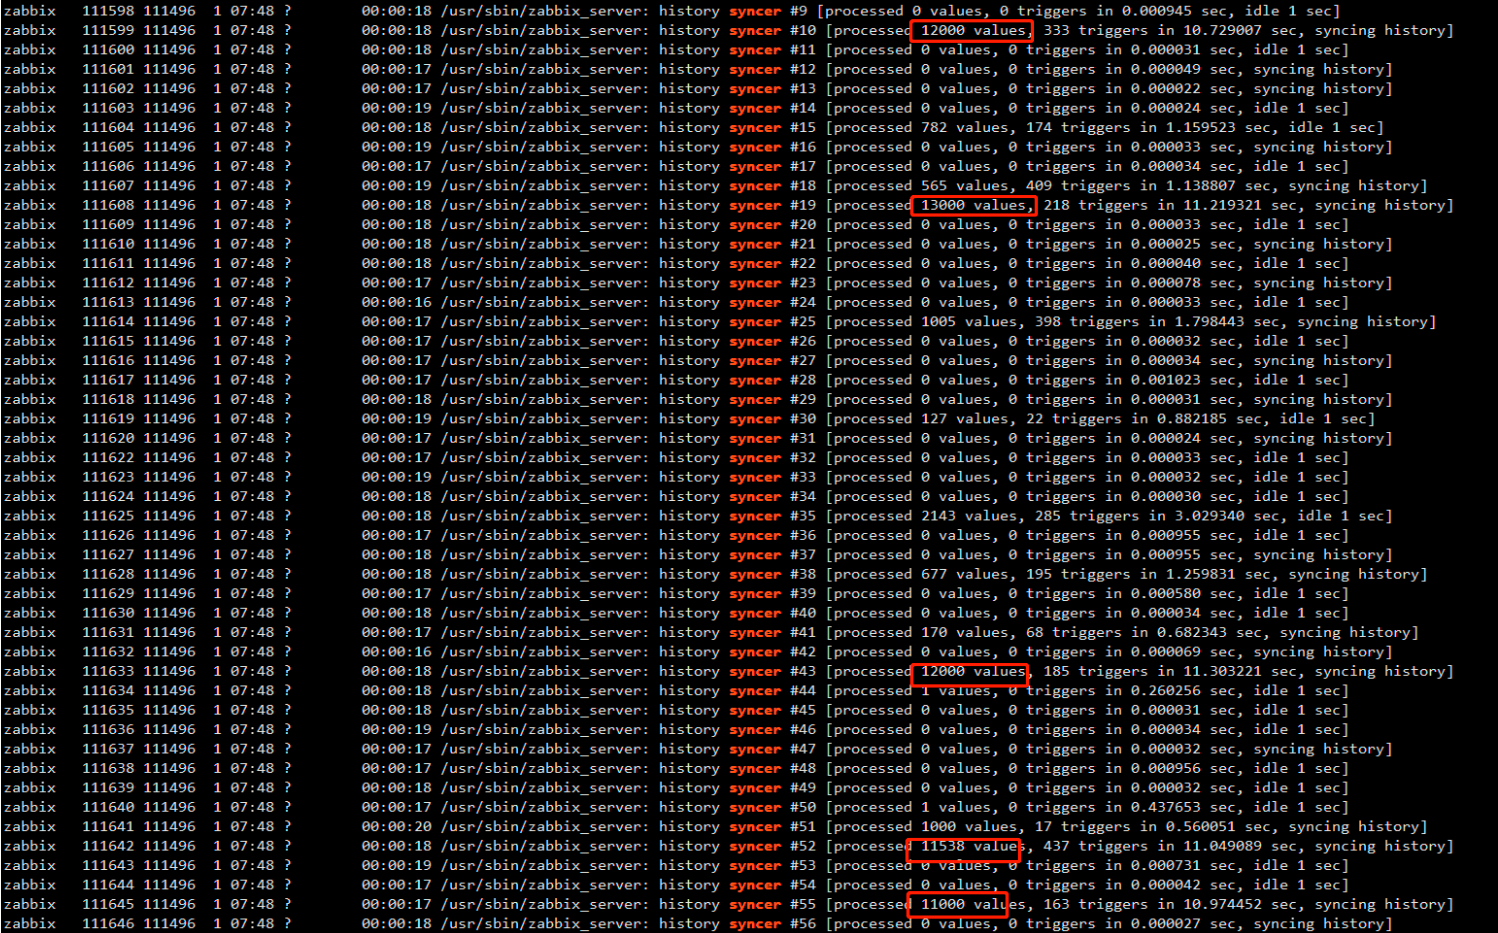
This is the state of the data synchronization process during data recovery.
|
| Comment by 岳青 [ 2019 Mar 01 ] |
|
|
| Comment by Glebs Ivanovskis [ 2019 Mar 01 ] |
|
History index cache (it stores information about items in history cache) usage stays almost constant during the problem, but history write cache (it stores values in history cache) usage is growing. I think you have a few items with lots and lots of values. Zabbix isn't very good at handling this situation, as you see in process titles, some of history syncers are barely working, some are even idling, while most of the work is done by very few of them. If you can access your database directly, try to figure out which items have so many values. Query for that should look something like: select itemid,count(*) as count from history where start_time<=clock and clock<=end_time; This may be a heavy query, so choose start_time and end_time wisely. Also do this query for history_uint, history_str, history_text and history_log. |
| Comment by 岳青 [ 2019 Mar 01 ] |
|
Hi, The current historical data is only written to the index of elasticsearch and is not written to the relational database. But the problem arises from the use of elasticsearch as a historical data source from my reference to the official website documentation manual. |
| Comment by Glebs Ivanovskis [ 2019 Mar 01 ] |
|
Sorry, I'm not that familiar with Elasticsearch. Hopefully, you got the idea where to look. At this point there is no indication of a bug in Zabbix. |
| Comment by Aigars Kadikis [ 2019 Mar 05 ] |
|
Regarding screen Let us know does it solve the issue. |
| Comment by 岳青 [ 2019 Mar 11 ] |
|
Hi, I am sorry, I did not respond in time. I have rewritten the data source into the relational database, temporarily stopping the writing of historical data into the elasticsearch index. Now the problem has been solved. |
| Comment by Aigars Kadikis [ 2019 Mar 15 ] |
|
Thank you very much for explaining the root cause. Appreciate the comeback. |