[ZBX-15747] Possible memory leak with ODBC Created: 2019 Mar 01 Updated: 2026 Apr 14 Resolved: 2019 Apr 15 |
|
| Status: | Closed |
| Project: | ZABBIX BUGS AND ISSUES |
| Component/s: | Server (S) |
| Affects Version/s: | 4.0.4 |
| Fix Version/s: | None |
| Type: | Incident report | Priority: | Major |
| Reporter: | Hans Bornich | Assignee: | Andris Mednis |
| Resolution: | Commercial support required | Votes: | 0 |
| Labels: | None | ||
| Remaining Estimate: | Not Specified | ||
| Time Spent: | Not Specified | ||
| Original Estimate: | Not Specified | ||
| Environment: |
Centos 7 |
||
| Attachments: |
|
| Team: | |
| Sprint: | Sprint 51 (Apr 2019) |
| Description |
|
We're running a Zabbix proof of concept with a single server. Poller processes that use ODBC will increase steadily in memory usage until the server runs out. UnixODBC version 2.3.7 (upgraded from 2.3.1 that was part of Centos 7). IBM i Access ODBC driver 1.1.0.11 (latest). Number of db.odbc items is almost steady, so it looks like every odbc call eats up some memory that isn't released. I tried to open a consulting request, but they ask that I open a bug report because they suspect a memory leak in the zabbix code. What can I do to help sort this out? |
| Comments |
| Comment by Dmitrijs Lamberts (Inactive) [ 2019 Mar 01 ] |
|
Hello Hans, Please attach screenshot with top output. |
| Comment by Hans Bornich [ 2019 Mar 01 ] |
|
I started out with an older version (1.1.0.9) that showed the same behaviour. I have also opened a PMR with IBM to investigate possible memory leak in the ODBC driver - no news from that so far. I tried to remove some of the db.odbc items (left over from low level discovery items that are no longer relevant). After that I see the drop flatten off, but it will still drop steadily - indicating to me that it is indeed some memory per odbc call that is left behind. Please see attachments.
|
| Comment by Andris Mednis [ 2019 Mar 01 ] |
|
As this is a very small Zabbix instance, could it be run under Valgrind for a few minutes? That could be the easiest way to find memory leak. Example: $ valgrind -v --tool=memcheck --leak-check=full --trace-children=yes --track-origins=yes --time-stamp=yes --max-stackframe=3475144 \
--log-file=/home/zabbix/tmp/zabbix_server_%p --leak-resolution=high --show-leak-kinds=all zabbix_server -c /home/zabbix/zabbix_server.conf
|
| Comment by Glebs Ivanovskis [ 2019 Mar 02 ] |
|
How many poller processes do you have? How many ODBC datasources are you querying? Due to connection pooling on UnixODBC side and the fact that Zabbix does not allocate specific pollers for specific datasources, every poller will eventually have a pool of connections to all datasources you have. Until that happens allocations will be happening and it may look like a memory leak. |
| Comment by Hans Bornich [ 2019 Mar 04 ] |
|
HI, I try to run valgrind as an admin user but I get access denied on reading the config file, access path /var/run/zabbix etc. If I try to sudo the command I get an error that zabbix cannot run as root. My admin user is member of the wheel group. I also tried to put it in the zabbix group. What am I doing wrong? Thanks... |
| Comment by Dmitrijs Lamberts (Inactive) [ 2019 Mar 04 ] |
|
Do you have SELinux enabled? |
| Comment by Hans Bornich [ 2019 Mar 04 ] |
|
SELinux is disabled |
| Comment by Hans Bornich [ 2019 Mar 04 ] |
|
@Glebs: At this point we have about 15 ODBC datasources, will end up with around 50. I ran into pollers being too busy earlier so I increased to 50 which is probably too much at this point. Each datasource will have a dynamic amount of db items, probably between 5 and 50. |
| Comment by Andris Mednis [ 2019 Mar 04 ] |
|
Why not run Valgrind as zabbix user? |
| Comment by Hans Bornich [ 2019 Mar 04 ] |
|
(edit: sorry about the formatting): Do you mean like this: {{sudo -H -u zabbix valgrind -v --tool=memcheck --leak-check=full --trace-children=yes --track-origins=yes --time-stamp=yes --max-stackframe=3475144 }} It started but ran very slow - causing many alerts (because of timeouts I think). The server ended up dying with: {{ 40201:20190304:115014.189 One child process died (PID:40251,exitcode/signal:9). Exiting ...}} Is there perhaps a way to only start the poller processes with valgrind?
|
| Comment by Glebs Ivanovskis [ 2019 Mar 04 ] |
|
You can install Zabbix proxy on the same system, move one ODBC check to proxy and run proxy with Valgrind. It won't affect the performance of Zabbix server and should be enough to catch the memory leak if there is one. Proxy shares a lot of code with server. |
| Comment by Andris Mednis [ 2019 Mar 04 ] |
|
Not that small instance if it cannot run under Valgrind. Glebs advice could help. |
| Comment by Hans Bornich [ 2019 Mar 05 ] |
|
I already had a proxy with only 1 host (no db checks - and memory usage a flat horizontal line). I activated a few db checks on that host and saw a slight steady memory drop. After a few hours I then started it with valgrind: sudo -H -u zabbix valgrind -v --tool=memcheck --leak-check=full --trace-children=yes --track-origins=yes --time-stamp=yes --max-stackframe=3475144 I let it run for some hours and ended with sudo pkill -u zabbix And searched the logs with sudo grep -rnw '/var/log/zabbix/' -e 'definitely lost' I see quite a few lines like this: /var/log/zabbix/zabbix_proxy_35187:2640:==00:00:00:03.624 35187== 59 bytes in 1 blocks are definitely lost in loss record 261 of 292 I'm attaching the logs for the poller threads.valgrind_proxy.tar.gz Would this also reveal a memory leak in the odbc driver? |
| Comment by Glebs Ivanovskis [ 2019 Mar 05 ] |
|
Well... ==00:05:19:16.470 28550== LEAK SUMMARY: ==00:05:19:16.470 28550== definitely lost: 0 bytes in 0 blocks ==00:05:19:16.470 28550== indirectly lost: 0 bytes in 0 blocks ==00:05:19:16.470 28550== possibly lost: 0 bytes in 0 blocks ==00:05:19:16.470 28550== still reachable: 892,231 bytes in 15,056 blocks ==00:05:19:16.470 28550== suppressed: 0 bytes in 0 blocks Was that a poller? /var/log/zabbix/zabbix_proxy_35187:2640:==00:00:00:03.624 35187== 59 bytes in 1 blocks are definitely lost in loss record 261 of 292
Yes, Valgrind tracks all allocations. |
| Comment by Hans Bornich [ 2019 Mar 05 ] |
|
Hmm yes it seems the pollers are not leaking. Some other examples: /var/log/zabbix/zabbix_proxy_46518:1216:==00:00:00:02.751 46518== 24 bytes in 1 blocks are definitely lost in loss record 124 of 285 Attaching the logs. Looks like pingers.
|
| Comment by Glebs Ivanovskis [ 2019 Mar 06 ] |
|
It reports leaks in /usr/bin/bash |
| Comment by Hans Bornich [ 2019 Mar 06 ] |
|
OK. Thanks for checking. If this also rules out the ODBC driver I should close the ticket I have open with IBM, do you agree? Any idea how to find the cause of the problem on the server then? I have lowered the number of pollers to 20, just to see if the behaviour changes. |
| Comment by Glebs Ivanovskis [ 2019 Mar 06 ] |
|
Let's do the following experiment. If you restart the proxy with a different number of poller processes (StartPollers=5, =10, =20, =50, etc.), will you see the changes in how quickly available memory disappears? If there is the same number of ODBC items, same intervals, same amount of data gathered, etc. then the decrease should not depend on the number of pollers. If my wild guess about connection pooling is right, then more poller processes will "leak" memory faster since every one of them does its independent pooling. By the way, pooling can be switched off in UnixODBC settings (in odbcinst.ini file, per driver). You can try it on server in the meantime. |
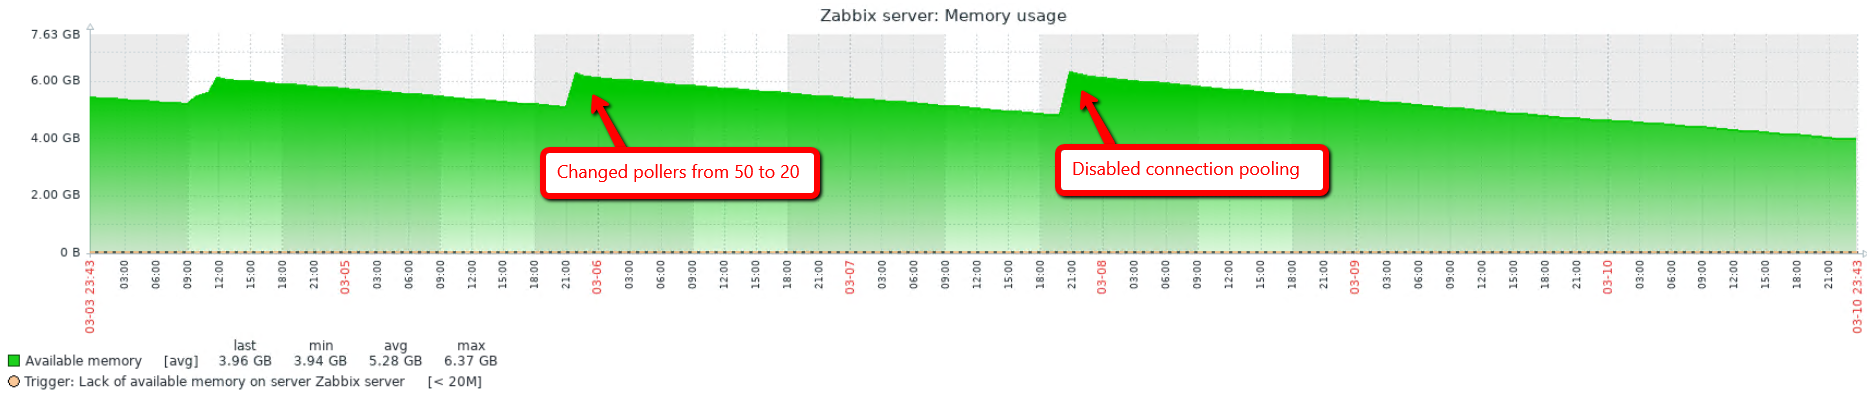
| Comment by Hans Bornich [ 2019 Mar 11 ] |
|
I changed the number of pollers from 50 to 20 and rebooted the server. The line still looks the same, please see attachment. I then disabled connection pooling and rebooted the server.
odbcinst.ini after the change: odbcinst.ini I have attached the first screen of ps aux --sort -rss | more
|
| Comment by Hans Bornich [ 2019 Mar 11 ] |
|
Here is a fresh snapshot of ps aux --sort -rss |
| Comment by Glebs Ivanovskis [ 2019 Mar 12 ] |
|
Looks like my guess about pooling isn't correct. Could you repeat Valgrind run? |
| Comment by Hans Bornich [ 2019 Mar 16 ] |
|
I can't run valgrind on the server (it can't handle the extra load I think). On the proxy I only have access to one host at present (network topology). Are there alternative ways of investigating on the server you think? |
| Comment by Glebs Ivanovskis [ 2019 Mar 16 ] |
|
You can run a proxy on the same machine as server, just make sure they don't compete for the same listening port, log file, pid file, etc. Or even a separate Zabbix server with it's own database and frontend. I guess your system will handle a small Zabbix server under Valgrind. |
| Comment by Hans Bornich [ 2019 Mar 26 ] |
|
I haven't had the time to setup the proxy on the server and move over some hosts. However I got an update from IBM that wanted some pmap output. I see this at the top of pmap -x on poller #1: Address Kbytes RSS Dirty Mode Mapping 0000557cca345000 2276 732 0 r-x-- zabbix_server_mysql 0000557cca77d000 428 428 428 r---- zabbix_server_mysql 0000557cca7e8000 44 44 44 rw--- zabbix_server_mysql 0000557cca7f3000 32 20 20 rw--- [ anon ] 0000557ccb245000 132 120 120 rw--- [ anon ] 0000557ccb266000 292 244 244 rw--- [ anon ] 0000557ccb2af000 44976 44852 44852 rw--- [ anon ] 00007f9a67c7e000 2848 2636 2636 rw--- [ anon ] And 15 minutes later: Address Kbytes RSS Dirty Mode Mapping 0000557cca345000 2276 732 0 r-x-- zabbix_server_mysql 0000557cca77d000 428 428 428 r---- zabbix_server_mysql 0000557cca7e8000 44 44 44 rw--- zabbix_server_mysql 0000557cca7f3000 32 20 20 rw--- [ anon ] 0000557ccb245000 132 120 120 rw--- [ anon ] 0000557ccb266000 292 244 244 rw--- [ anon ] 0000557ccb2af000 45372 45248 45248 rw--- [ anon ] 00007f9a67c7e000 2848 2656 2656 rw--- [ anon ] Does the increase in the anon line indicate something to you? Thought I'd pass this on. |
| Comment by Andris Mednis [ 2019 Mar 26 ] |
|
Yes, growing 'anon' could be a memory leak, but you need to observe a longer interval - does its average value grows over time. |
| Comment by Hans Bornich [ 2019 Mar 26 ] |
|
about 5 hours more: 4256: /usr/sbin/zabbix_server: poller #1 [got 0 values in 0.000013 sec, idle 1 sec] Address Kbytes RSS Dirty Mode Mapping 0000557cca345000 2276 732 0 r-x-- zabbix_server_mysql 0000557cca77d000 428 428 428 r---- zabbix_server_mysql 0000557cca7e8000 44 44 44 rw--- zabbix_server_mysql 0000557cca7f3000 32 20 20 rw--- [ anon ] 0000557ccb245000 132 120 120 rw--- [ anon ] 0000557ccb266000 292 244 244 rw--- [ anon ] 0000557ccb2af000 50124 49996 49996 rw--- [ anon ] 00007f9a6787d000 4100 3596 3596 rw--- [ anon ] 00007f9a68047000 60 8 0 r-x-- libbz2.so.1.0.6 00007f9a68056000 2044 0 0 ----- libbz2.so.1.0.6 00007f9a68255000 4 4 4 r---- libbz2.so.1.0.6 |
| Comment by Hans Bornich [ 2019 Mar 27 ] |
|
Again this morning (10 hours since last check): 4256: /usr/sbin/zabbix_server: poller #1 [got 0 values in 0.000011 sec, idle 1 sec] Address Kbytes RSS Dirty Mode Mapping 0000557cca345000 2276 732 0 r-x-- zabbix_server_mysql 0000557cca77d000 428 428 428 r---- zabbix_server_mysql 0000557cca7e8000 44 44 44 rw--- zabbix_server_mysql 0000557cca7f3000 32 20 20 rw--- [ anon ] 0000557ccb245000 132 120 120 rw--- [ anon ] 0000557ccb266000 292 244 244 rw--- [ anon ] 0000557ccb2af000 60816 60736 60736 rw--- [ anon ] 00007f9a6787d000 4100 3596 3596 rw--- [ anon ] 00007f9a68047000 60 8 0 r-x-- libbz2.so.1.0.6 |
| Comment by Andris Mednis [ 2019 Mar 27 ] |
|
Can you make little modifications to Zabbix source code and recompile? |
| Comment by Hans Bornich [ 2019 Mar 27 ] |
|
I have no experience doing that sorry. Is it possible to describe what I should do? We can install what we need on the box. |
| Comment by Hans Bornich [ 2019 Mar 29 ] |
|
Hi, I got this reply from IBM: Address Kbytes RSS Dirty Mode Mapping indicates that this is anonymous memory allocation. The developer wrote a test which created 1000 threads,
Based on our investigation it does not appear to be a memory More than likely there is a memory leak somewhere else |
| Comment by Glebs Ivanovskis [ 2019 Mar 29 ] |
Funny enough, this is what we saw with Zabbix as well. Dear andris, do you recall "minimal ODBC code"? Maybe you can share it with hab and provide instructions how to compile and run it. I guess it will be easier than setting up a proxy. And maybe Valgrind will be able to find something. |
| Comment by Andris Mednis [ 2019 Mar 29 ] |
|
Hi! Did you try to disable ODBC checks (individual items or group of items) to see if memory leak continues ? |
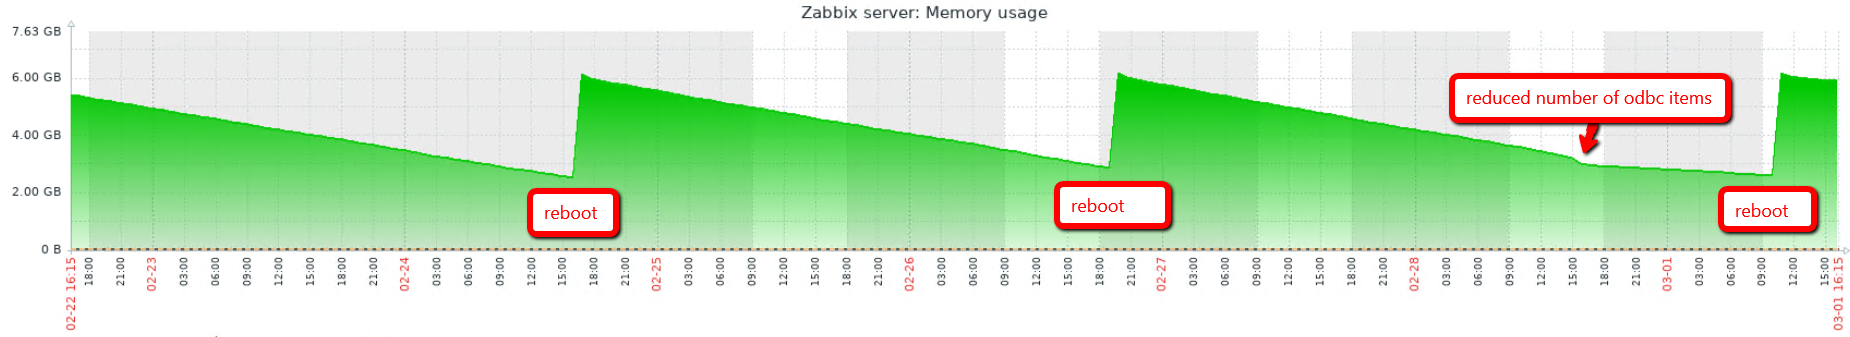
| Comment by Glebs Ivanovskis [ 2019 Mar 29 ] |
|
Memory leak slows down when ODBC item count is reduced: |
| Comment by Vladislavs Sokurenko [ 2019 Mar 29 ] |
|
Does disabling unixODBC checks make leak go away ? |
| Comment by Hans Bornich [ 2019 Mar 29 ] |
|
Hi Vladislavs, |
| Comment by Vladislavs Sokurenko [ 2019 Mar 29 ] |
|
Yes, you could try that, to rule out unixODBC. After that if it still unixODBC then you could move just one unixODBC check to new Zabbix proxy and see if it leaks or not and run with valgrind, would be nice to know if it's all unixODBC checks or only those that are using IBM driver. If it's IBM driver checks that leak would be nice to know if all of them leak or some specific queries. |
| Comment by Hans Bornich [ 2019 Mar 29 ] |
|
OK I'll rename the file and reboot the server. |
| Comment by Andris Mednis [ 2019 Mar 29 ] |
|
As proposed by cyclone, I attached his odbcmin.c Compile it like $ gcc -Wall -Wextra -lodbc -o odbcmin odbcmin.c Run it like $ printf "ORATEST\nyour_db_username\nyour_db_password\nselect 123 from dual;\n" | ./odbcmin DSN: Username: Pasword: Query: column number:1 column type:1 len:3 MAX_STRING_LEN:2048 buffer:'123' Adjust DSN, Username, Password and Query according to your environment in the "printf" command above. $ printf "ORATEST\nandris\nsecret_password\nselect 123 from dual;\n" | valgrind -v --tool=memcheck --leak-check=full --trace-children=yes --track-origins=yes --time-stamp=yes --log-file=/tmp/odbcmin_%p --leak-resolution=high --show-leak-kinds=all ./odbcmin Find Valgrind's output file in /tmp, compress it with gzip, like $ gzip /tmp/odbcmin_9629 Upload it (odbcmin_9629.gz) to https://support.zabbix.com/browse/ZBX-15747 as attachment. |
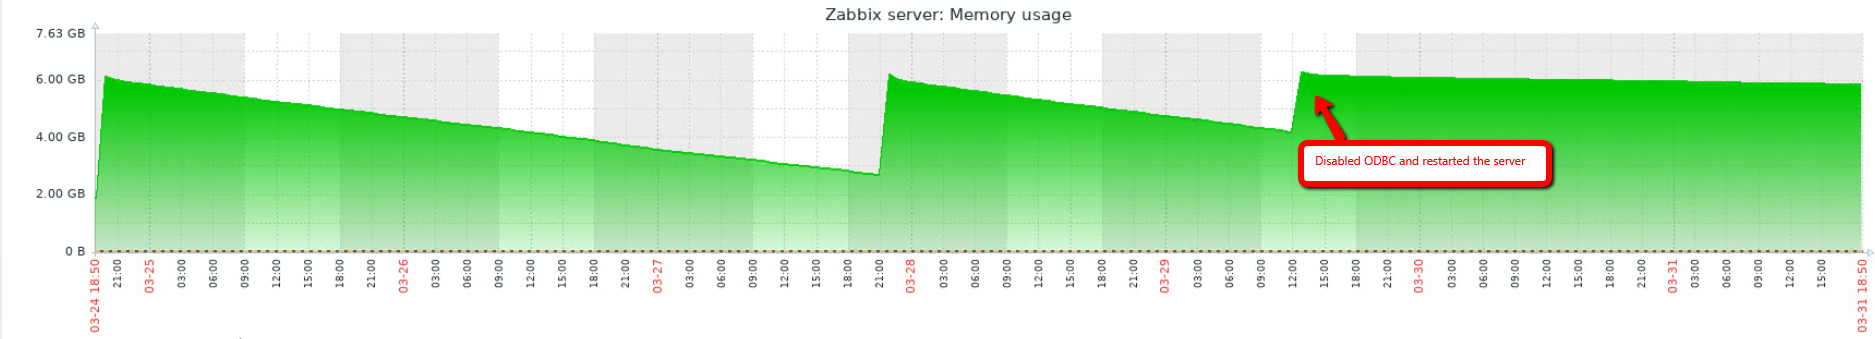
| Comment by Hans Bornich [ 2019 Mar 31 ] |
|
I disabled ODBC the other day and let it run for a while: Thank you for your instructions. I have compiled it and made a test run with valgrind - I hope the output is what you expect. I'm attaching it here. |
| Comment by Andris Mednis [ 2019 Apr 01 ] |
|
Hi, Hans! ==00:00:00:04.916 46598== 10,529 (192 direct, 10,337 indirect) bytes in 1 blocks are definitely lost in loss record 181 of 184 ==00:00:00:04.916 46598== at 0x4C2A1E3: operator new(unsigned long) (vg_replace_malloc.c:334) ==00:00:00:04.916 46598== by 0x632E9BF: allocEnv(void**) (in /opt/ibm/iaccess/lib64/libcwbodbc.so) ==00:00:00:04.916 46598== by 0x62DF614: SQLAllocHandle (in /opt/ibm/iaccess/lib64/libcwbodbc.so) ==00:00:00:04.916 46598== by 0x4E438DB: ??? (in /usr/lib64/libodbc.so.2.0.0) ==00:00:00:04.916 46598== by 0x4E45AF6: SQLConnect (in /usr/lib64/libodbc.so.2.0.0) ==00:00:00:04.916 46598== by 0x400DAA: main (in /home/egadmin/odbcmin) ==00:00:00:04.916 46598== ==00:00:00:04.916 46598== 14,041 (1,016 direct, 13,025 indirect) bytes in 1 blocks are definitely lost in loss record 182 of 184 ==00:00:00:04.916 46598== at 0x4C2A1E3: operator new(unsigned long) (vg_replace_malloc.c:334) ==00:00:00:04.916 46598== by 0x6881B07: PiCoServer::buildEthor() (in /opt/ibm/iaccess/lib64/libcwbcore.so) ==00:00:00:04.916 46598== by 0x6881FC7: PiCoServer::connect() (in /opt/ibm/iaccess/lib64/libcwbcore.so) ==00:00:00:04.916 46598== by 0x6878C10: PiCoSystem::connect(unsigned long, PiCoServerWorkQueue**) (in /opt/ibm/iaccess/lib64/libcwbcore.so) ==00:00:00:04.916 46598== by 0x68A058E: cwbCO_Connect (in /opt/ibm/iaccess/lib64/libcwbcore.so) ==00:00:00:04.916 46598== by 0x6354A36: CONNECT_INFO::fullconnect() (in /opt/ibm/iaccess/lib64/libcwbodbc.so) ==00:00:00:04.916 46598== by 0x6356064: CONNECT_INFO::attemptConnection() (in /opt/ibm/iaccess/lib64/libcwbodbc.so) ==00:00:00:04.916 46598== by 0x635A1EB: CONNECT_INFO::sqlConnect(wchar_t*, unsigned long, wchar_t*, unsigned long, wchar_t*, unsigned long) (in /opt/ibm/iaccess/lib64/libcwbodbc.so) ==00:00:00:04.916 46598== by 0x62ED549: cow_SQLConnect(void*, wchar_t*, short, wchar_t*, short, wchar_t*, short) (in /opt/ibm/iaccess/lib64/libcwbodbc.so) ==00:00:00:04.916 46598== by 0x62ED7C8: SQLConnect (in /opt/ibm/iaccess/lib64/libcwbodbc.so) ==00:00:00:04.916 46598== by 0x4E45B3F: SQLConnect (in /usr/lib64/libodbc.so.2.0.0) ==00:00:00:04.916 46598== by 0x400DAA: main (in /home/egadmin/odbcmin) Could you forward odbcmin.c |
| Comment by Hans Bornich [ 2019 Apr 01 ] |
|
Hi Andris, |
| Comment by Andris Mednis [ 2019 Apr 01 ] |
I cannot say it. It could be IBM iaccess library or it could be that we are not using it properly. IBM support can run 'odbcmin' and see in detail where wrong things happen (IBM iaccess seems to be closed source). |
| Comment by Glebs Ivanovskis [ 2019 Apr 01 ] |
|
Note that Zabbix does not use ODBC drivers directly, there is also UnixODBC in between, which may not be perfect as well. |
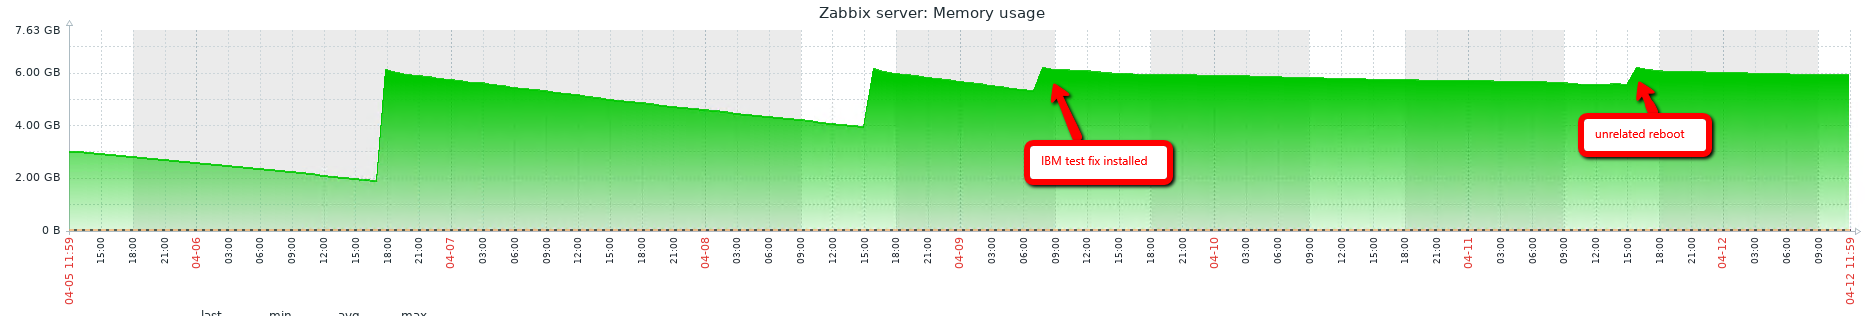
| Comment by Hans Bornich [ 2019 Apr 12 ] |
|
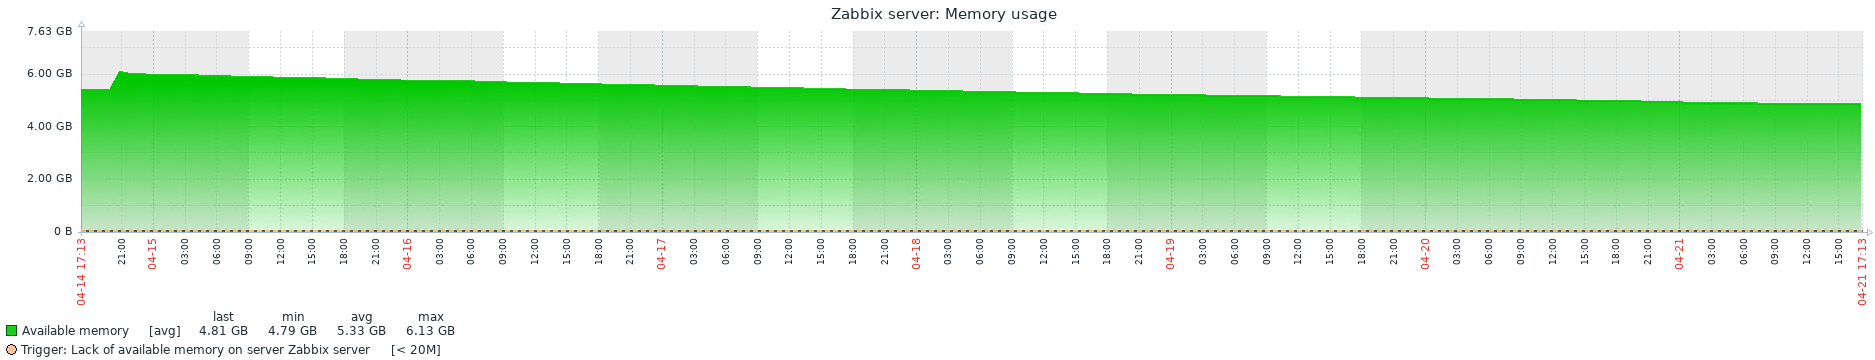
Time for an update. I received a test fix from IBM. It definitely had an impact (see screenshot) |
| Comment by Hans Bornich [ 2019 Apr 12 ] |
| Comment by Andris Mednis [ 2019 Apr 15 ] |
|
I looked into odbcmin_26248 On the other hand. odbcmin is a really minimal program - if even it shows problems then what to expect from a long running program ... |
| Comment by Hans Bornich [ 2019 Apr 15 ] |
|
Hi Andris, thank you for your input. I have relayed this to IBM and will wait for their response. |
| Comment by Vladislavs Sokurenko [ 2019 Apr 15 ] |
|
No indication of a bug in Zabbix, closing as commercial support required. |
| Comment by Hans Bornich [ 2019 Apr 21 ] |
|
I actually contacted Zabbix to get paid assistance before even opening this ticket. They referred me to opening it before they could help. How should I proceed then? Meanwhile I received this update from IBM: There are also losses due to application bugs: the connection is never closed, which causes the SQLFreeHandle of both the dbc and env handles to fail since they are in use. After inserting an SQLDisconnect after the SQLFreeHandle of the stmt, my valgrind report went from 170 to 136. There's certainly still some problems here, there are 2 error records noted in the valgrind report from the customer, while I see more in my current build. Those are definitely worth looking at, but I think there are probably more issues with unixODBC itself at this point, especially during SQLConnect processing. – end of quote – Any suggestions? |
| Comment by Glebs Ivanovskis [ 2019 Apr 21 ] |
|
First things first. Don't read my words as an official response from Zabbix. Speaking of SQLDisconnect(), that's problem of odbcmin.c Your last available memory graph 2019-04-12_1159.png
So... Has it stabilized or not? Was UnixODBC connection pooling enabled when you got this graph and odbcmin_26248 |
| Comment by Glebs Ivanovskis [ 2019 Apr 21 ] |
|
I have attached a version of odbcmin.c |
| Comment by Hans Bornich [ 2019 Apr 21 ] |
|
Hi Glebs. |
| Comment by Glebs Ivanovskis [ 2019 Apr 21 ] |
|
OK, judging by the graph, it leaks 200 MB a day. Let's estimate how many ODBC checks your Zabbix server performs per day. We should see if the numbers are the same we get from Valgrind run of odbcmin.c (which models a single ODBC check). Maybe there is something else happening. Maybe it's time to reach UnixODBC developers. |
| Comment by Vladislavs Sokurenko [ 2019 Apr 21 ] |
|
Please feel free to reopen the ticket if you still think there is a bug in zabbix hab, we will be happy to investigate. |
| Comment by Hans Bornich [ 2019 Apr 26 ] |
|
I ran another test with the new odbcmin.c - attached here |
| Comment by Glebs Ivanovskis [ 2019 Apr 26 ] |
|
A-a-and... It's perfect! ==00:00:00:05.204 32719== LEAK SUMMARY: ==00:00:00:05.204 32719== definitely lost: 0 bytes in 0 blocks ==00:00:00:05.204 32719== indirectly lost: 0 bytes in 0 blocks ==00:00:00:05.204 32719== possibly lost: 0 bytes in 0 blocks ==00:00:00:05.204 32719== still reachable: 26,250 bytes in 601 blocks ==00:00:00:05.204 32719== suppressed: 0 bytes in 0 blocks |
| Comment by Hans Bornich [ 2019 Apr 26 ] |
|
That's great news. I let IBM know it too. |