|
Causes |
|||
|
Duplicate |

[ZBX-15904] VMwareCacheSize overflowing issue Created: 2019 Mar 29 Updated: 2024 Apr 10 Resolved: 2020 Sep 13 |
|
| Status: | Closed |
| Project: | ZABBIX BUGS AND ISSUES |
| Component/s: | Proxy (P), Server (S) |
| Affects Version/s: | 4.0.5 |
| Fix Version/s: | 4.0.25rc1, 5.0.4rc1, 5.2.0alpha3, 5.2 (plan) |
| Type: | Patch request | Priority: | Trivial |
| Reporter: | Grzegorz Grabowski | Assignee: | Aleksejs Sestakovs (Inactive) |
| Resolution: | Fixed | Votes: | 4 |
| Labels: | vmware | ||
| Remaining Estimate: | Not Specified | ||
| Time Spent: | Not Specified | ||
| Original Estimate: | Not Specified | ||
| Environment: |
VMware, Cento7, Mariadb, Apache |
||
| Attachments: |
|
||||||||
| Issue Links: |
|
||||||||
| Team: | |
||||||||
| Sprint: | Sprint 63 (Apr 2020), Sprint 64 (May 2020), Sprint 65 (Jun 2020), Sprint 66 (Jul 2020), Sprint 67 (Aug 2020), Sprint 68 (Sep 2020) | ||||||||
| Story Points: | 1 | ||||||||
| Description |
|
No matter what VMwareCacheSize is set (from 128 MB to 2G) after about 24-48h of Zabbix running, it crashes.
 33502:20190329:123748.940 __mem_malloc: skipped 0 asked 24 skip_min 18446744073709551615 skip_max 0
 33502:20190329:123748.940 [file:vmware.c,line:92] zbx_mem_malloc(): out of memory (requested 24 bytes)
 33502:20190329:123748.940 [file:vmware.c,line:92] zbx_mem_malloc(): please increase VMwareCacheSize configuration parameter
 33502:20190329:123748.940 === memory statistics for vmware cache size ===
 33502:20190329:123748.940 min chunk size: 18446744073709551615 bytes
 33502:20190329:123748.940 max chunk size:          0 bytes
 33502:20190329:123748.940 memory of total size 2147482848 bytes fragmented into 15899688 chunks
 33502:20190329:123748.940 of those,          0 bytes are in        0 free chunks
 33502:20190329:123748.940 of those, 1893087856 bytes are in 15899688 used chunks
 33502:20190329:123748.940 ================================
 33502:20190329:123748.940 === Backtrace: ===
 33502:20190329:123748.941 12: /usr/sbin/zabbix_server: vmware collector #1 [updated 0, removed 0 VMware services in 0.000016 sec, querying VMware services](zbx_backtrace+0x35) [0x55a9f744cb59]
 33502:20190329:123748.941 11: /usr/sbin/zabbix_server: vmware collector #1 [updated 0, removed 0 VMware services in 0.000016 sec, querying VMware services](__zbx_mem_malloc+0x163) [0x55a9f7448590]
 33502:20190329:123748.941 10: /usr/sbin/zabbix_server: vmware collector #1 [updated 0, removed 0 VMware services in 0.000016 sec, querying VMware services](+0x79f3d) [0x55a9f73d0f3d]
 33502:20190329:123748.941 9: /usr/sbin/zabbix_server: vmware collector #1 [updated 0, removed 0 VMware services in 0.000016 sec, querying VMware services](+0x7bb81) [0x55a9f73d2b81]
 33502:20190329:123748.941 8: /usr/sbin/zabbix_server: vmware collector #1 [updated 0, removed 0 VMware services in 0.000016 sec, querying VMware services](+0x7c2e0) [0x55a9f73d32e0]
 33502:20190329:123748.941 7: /usr/sbin/zabbix_server: vmware collector #1 [updated 0, removed 0 VMware services in 0.000016 sec, querying VMware services](+0x81b19) [0x55a9f73d8b19]
 33502:20190329:123748.941 6: /usr/sbin/zabbix_server: vmware collector #1 [updated 0, removed 0 VMware services in 0.000016 sec, querying VMware services](vmware_thread+0x340) [0x55a9f73dab0c]
 33502:20190329:123748.941 5: /usr/sbin/zabbix_server: vmware collector #1 [updated 0, removed 0 VMware services in 0.000016 sec, querying VMware services](zbx_thread_start+0x37) [0x55a9f745a18c]
 33502:20190329:123748.941 4: /usr/sbin/zabbix_server: vmware collector #1 [updated 0, removed 0 VMware services in 0.000016 sec, querying VMware services](MAIN_ZABBIX_ENTRY+0xd06) [0x55a9f7390bf3]
 33502:20190329:123748.941 3: /usr/sbin/zabbix_server: vmware collector #1 [updated 0, removed 0 VMware services in 0.000016 sec, querying VMware services](daemon_start+0x31b) [0x55a9f744c3aa]
 33502:20190329:123748.941 2: /usr/sbin/zabbix_server: vmware collector #1 [updated 0, removed 0 VMware services in 0.000016 sec, querying VMware services](main+0x312) [0x55a9f738feeb]
 33502:20190329:123748.941 1: /lib64/libc.so.6(__libc_start_main+0xf5) [0x7f15b38f8445]
 33502:20190329:123748.941 0: /usr/sbin/zabbix_server: vmware collector #1 [updated 0, removed 0 VMware services in 0.000016 sec, querying VMware services](+0x38059) [0x55a9f738f059]
 31718:20190329:123749.600 One child process died (PID:33502,exitcode/signal:1). Exiting ...
zabbix_server [31718]: Error waiting for process with PID 33502: [10] No child processes
 31718:20190329:123903.459 Zabbix Server stopped. Zabbix 4.0.5 (revision 90164).
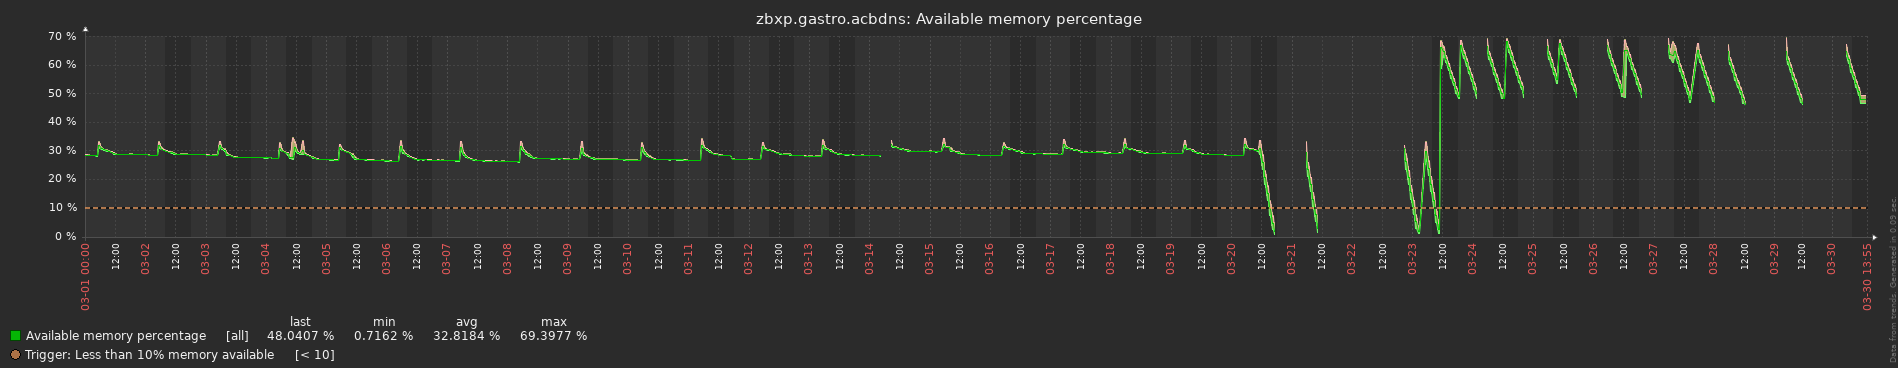
According to logs, the cache is too small BUT, on the Self Monitoring Zabbix Cache Graph (atached) there is a lot of free space in VMware Cache. Or there is some memory leak in cache or internal items can't correctly read the cache capacity.
|
| Comments |
| Comment by Andrei Gushchin (Inactive) [ 2019 Mar 29 ] |
|
Please attach the full zabbix_server.log here. |
| Comment by Grzegorz Grabowski [ 2019 Mar 31 ] |
|
I attached one small log. If you want I can do more, but all this logs shows the same. |
| Comment by Grzegorz Grabowski [ 2019 Mar 31 ] |
|
And more, some logs with VMware poller debug enabled. |
| Comment by Edgar Akhmetshin [ 2019 Apr 01 ] |
|
Hello Grzegorz, I see 4.0.4 in the log file, but you specified 4.0.5. Please, clarify version used with operating system (name and version), also upload the following information to the issue including Zabbix Server configuration file: objdump -Dswx $(which zabbix_server) | gzip -c > zabbix_server.objdump.gz ldd $(which zabbix_server) Please, in addition, provide information about your VMware setup: number of hypervisors behind vCenter. Regards, |
| Comment by Grzegorz Grabowski [ 2019 Apr 01 ] |
|
The log files started at 4.0.4 and during the problem server was upgraded to 4.0.5. If you take a look on whole file you will see version 4.0.5 is in action.
[root@zbx-01 /]# cat /etc/redhat-release
CentOS Linux release 7.5.1804 (Core)
[root@zbx-01 /]# uname -a
Linux zbx-01 3.10.0-862.2.3.el7.x86_64 #1 SMP Wed May 9 18:05:47 UTC 2018 x86_64 x86_64 x86_64 GNU/Linux
[root@zbx-01 /]# ldd $(which zabbix_server)
        linux-vdso.so.1 =>  (0x00007ffdcc10a000)
        libmysqlclient.so.18 => /lib64/libmysqlclient.so.18 (0x00007f320cd59000)
        libpthread.so.0 => /lib64/libpthread.so.0 (0x00007f320cb3d000)
        libz.so.1 => /lib64/libz.so.1 (0x00007f320c927000)
        libm.so.6 => /lib64/libm.so.6 (0x00007f320c625000)
        libssl.so.10 => /lib64/libssl.so.10 (0x00007f320c3b3000)
        libcrypto.so.10 => /lib64/libcrypto.so.10 (0x00007f320bf52000)
        libdl.so.2 => /lib64/libdl.so.2 (0x00007f320bd4e000)
        libiksemel.so.3 => /lib64/libiksemel.so.3 (0x00007f320bb40000)
        libxml2.so.2 => /lib64/libxml2.so.2 (0x00007f320b7d6000)
        libodbc.so.2 => /lib64/libodbc.so.2 (0x00007f320b56e000)
        libnetsnmp.so.31 => /lib64/libnetsnmp.so.31 (0x00007f320b26c000)
        libssh2.so.1 => /lib64/libssh2.so.1 (0x00007f320b042000)
        libOpenIPMI.so.0 => /lib64/libOpenIPMI.so.0 (0x00007f320ad35000)
        libOpenIPMIposix.so.0 => /lib64/libOpenIPMIposix.so.0 (0x00007f320ab2d000)
        libevent-2.0.so.5 => /lib64/libevent-2.0.so.5 (0x00007f320a8e5000)
        libldap-2.4.so.2 => /lib64/libldap-2.4.so.2 (0x00007f320a690000)
        liblber-2.4.so.2 => /lib64/liblber-2.4.so.2 (0x00007f320a481000)
        libcurl.so.4 => /lib64/libcurl.so.4 (0x00007f320a218000)
        libresolv.so.2 => /lib64/libresolv.so.2 (0x00007f3209fff000)
        libpcre.so.1 => /lib64/libpcre.so.1 (0x00007f3209d9d000)
        libgcc_s.so.1 => /lib64/libgcc_s.so.1 (0x00007f3209b87000)
        libc.so.6 => /lib64/libc.so.6 (0x00007f32097ba000)
        libstdc++.so.6 => /lib64/libstdc++.so.6 (0x00007f32094b3000)
        /lib64/ld-linux-x86-64.so.2 (0x00007f320d7b7000)
        libgssapi_krb5.so.2 => /lib64/libgssapi_krb5.so.2 (0x00007f3209266000)
        libkrb5.so.3 => /lib64/libkrb5.so.3 (0x00007f3208f7e000)
        libcom_err.so.2 => /lib64/libcom_err.so.2 (0x00007f3208d7a000)
        libk5crypto.so.3 => /lib64/libk5crypto.so.3 (0x00007f3208b47000)
        libgnutls.so.28 => /lib64/libgnutls.so.28 (0x00007f320880d000)
        libgcrypt.so.11 => /lib64/libgcrypt.so.11 (0x00007f320858c000)
        libgpg-error.so.0 => /lib64/libgpg-error.so.0 (0x00007f3208387000)
        liblzma.so.5 => /lib64/liblzma.so.5 (0x00007f3208161000)
        libltdl.so.7 => /lib64/libltdl.so.7 (0x00007f3207f57000)
        libOpenIPMIutils.so.0 => /lib64/libOpenIPMIutils.so.0 (0x00007f3207d4d000)
        libgdbm.so.4 => /lib64/libgdbm.so.4 (0x00007f3207b44000)
        libsasl2.so.3 => /lib64/libsasl2.so.3 (0x00007f3207927000)
        libssl3.so => /lib64/libssl3.so (0x00007f32076d9000)
        libsmime3.so => /lib64/libsmime3.so (0x00007f32074b2000)
        libnss3.so => /lib64/libnss3.so (0x00007f3207185000)
        libnssutil3.so => /lib64/libnssutil3.so (0x00007f3206f56000)
        libplds4.so => /lib64/libplds4.so (0x00007f3206d52000)
        libplc4.so => /lib64/libplc4.so (0x00007f3206b4d000)
        libnspr4.so => /lib64/libnspr4.so (0x00007f320690f000)
        libidn.so.11 => /lib64/libidn.so.11 (0x00007f32066dc000)
        libkrb5support.so.0 => /lib64/libkrb5support.so.0 (0x00007f32064ce000)
        libkeyutils.so.1 => /lib64/libkeyutils.so.1 (0x00007f32062ca000)
        libp11-kit.so.0 => /lib64/libp11-kit.so.0 (0x00007f3205f9b000)
        libtasn1.so.6 => /lib64/libtasn1.so.6 (0x00007f3205d88000)
        libnettle.so.4 => /lib64/libnettle.so.4 (0x00007f3205b57000)
        libhogweed.so.2 => /lib64/libhogweed.so.2 (0x00007f3205930000)
        libgmp.so.10 => /lib64/libgmp.so.10 (0x00007f32056b8000)
        libcrypt.so.1 => /lib64/libcrypt.so.1 (0x00007f3205481000)
        librt.so.1 => /lib64/librt.so.1 (0x00007f3205279000)
        libselinux.so.1 => /lib64/libselinux.so.1 (0x00007f3205052000)
        libffi.so.6 => /lib64/libffi.so.6 (0x00007f3204e4a000)
        libfreebl3.so => /lib64/libfreebl3.so (0x00007f3204c47000)
|
| Comment by Grzegorz Grabowski [ 2019 Apr 01 ] |
|
1x vCenter, 21 x ESX, 9 x Datacenters 692 x VM's All objects are using standard VMware templates.
|
| Comment by Andreas Niedermann [ 2020 Mar 30 ] |
|
This happens on an offiste zabbix proxy v4.0.2 (dockerized) since we are surveying more than one vcenter server. The proxies log: 282:20200330:130533.986 __mem_malloc: skipped 0 asked 24 skip_min 18446744073709551615 skip_max 0 |
| Comment by Andreas Niedermann [ 2020 Mar 30 ] |
|
we're surveying the second vcenter since Mar 20 as you can see... |
| Comment by Andreas Niedermann [ 2020 Apr 02 ] |
|
I've found a solution: Disabling item "vmware.eventlog[\{$URL}]" solves the issue for me. The memory isn't leaking anymore.
|
| Comment by Glebs Ivanovskis [ 2020 Apr 02 ] |
|
armacomander, I believe there is now skip parameter for vmware.eventlog[] item to prevent reading huge event logs from very beginning. |
| Comment by Aleksejs Sestakovs (Inactive) [ 2020 May 05 ] |
|
mbsit, armacomander, kazuo.ito Tell me please, do you use preprocessing for vmware.eventlog[] item? |
| Comment by Grzegorz Grabowski [ 2020 May 05 ] |
|
As i can see, we are not using preprocessing for {{vmware.eventlog[]. }} As Andreas suggested I stopped the item. |
| Comment by damir [ 2020 May 28 ] |
|
The same problem occurs after upgrading from 4.4 to 5.0. Disabling vmware.eventlog[] item not gives any result. |
| Comment by Andreas Niedermann [ 2020 Jul 24 ] |
|
asestakovs no we don't use preprocessing for vmware.eventlog[ ] But I have an update: The system on which the problem occurred in my case was a zabbix-proxy. This proxy successfully monitors a vsphere cluster with vmware.eventlog[ ] item enabled for a long time without any issue. Then as I mentioned, March 20 monitoring a second cluster triggered the problem in my case (–> This happens on an offiste zabbix proxy v4.0.2 (dockerized) since we are surveying more than one vcenter server.). Disabling the item of the second cluster helped while leaving the item enabled for the first cluster...it looks like it can't handle more than one of this item. |
| Comment by Glebs Ivanovskis [ 2020 Jul 24 ] |
|
Regarding "multiple vmware.eventlog[] items" there is the following comment (added in /* this may happen if there are multiple vmware.eventlog items for the same service URL or item has */ /* been polled, but values got stuck in history cache and item's lastlogsize hasn't been updated yet */ I wonder if this is somehow related... Do you see "Too old events requested." error message? |
| Comment by Michael Veksler [ 2020 Jul 28 ] |
|
Solved problem: when we load events for the first time, the shared memory exhausted by small chunks and at the end a user sees the error "out of memory (requested 146 bytes)". Where statistic show a lot of free memory 1 min before Solution: calculate the amount of memory consumed the events before loading into shared memory and:
Tested scenario:
we observe two records in log file: 21136:20200728:133457.398 Processed VMware events requires up to 6962048 bytes of free VMwareCache memory. VMwareCache memory usage (free/strpool/total): 66340536 / 131280 / 67108064 21135:20200728:133619.570 Processed VMware events requires up to 60613160 bytes of free VMwareCache memory. VMwareCache memory usage (free/strpool/total): 65994096 / 132416 / 67108064 In case of decrease VMwareCacheSize, we can see in log file info about required memory for not processed events and UI will display the error. Attention: crash due to not enough memory is still possible, because we do not take into account size about clusters, HV, DS, VM and perfCounters info Successfully tested. |
| Comment by Aleksejs Sestakovs (Inactive) [ 2020 Sep 03 ] |
|
Available in versions:
|