[ZBX-16053] False 'Zabbix agent on {HOST.NAME} is unreachable for 5 minutes' alert Created: 2019 Apr 29 Updated: 2020 Jun 29 Resolved: 2020 Jun 29 |
|
| Status: | Closed |
| Project: | ZABBIX BUGS AND ISSUES |
| Component/s: | Agent (G), Proxy (P), Server (S) |
| Affects Version/s: | 4.0.6 |
| Fix Version/s: | None |
| Type: | Incident report | Priority: | Trivial |
| Reporter: | Saumyajit Pramanik | Assignee: | Renats Valiahmetovs (Inactive) |
| Resolution: | Incomplete | Votes: | 0 |
| Labels: | agent, templates | ||
| Remaining Estimate: | Not Specified | ||
| Time Spent: | Not Specified | ||
| Original Estimate: | Not Specified | ||
| Environment: |
Prod |
||
| Attachments: |
|
| Description |
|
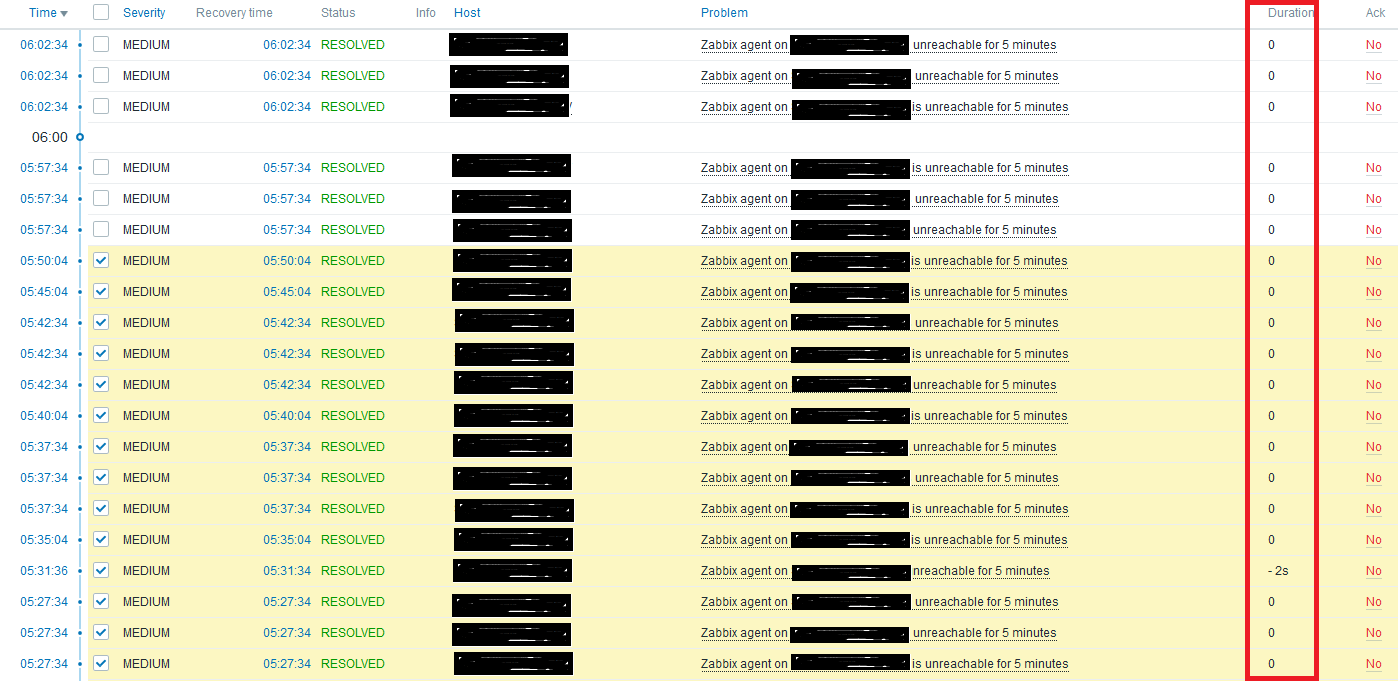
Hi, Currently we're migrating our prod setup (distributed monitoring) to Zabbix. But receiving huge number of 'Zabbix agent on {HOST.NAME} is unreachable for 5 minutes' alert very frequently. The alerts is also getting cleared within no time & sometimes duration is showing in - (minus) as well (PFA for details). We're using the default 'Template App Zabbix Agent' template for this. Currently approx 100 hosts is in enabled state & we're getting 1600+ alerts for per day for only this. Kindly suggest how we can over come from this. Thanks a lot}}{{ |
| Comments |
| Comment by Kaspars Mednis [ 2019 Apr 30 ] |
|
Hello, A quick question - is the time set correctly on Zabbix server and agents ? This alert means that no data are recived form the agent for last 5 minutes, but if the clocks are not synchronized correctly on Zabbix server or agent machines, wrong timestanps can cause this issue. |
| Comment by Kaspars Mednis [ 2019 Apr 30 ] |
|
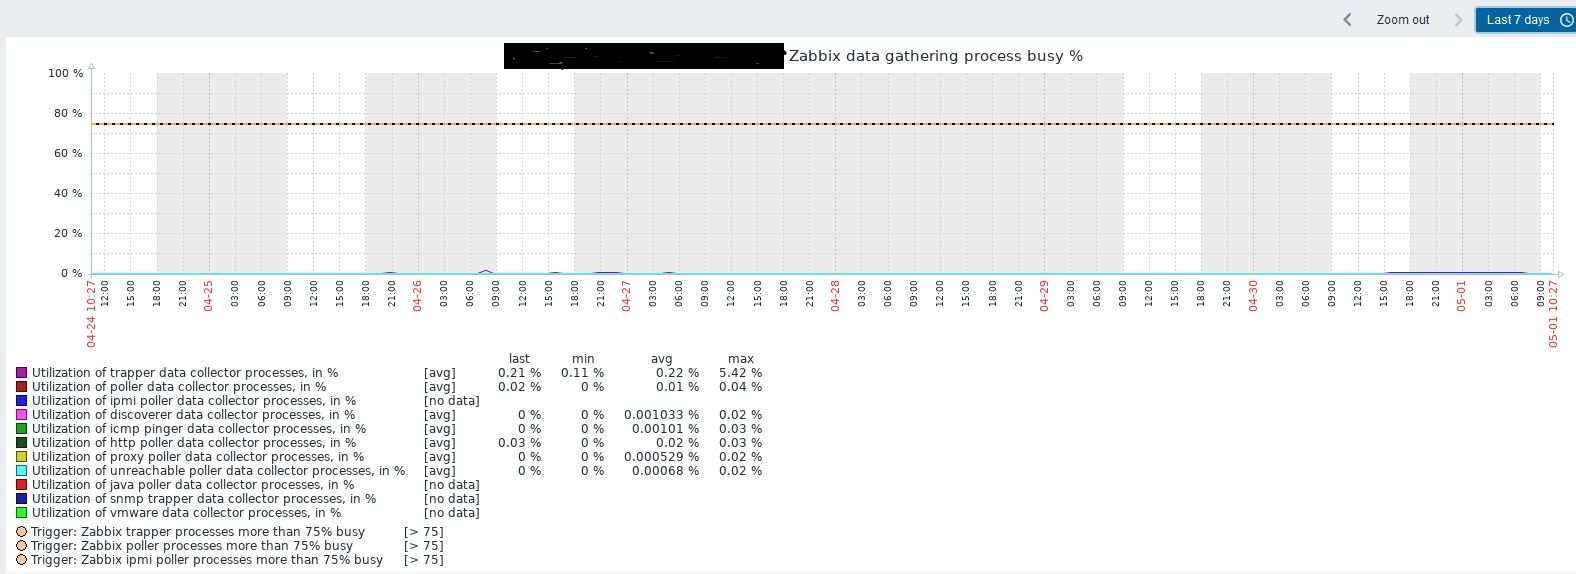
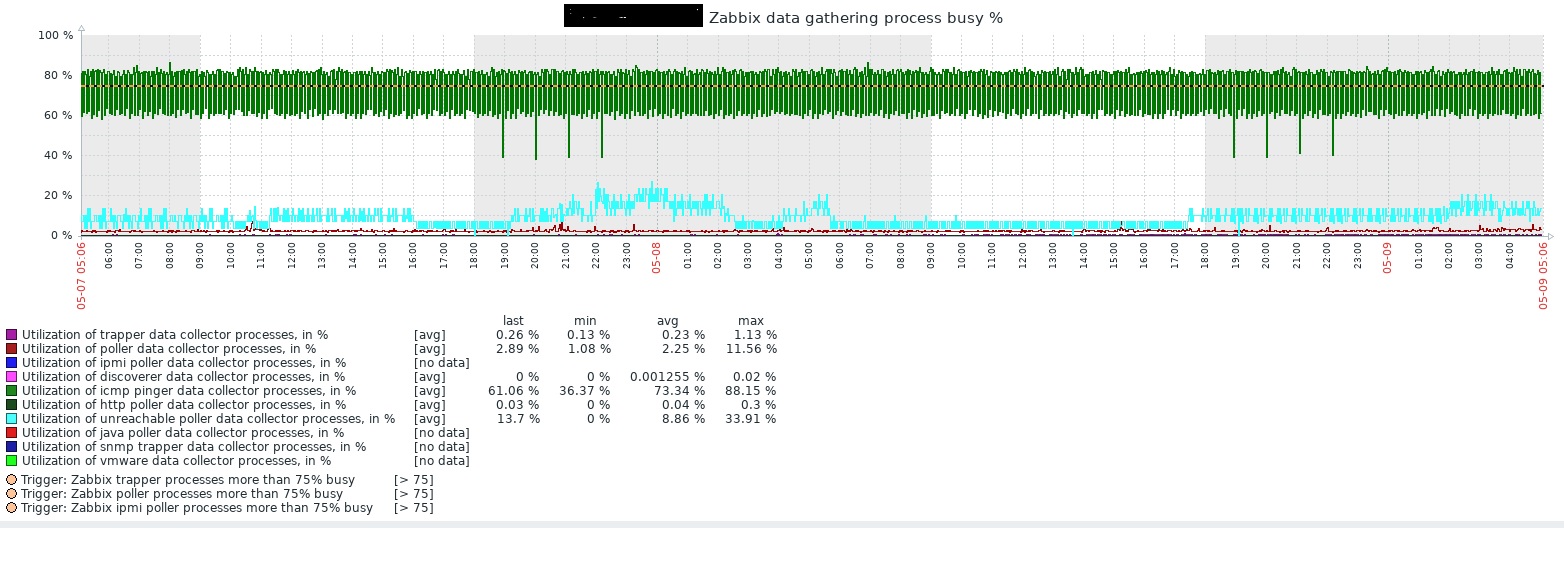
There also can be issue with not enough Pollers configured for Zabbix Server, we suggest to take look at data gatherer processes busy graph (Monitoring -> Graphs -> Zabbix Server - Zabbix Data gathering process busy) If some process is constantly 100% busy, you need to increase the amount of the processes started in Zabbix server conf file and restart the Zabbix Server |
| Comment by Saumyajit Pramanik [ 2019 May 01 ] |
|
Hi Kaspars, Thank you. We're having a distributed setup & proxy servers are located in different locations having different timezone. Our Zabbix server is in CDT while proxies are in CDT, CT, EDT, UTC & CEST timezone. Time configured on all the servers (incl. Zabbix server/proxies & agents) are proper as per respective timezone. So how can i sync time between Zabbix server/proxies & agents in this scenario.'StartPollers=50' has been set on zabbix_server.conf. rest all are default. PFA for the 'Zabbix Data gathering process busy' graph for last 7 days. Kindly suggest if any modifications required on 'zabbix_server.conf' or any other conf file/s & do let me know if any more information required.
|
| Comment by Kaspars Mednis [ 2019 May 03 ] |
|
You need to check your poller usage not only on Zabbix server, but also on proxies. And remember - to collect internal statistic from proxy the proxy mast have Proxy template assigned and must be monitored by itself About your timezone issue - There is no problem in using different time zones, Zabbix collects all metrics with UTC timestamp. Problems will start, if you have time drift on some of your proxies for more than 5 minutes, by example if Server is on CDT and proxy on EDT, the time must be by example 9:10 on server and 10:10 on proxy, which has the same UTC timestamp. Problems will start, if your server will have by example 9:10 on CDT, but proxy 10:02 on EDT, which makes time drift for 8 minutes (all your timestamps will be marked incorrectly - 8 minutes) and 5 minute nodata trigger will fire Are you using active or passive agents ? |
| Comment by Saumyajit Pramanik [ 2019 May 09 ] |
|
|
| Comment by Saumyajit Pramanik [ 2019 May 09 ] |
|
|
| Comment by Saumyajit Pramanik [ 2019 May 09 ] |
|
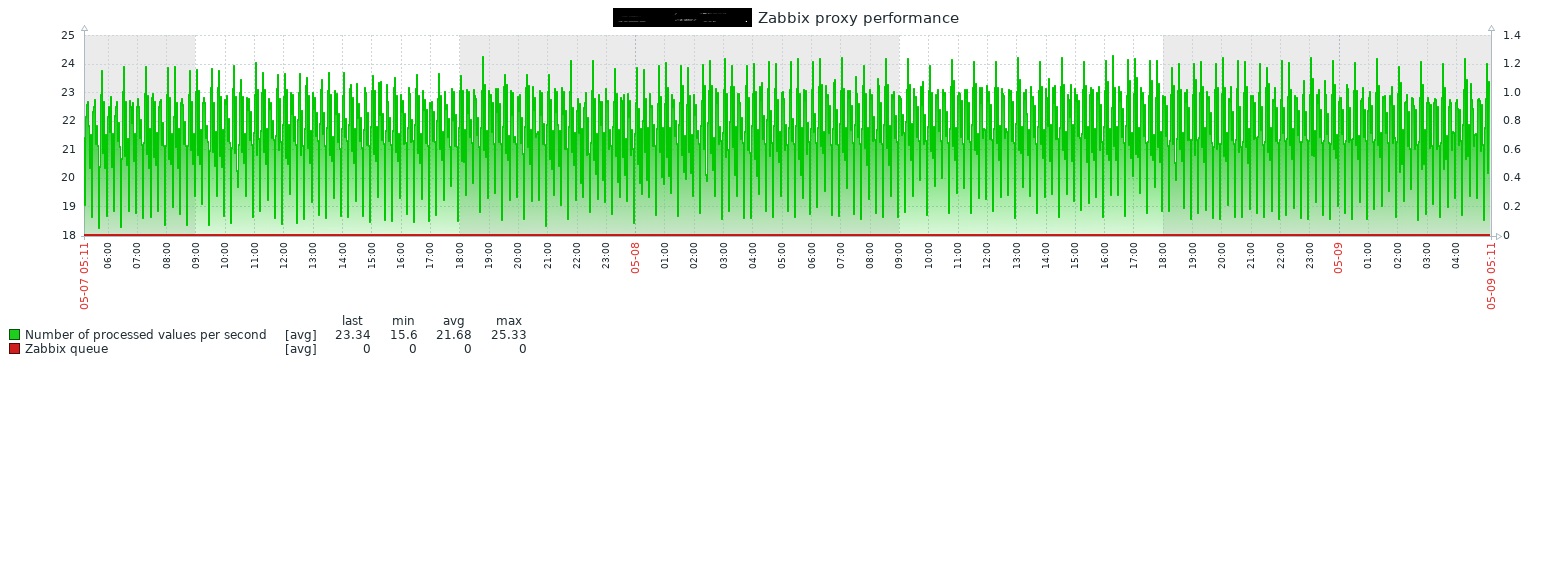
Hi Kaspars, PFA for the performance graphs for the proxy server (which is currently enabled) for last 2 days. There is no changes done on 'zabbix_proxy.conf' regarding poller process, trapper or unreachable poller process. I'm using most as passive agent & only few as active agent. I've tried switching to passive agent for all the items for all the servers (by changing the templates), but the issue didn't get resolved. |
| Comment by Saumyajit Pramanik [ 2019 May 20 ] |
|
Hi Kaspars, Any update or suggestion on this. |
| Comment by Saumyajit Pramanik [ 2019 Jul 01 ] |
|
Hi Kaspars, Any suggestion on this. |
| Comment by Kaspars Mednis [ 2019 Jul 05 ] |
|
Yes, lets look at one of your proxies with most problems, please attach the following graphs
I still do not believe this is some kind of bug, feels more like performance troubleshooting issue. So we will take a look at your proxy and try to find source of the problems, but keep in mind this is a bug tracker, not a free support portal. We have performance tuning as a commercial service, or you can use our free forum https://www.zabbix.com/forum and seek for help from our community members . |
| Comment by Kaspars Mednis [ 2019 Aug 02 ] |
|
Do you still have a problem ? Can you provide requested information in that case ? |
| Comment by Saumyajit Pramanik [ 2019 Aug 30 ] |
|
I'm extremely sorry & apologize for such delayed response. Yes, still facing the problem. I've attached the performance graphs for one of my proxy server (the same server for which I've provided earlier). Kindly do let me know if need any more details. |
| Comment by Renats Valiahmetovs (Inactive) [ 2020 Jun 15 ] |
|
Dear Saumyajit, Is the issue still relevant? Best Regards, |
| Comment by Renats Valiahmetovs (Inactive) [ 2020 Jun 29 ] |
|
This issue has not been updated for more than 14 days. We are automatically closing this issue, but if the problem is not yet resolved and requires additional work, you may reopen it within the next 30 days by commenting on the ticket. |