[ZBX-16211] Monitoring memory on Linux over SNMP.... Created: 2019 Jun 04 Updated: 2019 Oct 03 Resolved: 2019 Sep 23 |
|
| Status: | Closed |
| Project: | ZABBIX BUGS AND ISSUES |
| Component/s: | Frontend (F), Server (S) |
| Affects Version/s: | 4.2.1 |
| Fix Version/s: | None |
| Type: | Problem report | Priority: | Minor |
| Reporter: | Peter Danko | Assignee: | Edgars Melveris |
| Resolution: | Workaround proposed | Votes: | 0 |
| Labels: | linux, memory, snmp, template, usability | ||
| Remaining Estimate: | Not Specified | ||
| Time Spent: | Not Specified | ||
| Original Estimate: | Not Specified | ||
| Attachments: |
|
| Description |
|
Steps to reproduce:
Result: |
| Comments |
| Comment by Edgars Melveris [ 2019 Jun 04 ] | ||||||||||||||||||||||||||||||||||||||||||||||||||||
|
Hello Peter, please you show us the trigger and item configuration and also, the latest data from the item. | ||||||||||||||||||||||||||||||||||||||||||||||||||||
| Comment by Peter Danko [ 2019 Jun 05 ] | ||||||||||||||||||||||||||||||||||||||||||||||||||||
|
Hi Edgars,
I use the buil it in template for Linux system over SNMP: Template OS Linux SNMPv2
Triger from host:
{192.168.54.32:vm.memory.pused[memoryUsedPercentage.7].avg(5m)}>{$MEMORY_UTIL_MAX}
{$MEMORY_UTIL_MAX} = 95
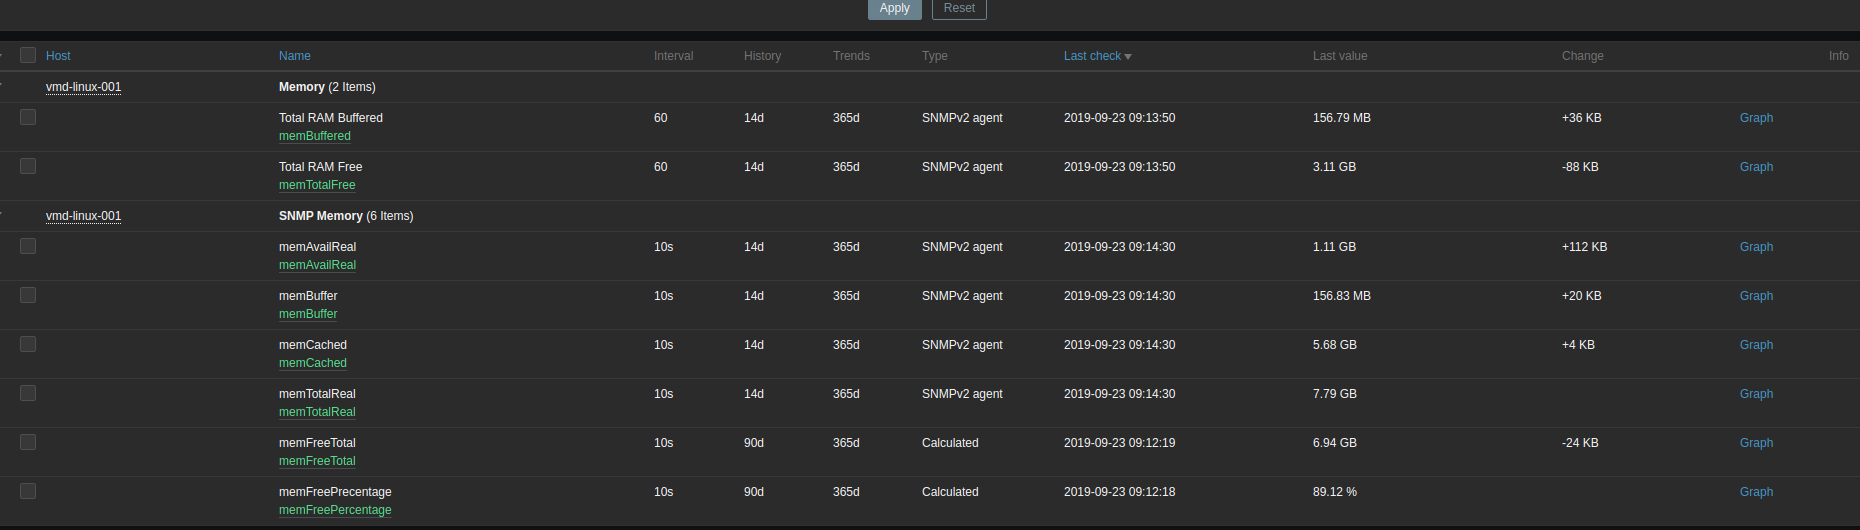
Items from host:
With this I have also problems that the original predefined LLD for memory in the Template find me so many memories, that I had more than 5000 items only for memory. I have then changed the filter in LLD function to reduce it but still have about 80 itmes only for memory and use the 6 above.
Hope it helps. | ||||||||||||||||||||||||||||||||||||||||||||||||||||
| Comment by Edgars Melveris [ 2019 Jul 05 ] | ||||||||||||||||||||||||||||||||||||||||||||||||||||
|
How about the latest values from item with key "vm.memory.pused[memoryUsedPercentage.7"? Please attach it as values from the period when the problem occured. | ||||||||||||||||||||||||||||||||||||||||||||||||||||
| Comment by Peter Danko [ 2019 Jul 08 ] | ||||||||||||||||||||||||||||||||||||||||||||||||||||
|
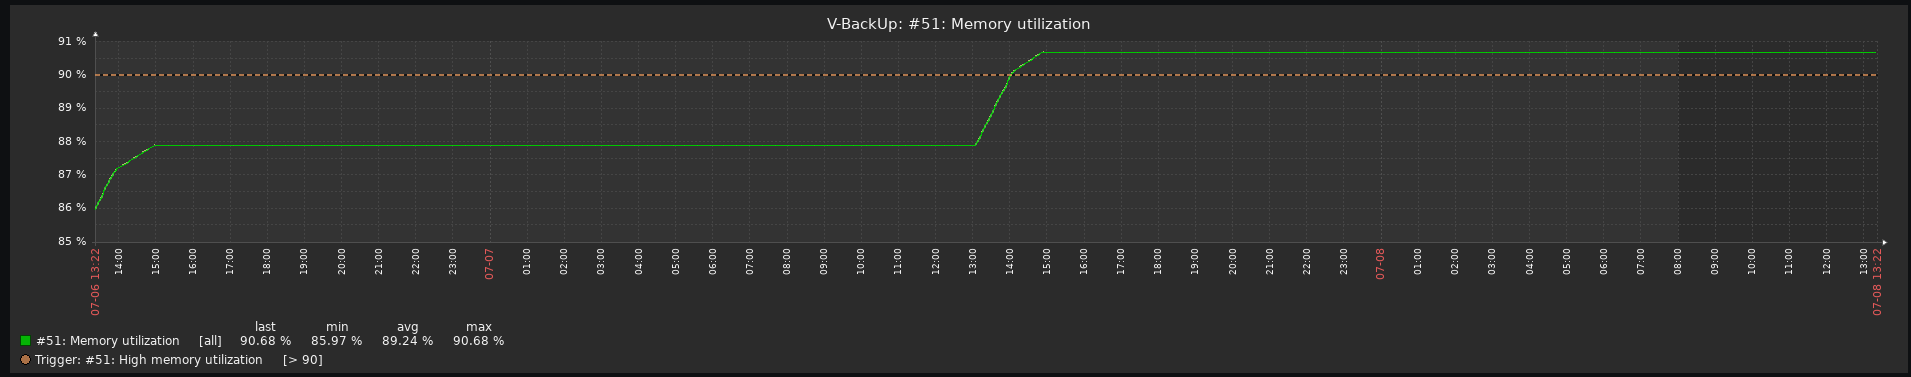
The value is: 90.68%
and I have attached the screen shor from the graph:
And so it is by all devices. The value only goes up, and never go back. By this device - it is now the Synology running on linux system - is real used memory about 29% (shown in their system).
Thanks. | ||||||||||||||||||||||||||||||||||||||||||||||||||||
| Comment by Edgars Melveris [ 2019 Jul 08 ] | ||||||||||||||||||||||||||||||||||||||||||||||||||||
|
What OID are you using to get the data? It looks like the devices are returning incorrect data and Zabbix just shows that incorrect data. You should investigate why are they behaving that way. | ||||||||||||||||||||||||||||||||||||||||||||||||||||
| Comment by Peter Danko [ 2019 Jul 08 ] | ||||||||||||||||||||||||||||||||||||||||||||||||||||
|
I use the original template OID's what was preistalled in Zabbix:
(last(vm.memory.units.used[hrStorageUsed.{#SNMPINDEX}])/last(vm.memory.units.total[hrStorageSize.{#SNMPINDEX}]))*100
In all our linux devices we use the default Template OS Linux SNMPv2
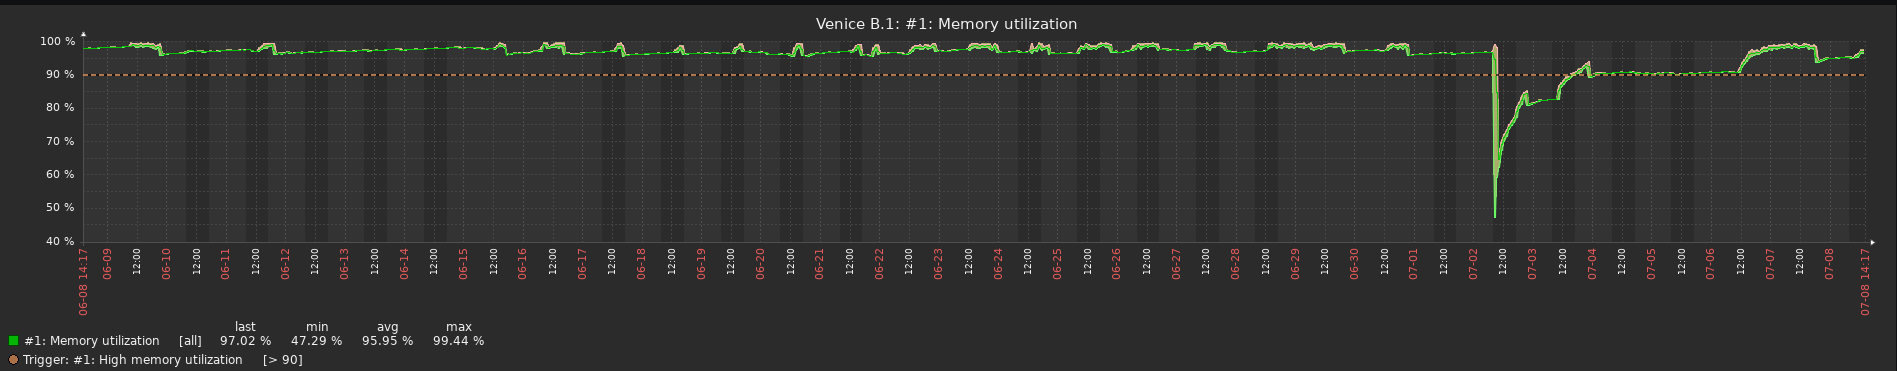
I have added anothe screen shor from other RedHat Linux PC that you can see that the usage doesnt go back even all plications was stoped and the system is writing memory usage about 20%. The peak down was restart of the system.
Thanks. | ||||||||||||||||||||||||||||||||||||||||||||||||||||
| Comment by DaneT [ 2019 Sep 04 ] | ||||||||||||||||||||||||||||||||||||||||||||||||||||
|
Hello, is the issue still valid? | ||||||||||||||||||||||||||||||||||||||||||||||||||||
| Comment by Peter Danko [ 2019 Sep 04 ] | ||||||||||||||||||||||||||||||||||||||||||||||||||||
|
Hi Marcis,
yes, still is it valid. | ||||||||||||||||||||||||||||||||||||||||||||||||||||
| Comment by DaneT [ 2019 Sep 04 ] | ||||||||||||||||||||||||||||||||||||||||||||||||||||
|
Can you please attach your zabbix server config file (located at /etc/zabbix/zabbix_server.conf) | ||||||||||||||||||||||||||||||||||||||||||||||||||||
| Comment by Peter Danko [ 2019 Sep 04 ] | ||||||||||||||||||||||||||||||||||||||||||||||||||||
|
Hi Marcis,
here is it: Zabbix.zip
Thanks. | ||||||||||||||||||||||||||||||||||||||||||||||||||||
| Comment by philthynz [ 2019 Sep 19 ] | ||||||||||||||||||||||||||||||||||||||||||||||||||||
|
Is there a workaround for this issue? I am using the Template OS Linux SNMPv2 too, and get the "High memory utilization" trigger. | ||||||||||||||||||||||||||||||||||||||||||||||||||||
| Comment by DaneT [ 2019 Sep 19 ] | ||||||||||||||||||||||||||||||||||||||||||||||||||||
|
Hello Alfista 730:20190902:091335.401 SNMP agent item "system.cpu.util[hrProcessorLoad.775]" on host "xxx" failed: first network error, wait for 15 seconds 6800:20190902:091443.171 SNMP agent item "memory.buffered2.bytes" on host "yyy" failed: another network error, wait for 15 seconds Could you please check your network for the issues?
6676:20190903:080852.033 item "192.168.51.242:nodeIfsInBitsPerSecond.0" became not supported: SNMP error: (genError) A general failure occured
| ||||||||||||||||||||||||||||||||||||||||||||||||||||
| Comment by Peter Danko [ 2019 Sep 20 ] | ||||||||||||||||||||||||||||||||||||||||||||||||||||
|
Hi Marcis,
I know about these errors, but can't find why they are there. The network connection is OK, and the servers too.
And also have problems with the unsupported item. Its on Dell EMC Isilon device and its running without any issues, but this item is changing its status from supported to unsupported .... I don't know why
If you can help me and tell me on what I shoudl look it will be greate. But I thing these errors doesn't affect the my primary problem with the actual free memory which is shown in Zabbix.
Thanks. | ||||||||||||||||||||||||||||||||||||||||||||||||||||
| Comment by DaneT [ 2019 Sep 20 ] | ||||||||||||||||||||||||||||||||||||||||||||||||||||
|
Can you please check on some of the hosts that values are returned for these OIDS: .1.3.6.1.4.1.2021.4.14.0 .1.3.6.1.4.1.2021.4.15.0 .1.3.6.1.4.1.2021.4.6.0 .1.3.6.1.4.1.2021.4.5.0 you can check the reading from command line usingcommand like (replace COMMUNITY and IP_ADRESS with your community string and IP of the server): snmpget -v2c -cCOMMUNITY IP_ADRESS .1.3.6.1.4.1.2021.4.14.0 | ||||||||||||||||||||||||||||||||||||||||||||||||||||
| Comment by Peter Danko [ 2019 Sep 20 ] | ||||||||||||||||||||||||||||||||||||||||||||||||||||
|
Here is it. Is it from two different hosts (both linux):
last pid: 85255;  load averages:  2.20,  1.83,  1.66   up 17+00:11:31  10:20:40
123 processes: 1 running, 122 sleeping
CPU:  0.9% user,  0.0% nice,  1.1% system,  0.1% interrupt, 97.9% idle
Mem: 314M Active, 40G Inact, 20G Wired, 15G Buf, 1471M Free
V-NAS-1# snmpget -v2c -cSNMPService localhost .1.3.6.1.4.1.2021.4.14.0
Created directory: /var/net-snmp
Created directory: /var/net-snmp/mib_indexes
UCD-SNMP-MIB::memBuffer.0 = INTEGER: 15939524 kB
V-NAS-1# snmpget -v2c -cSNMPService localhost .1.3.6.1.4.1.2021.4.15.0
UCD-SNMP-MIB::memCached.0 = INTEGER: 41787064 kB
V-NAS-1# snmpget -v2c -cSNMPService localhost .1.3.6.1.4.1.2021.4.6.0
UCD-SNMP-MIB::memAvailReal.0 = INTEGER: 1516560 kB
V-NAS-1# snmpget -v2c -cSNMPService localhost .1.3.6.1.4.1.2021.4.5.0
UCD-SNMP-MIB::memTotalReal.0 = INTEGER: 66984252 kB
top - 10:20:59 up 41 days, 20:04,  2 users,  load average: 0.00, 0.00, 0.00
Tasks: 907 total,   1 running, 906 sleeping,   0 stopped,   0 zombie
Cpu(s):  1.4%us,  0.2%sy,  0.0%ni, 98.4%id,  0.0%wa,  0.0%hi,  0.0%si,  0.0%st
Mem:  32723100k total, 31071660k used,  1651440k free,   204480k buffers
Swap: 16498680k total,    57992k used, 16440688k free, 10347004k cached
[root@Venice-3 ~]#  snmpget -v2c -cSNMPService localhost .1.3.6.1.4.1.2021.4.14.0      UCD-SNMP-MIB::memBuffer.0 = INTEGER: 204480 kB
[root@Venice-3 ~]# snmpget -v2c -cSNMPService localhost .1.3.6.1.4.1.2021.4.15.0
UCD-SNMP-MIB::memCached.0 = INTEGER: 10346376 kB
[root@Venice-3 ~]#  snmpget -v2c -cSNMPService localhost .1.3.6.1.4.1.2021.4.6.0
UCD-SNMP-MIB::memAvailReal.0 = INTEGER: 1651248 kB
[root@Venice-3 ~]#  snmpget -v2c -cSNMPService localhost .1.3.6.1.4.1.2021.4.5.0
UCD-SNMP-MIB::memTotalReal.0 = INTEGER: 32723100 kB
Hope it helps.
And is possible to direct me what should I doo with these two cainds of errors? Where should I look?
Thanks.
| ||||||||||||||||||||||||||||||||||||||||||||||||||||
| Comment by DaneT [ 2019 Sep 20 ] | ||||||||||||||||||||||||||||||||||||||||||||||||||||
|
You can try to use this template to monitor memory zbx_export_template.xml | ||||||||||||||||||||||||||||||||||||||||||||||||||||
| Comment by Peter Danko [ 2019 Sep 20 ] | ||||||||||||||||||||||||||||||||||||||||||||||||||||
|
OK will try it and let you know, while now we have a problems with the server HW where is zabbix running so it will take soem time.
And is possible to help me with the finded errors and tell me what shoudl I do to resolve it?
Thanks. | ||||||||||||||||||||||||||||||||||||||||||||||||||||
| Comment by DaneT [ 2019 Sep 20 ] | ||||||||||||||||||||||||||||||||||||||||||||||||||||
|
Sorry but this is out of the scope of bug report. If you run production system you should consider Zabbix commercial support. | ||||||||||||||||||||||||||||||||||||||||||||||||||||
| Comment by Peter Danko [ 2019 Sep 20 ] | ||||||||||||||||||||||||||||||||||||||||||||||||||||
|
OK thanks. | ||||||||||||||||||||||||||||||||||||||||||||||||||||
| Comment by philthynz [ 2019 Sep 23 ] | ||||||||||||||||||||||||||||||||||||||||||||||||||||
|
I can confirm, the template looks good. Much more accurate than the original.
| ||||||||||||||||||||||||||||||||||||||||||||||||||||
| Comment by Peter Danko [ 2019 Sep 23 ] | ||||||||||||||||||||||||||||||||||||||||||||||||||||
|
Hi,
I have installed it and this template works greate. I thing this should be implemented in the Zabbix default templates.
Thanks. |