[ZBX-16628] "first network error" stops monitoring other items on the same host Created: 2019 Sep 12 Updated: 2024 Apr 10 Resolved: 2020 Feb 01 |
|
| Status: | Closed |
| Project: | ZABBIX BUGS AND ISSUES |
| Component/s: | None |
| Affects Version/s: | 4.0.11 |
| Fix Version/s: | 4.0.13rc1, 4.2.7rc1, 4.4.0beta1, 4.4 (plan) |
| Type: | Problem report | Priority: | Trivial |
| Reporter: | Kazuo Ito | Assignee: | Andrejs Tumilovics |
| Resolution: | Fixed | Votes: | 0 |
| Labels: | None | ||
| Remaining Estimate: | Not Specified | ||
| Time Spent: | Not Specified | ||
| Original Estimate: | Not Specified | ||
| Attachments: |
|
| Team: | |
| Sprint: | Sprint 56 (Sep 2019), Sprint 57 (Oct 2019), Sprint 58 (Nov 2019), Sprint 59 (Dec 2019), Sprint 60 (Jan 2020) |
| Story Points: | 0.5 |
| Description |
|
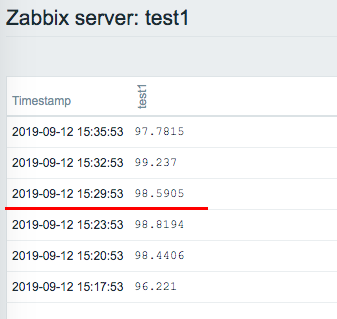
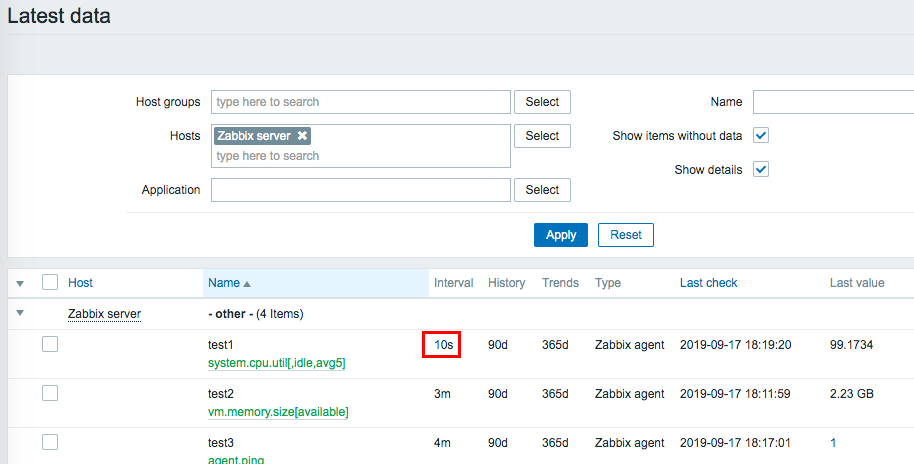
1)Create 3 items Name : test1 key : system.cpu.util[,idle,avg5] Type of information : Numeric(float) Update interval : 3m Name : test2 key : vm.memory.size[available] Type of information : Numeric(unsigned) Units : B Update interval : 3m Name : test3 key : agent.ping Type of information : Numeric(unsigned) Update interval : 4m 2)Confirm that monitoring has started with the "Latest data".
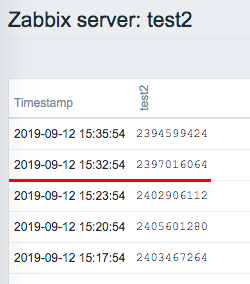
vm.memory.size[available]
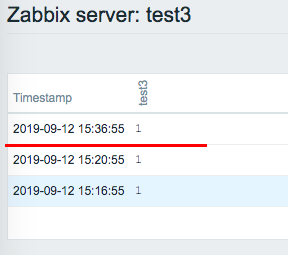
agent.ping
3)stop zabbix agent 4)Check log with tail command ]# tail -f /var/log/zabbix/zabbix_server.log 3421:20190912:152542.713 server #15 started [poller #3] 3422:20190912:152542.724 server #16 started [poller #4] 3423:20190912:152542.735 server #17 started [poller #5] 3427:20190912:152542.845 server #20 started [alerter #1] 3428:20190912:152542.847 server #21 started [preprocessing manager #1] 3425:20190912:152542.849 server #18 started [unreachable poller #1] 3426:20190912:152542.859 server #19 started [alert manager #1] 3432:20190912:152543.061 server #24 started [preprocessing worker #3] 3429:20190912:152543.079 server #22 started [preprocessing worker #1] 3430:20190912:152543.080 server #23 started [preprocessing worker #2] 3419:20190912:152653.108 Zabbix agent item "system.cpu.util[,idle,avg5]" on host "Zabbix server" failed: first network error, wait for 15 seconds 5)Start zabbix agent as soon as "first network error" is output. 3419:20190912:152653.108 Zabbix agent item "system.cpu.util[,idle,avg5]" on host "Zabbix server" failed: first network error, wait for 15 seconds 3425:20190912:152953.309 resuming Zabbix agent checks on host "Zabbix server": connection restored Why doesn't it work after 15 seconds? Check the latest data |
| Comments |
| Comment by richlv [ 2019 Sep 12 ] |
|
In step 5, the first failure timestamp is 15:08:53, but screenshots and log in step 1 have the range starting at 15:26:53 - perhaps the snippet in step 5 is from another test? |
| Comment by Kazuo Ito [ 2019 Sep 12 ] |
|
I'm sorry, I put another test result. 3419:20190912:152653.108 Zabbix agent item "system.cpu.util[,idle,avg5]" on host "Zabbix server" failed: first network error, wait for 15 seconds 3425:20190912:152953.309 resuming Zabbix agent checks on host "Zabbix server": connection restored |
| Comment by Andris Zeila [ 2019 Sep 12 ] |
|
To avoid polling items at 'disabled' periods (flexible/scheduled checks) unreachable host handling was changed in But that would explain the test1 item polling results - it failed poll at 26:53 and succeeded at it's next scheduled interval 29:53. Test 2 could not be polled at it's scheduled time 25:54 because of host unreachability. However it should have been polled at 29:54, when the host should be reachable after successful test1 poll at 29:53. I'm not sure it could be explained with internal delays. And currently I cannot explain why test3 was not polled at 24:55 and then at 32:55, that seems strange. However the unreachable host polling logic was changed in |
| Comment by Andris Zeila [ 2019 Sep 16 ] |
|
As I already tried to explain in comment - the behaviour of unreachable checks was changed in Regading Zabbix 2.2.19 - it's the same behavior. When host becomes unreachable its items are not being monitored for the next UnreachableDelay seconds (15 being the default value). See that the next check was checked after this delay: 32251:20170927:003218.347 Zabbix agent item "system.cpu.switches" on host "Zabbix server" failed: first network error, wait for 15 seconds 32252:20170927:003233.596 Zabbix agent item "system.cpu.util[,idle]" on host "Zabbix server" failed: another network error, wait for 15 seconds 32252:20170927:003248.600 resuming Zabbix agent checks on host "Zabbix server": connection restored Server does not try to check the same item after 15 seconds. On contrary - if there was another item scheduled to be checked during those 15 seconds, it will have priority over the failed item after the 15 seconds have passed. |
| Comment by Oleksii Zagorskyi [ 2019 Sep 16 ] |
|
There was related change in |
| Comment by Kazuo Ito [ 2019 Sep 17 ] |
|
I remember Is the The Zabbix4.0.11 result that I confirmed was as follows. 15:20:55 test3 monitored OK 15:23:53 test1 monitored OK 15:23:53 test1 "first network error" 15:23:54 test2 monitored OK <- internal delays? 15:23:54 test3 do nothing / reschedule? 15:26:53 test1 do nothing / reschedule? 15:26:54 test2 do nothing / reschedule? 15:28:54 test3 do nothing / reschedule? 15:29:53 connection restored / test1 monitored OK 15:29:54 test2 do nothing <- why? 15:32:53 test1 monitored OK 15:32:54 test2 monitored OK 15:32:54 test3 do nothing <- why? 15:36:55 test3 monitored OK I'm not sure it wasn't monitored at 15:29:54 and 15:32:54.
The manual states that: A host is treated as unreachable after a failed check (network error, timeout) by Zabbix, SNMP, IPMI or JMX agents. Note that Zabbix agent active checks do not influence host availability in any way. From that moment UnreachableDelay defines how often a host is rechecked using one of the items (including LLD rules) in this unreachability situation and such rechecks will be performed already by unreachable pollers (or IPMI pollers for IPMI checks). By default it is 15 seconds before the next check. I look different from the manual. |
| Comment by Kazuo Ito [ 2019 Sep 17 ] |
|
I stopped zabbix agent and waited until "host unavailable" was displayed. 7556:20190917:170715.479 Starting Zabbix Server. Zabbix 4.0.11 (revision 53bb6bc0f0). 7578:20190917:170715.660 server #13 started [poller #1] 7586:20190917:170715.752 server #18 started [unreachable poller #1] 7578:20190917:172659.449 Zabbix agent item "vm.memory.size[available]" on host "Zabbix server" failed: first network error, wait for 15 seconds 7586:20190917:172959.624 temporarily disabling Zabbix agent checks on host "Zabbix server": host unavailable 7586:20190917:173259.824 enabling Zabbix agent checks on host "Zabbix server": host became available system.cpu.util[,idle,avg5] / Update interval 3minute
vm.memory.size[available] / Update interval 3minute
agent.ping / Update interval 4minute
Sorted by time. 17:23:59 test2 monitored ok 17:24:00 test1 monitored ok 17:25:01 test3 monitored ok 17:26:59 test2 "first network error" 17:27:00 test1 nothing 17:29:01 test3 nothing 17:29:59 host unavailable 17:30:00 test1 nothing 17:32:59 host became available / test2 host became available 17:33:00 test1 nothing <- why? 17:33:01 test3 nothing <- why? 17:35:59 test2 monitored ok 17:36:00 test1 monitored ok 17:37:01 test3 monitored ok
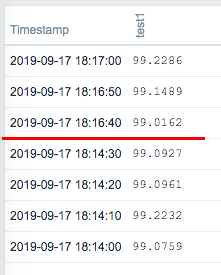
  7842:20190917:175633.365 Starting Zabbix Server. Zabbix 4.0.11 (revision 53bb6bc0f0).

  7866:20190917:175633.552 server #13 started [poller #1]

  7871:20190917:175633.607 server #18 started [unreachable poller #1]

  7866:20190917:181440.103 Zabbix agent item "system.cpu.util[,idle,avg5]" on host "Zabbix server" failed: first network error, wait for 15 seconds
  7871:20190917:181500.141 Zabbix agent item "system.cpu.util[,idle,avg5]" on host "Zabbix server" failed: another network error, wait for 15 seconds
  7871:20190917:181520.164 Zabbix agent item "system.cpu.util[,idle,avg5]" on host "Zabbix server" failed: another network error, wait for 15 seconds
  7871:20190917:181540.213 temporarily disabling Zabbix agent checks on host "Zabbix server": host unavailable
  7871:20190917:181640.402 enabling Zabbix agent checks on host "Zabbix server": host became available
For some reason, the state changes every 20 seconds.
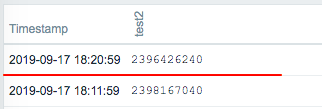
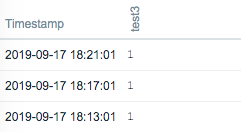
vm.memory.size[available] / Update interval 3minute agent.ping / Update interval 4minute Sorted by time. 18:11:59 test2 monitored ok 18:13:01 test3 monitored ok 18:14:30 test1 monitored ok 18:14:59 test2 nothing 18:14:40 test1 "first network error" 18:15:00 test1 "another network error" 18:15:20 test1 "another network error" 18:15:40 host unavailable 18:16:40 host became available / test1 host became available 18:16:50 test1 monitored ok 18:17:00 test1 monitored ok 18:17:01 test3 monitored ok 18:17:59 test2 nothing <- why? 18:20:59 test2 monitored ok 18:21:01 test3 monitored ok It seems to me that the next monitoring will not be performed when it is time to monitor in an unreachable state. |
| Comment by Alexander Vladishev [ 2020 Feb 01 ] |
|
Updated documentation: |