[ZBX-16886] ZBX 4.4.1 snmp agent items network errors Created: 2019 Nov 08 Updated: 2019 Nov 22 Resolved: 2019 Nov 22 |
|
| Status: | Closed |
| Project: | ZABBIX BUGS AND ISSUES |
| Component/s: | Server (S) |
| Affects Version/s: | 4.4.1 |
| Fix Version/s: | None |
| Type: | Incident report | Priority: | Critical |
| Reporter: | Anatoliy Grachev | Assignee: | Aigars Kadikis |
| Resolution: | Cannot Reproduce | Votes: | 0 |
| Labels: | None | ||
| Remaining Estimate: | Not Specified | ||
| Time Spent: | Not Specified | ||
| Original Estimate: | Not Specified | ||
| Attachments: |
|
| Description |
|
Hi there. We have few network nodes monitored via snmp (only 6). real 0m0.029s Queues in administration - queues, no. There is a lot of free random access memory. An elastic is used as the database. The snmp trapper is running, but the file to which it should write the log is empty.
|
| Comments |
| Comment by Aigars Kadikis [ 2019 Nov 11 ] |
|
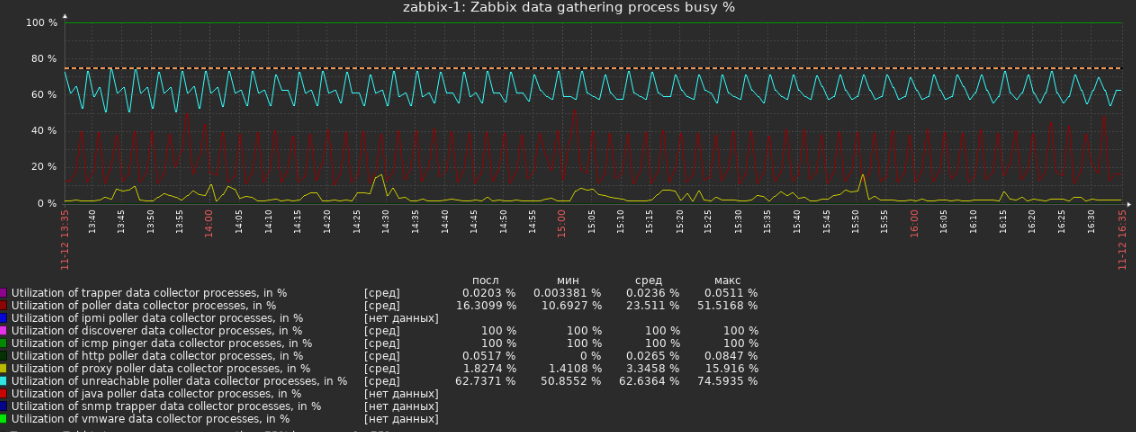
Kindly share the graph: Monitoring -> Graphs -> Host group: Zabbix server -> Host: Zabbix server -> "Zabbix data gathering process busy" Show it for the interval of the last 3h. |
| Comment by Anatoliy Grachev [ 2019 Nov 12 ] |
|
Here |
| Comment by Anatoliy Grachev [ 2019 Nov 12 ] |
|
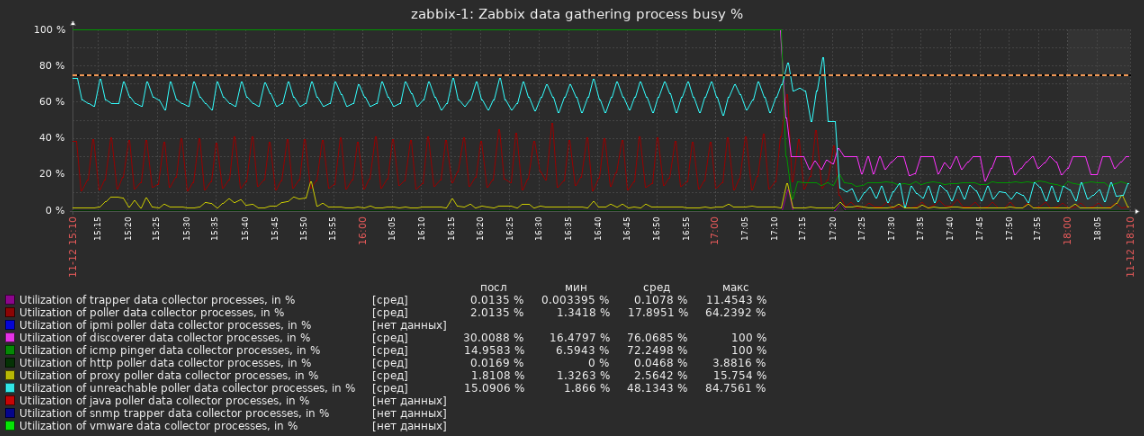
The problems on the chart, but snmp still timeout
|
| Comment by Anatoliy Grachev [ 2019 Nov 13 ] |
|
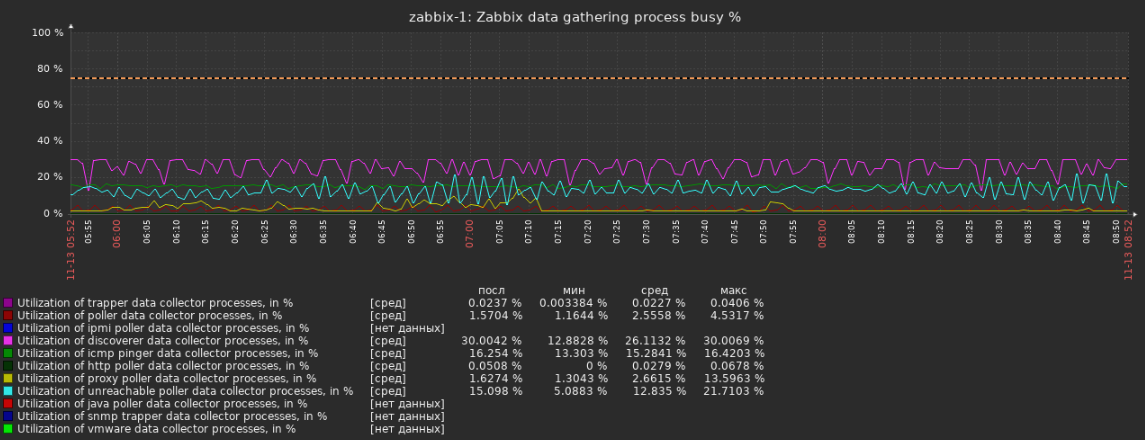
Here is actual |
| Comment by Aigars Kadikis [ 2019 Nov 22 ] |
|
Pollers which are responsible for SNMP data collection are very OK. It's not a solution, but can you try restart backend daemon. Is the problem comes in the very next minutes? Please include a bigger portion of the log file. Any other suspicious lines? Do you monitor devices via a wired connection? Is the "Use bulk requests" checkbox ON in the host configuration page? Please try to uncheck it for all hosts and see if there are some improvements regarding data collection.
Did you upgrade and then registered new nodes. or registred new nodes and hit the upgrade? |
| Comment by Anatoliy Grachev [ 2019 Nov 22 ] |
|
Hi, restart zabbix-server does not help. |
| Comment by Aigars Kadikis [ 2019 Nov 22 ] |
|
And then after awhile even newly discovered hosts will generate problems in the log file? Are you linking some non-stock templates for the hosts which are having problems? please, upload template xml? |
| Comment by Anatoliy Grachev [ 2019 Nov 22 ] |
|
Sorry this turned out to be my mistake. Thank you for help. |