[ZBX-17184] Zabbix Front-end web interface produces memory leak (Dashboard/Problems) Created: 2020 Jan 16 Updated: 2020 Jul 30 |
|
| Status: | Need info |
| Project: | ZABBIX BUGS AND ISSUES |
| Component/s: | Frontend (F) |
| Affects Version/s: | 4.0.15 |
| Fix Version/s: | None |
| Type: | Problem report | Priority: | Trivial |
| Reporter: | Olivier Mas | Assignee: | Kristians Pavars |
| Resolution: | Unresolved | Votes: | 1 |
| Labels: | frontend, memory, memoryleak | ||
| Remaining Estimate: | Not Specified | ||
| Time Spent: | Not Specified | ||
| Original Estimate: | Not Specified | ||
| Attachments: |
|
| Description |
|
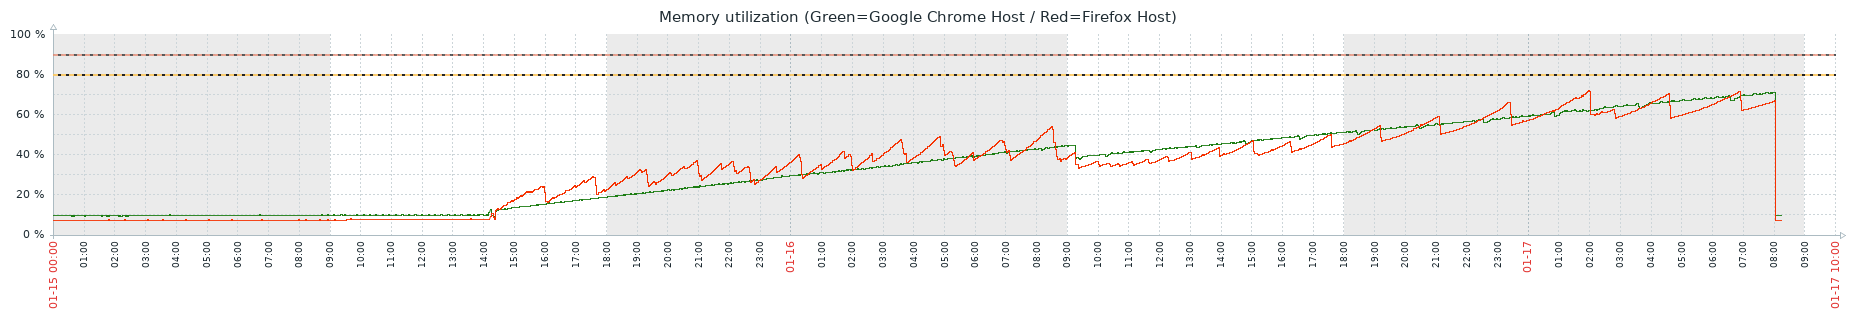
Preamble The problem reported through this ticket is very similar to the ZBX-12821 problem which has been fixed more than a year ago. Context Zabbix version 4.0.15. Google Chrome version 79.0.3945.117. Firefox version 68.3.0. A Zabbix server monitors around 40 hosts. Around 30 of these hosts are shut down which is producing around 30 "Unavailable by ICMP Ping" problems. A dashboard is configured and composed of: a map widget, a map navigation tree widget, a problems widget and 2 graph widgets. The frond-end Zabbix web interface can be reached from the hosts monitored by the Zabbix server. Steps to reproduce:
Result: For both hosts, the memory utilization increases till reaching very high values (see attached screenshot). The memory utilization is calculated for each host by the Zabbix server comparing UCD-SNMP-MIB:memAvailReal and UCD-SNMP-MIB:memTotalReal. The memory utilization can also be checked using the top command on both hosts (see attached screenshots). We observe that chrome and firefox/Web Content processes generate most of the memory utilization. The memory can be released by closing the web browsers on each host. Expected: |
| Comments |
| Comment by Olivier Mas [ 2020 Jan 17 ] |
|
Further information See graph below. Around 9:15 on 16 Jan, the Problems tabs on both hosts have been closed. Only the dashboards were then running on both hosts. It can be observed a tiny release of memory after closing the Problems tabs but most of the memory remain used and the memory utilization continues to increase with only the dashboards running. At 8:00 on 17 Jan, both Firefox and Chrome browsers have been closed, the memory has been released.
|
| Comment by Edgars Melveris [ 2020 Jan 20 ] |
|
Hello Olivier, what OS are those browsers running on? |
| Comment by Olivier Mas [ 2020 Jan 20 ] |
|
Hi Edgars, both are running on CentOS 7.7 |
| Comment by Edgars Melveris [ 2020 Jan 20 ] |
|
Can you add an additional item, proc.mem["processname"] to the hosts? For both, chrome and firefox? |
| Comment by Olivier Mas [ 2020 Jan 21 ] |
|
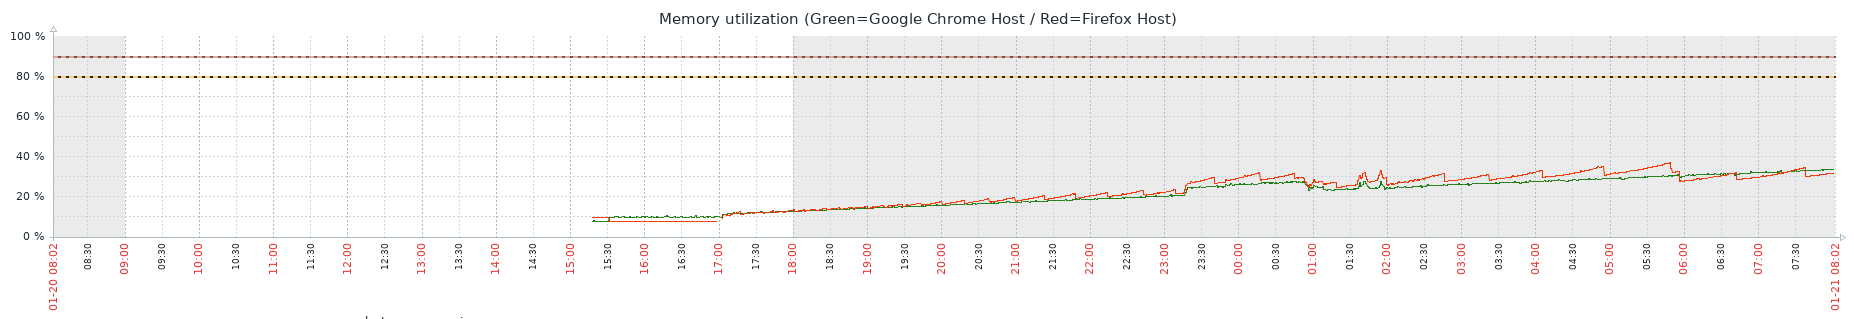
Edgars, this time I only let the dashboard running on both hosts, no additional Problems tabs. We see the same behavior at memory utilization
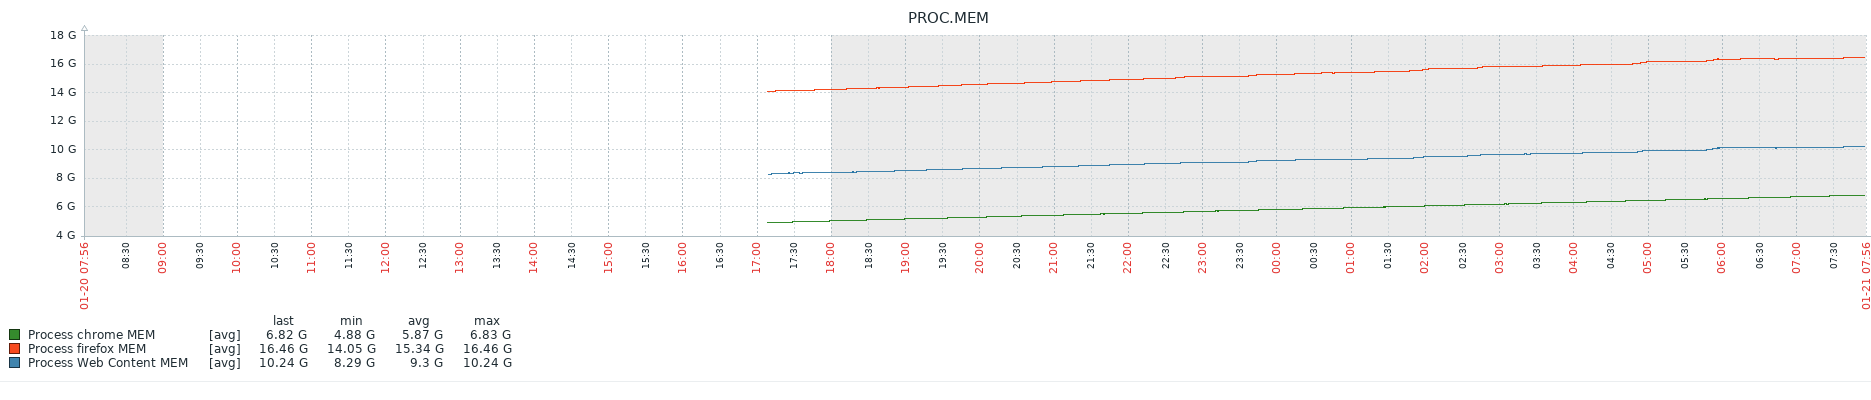
And below the proc.mem graph including chrome process (host 1) and firefox + Web Content processes (host 2)
|
| Comment by Olivier Mas [ 2020 Jan 28 ] |
|
@zux : any news concerning this issue ? Do you need more inputs ? |
| Comment by Olivier Mas [ 2020 Feb 11 ] |
|
@zux : what is the status of this issue ? |
| Comment by Olivier Mas [ 2020 Mar 03 ] |
|
@zux : can you please provide a status about this issue ? The status is "Need Info" for weeks now but the requested information has been provided. I would like to know if you're going to look deeper in this problem or not. Thanks. |
| Comment by Edgars Melveris [ 2020 Mar 11 ] |
|
Hello Olivier, sorry for the long wait. We will try to look into this deeper, but we're currently unable to reproduce the issue. |
| Comment by GuiGuiGui [ 2020 Jun 04 ] |
|
Hello, I can't reproduce at home, but at work, I encounter this kind of problem with all my setups ( 4.4 and 5.0.1 ) and since a few months Browser on Win 10 with different setups ( plugins / installed soft ) I noticed it when I have left a chrome tab on the Monitoring/Dashboard/Global View over night. This chrome tabs end with "not enough memory" when I get back to it. So I created a new Dashboard with only one widget (on the 5.0.1). Widget Problems / Refresh 10 sec (to show the pb faster) / Show History / show lines 100 I went to the "more tools/task manager" within chrome to get the memory consumption of the dashboard tab I also "inspect" the page and went to the "Network tab". I could notice that for every refresh of the widget, 700Kb of data was fetched with zabbix.php?sid=xxxxxxxxxxxx&action=widget.problems.view I could also see a bump in the memory consumption of the tab until the tab crashes over night. I could see this happen with different version of chrome ( version are not older than 3 months ) and different versions of the fronted (4.4+ and 5.0+)
|
| Comment by Kristians Pavars [ 2020 Jun 16 ] |
|
Hi GuiGuiGui
Could you please confirm which webserver are you using for this?
Thanks, |
| Comment by GuiGuiGui [ 2020 Jun 16 ] |
|
Hello, I'm using Apache/2.4.6 (Red Hat Enterprise Linux). Please note I don't have the problem on firefox or Internet Explorer, only chrome 83.0.4103.97 at the moment |
| Comment by Kristians Pavars [ 2020 Jul 13 ] |
|
Hi GuiGuiGui
I'm not sure if this is actually a problem with Zabbix, seems like the browser itself has some memory leak issues. Have you tried other browsers based on Chromium (Brave, new Microsoft Edge)?
Thanks, |
| Comment by Olivier Mas [ 2020 Jul 29 ] |
|
Hello Kristians, I have created this issue few months ago, then exchanged some messages with Edgars Melveris without having any relevant feedback. It looks like you're involved on this issue now. Could you give me the status about the first statement of this issue ? As I explained few months ago, the problem occurs on both Firefox and Google Chrome web browsers which let us think that the problem doesn't come from the web browser but from Zabbix. Thanks for your feedback. |
| Comment by Fabien Roubier [ 2020 Jul 30 ] |
|
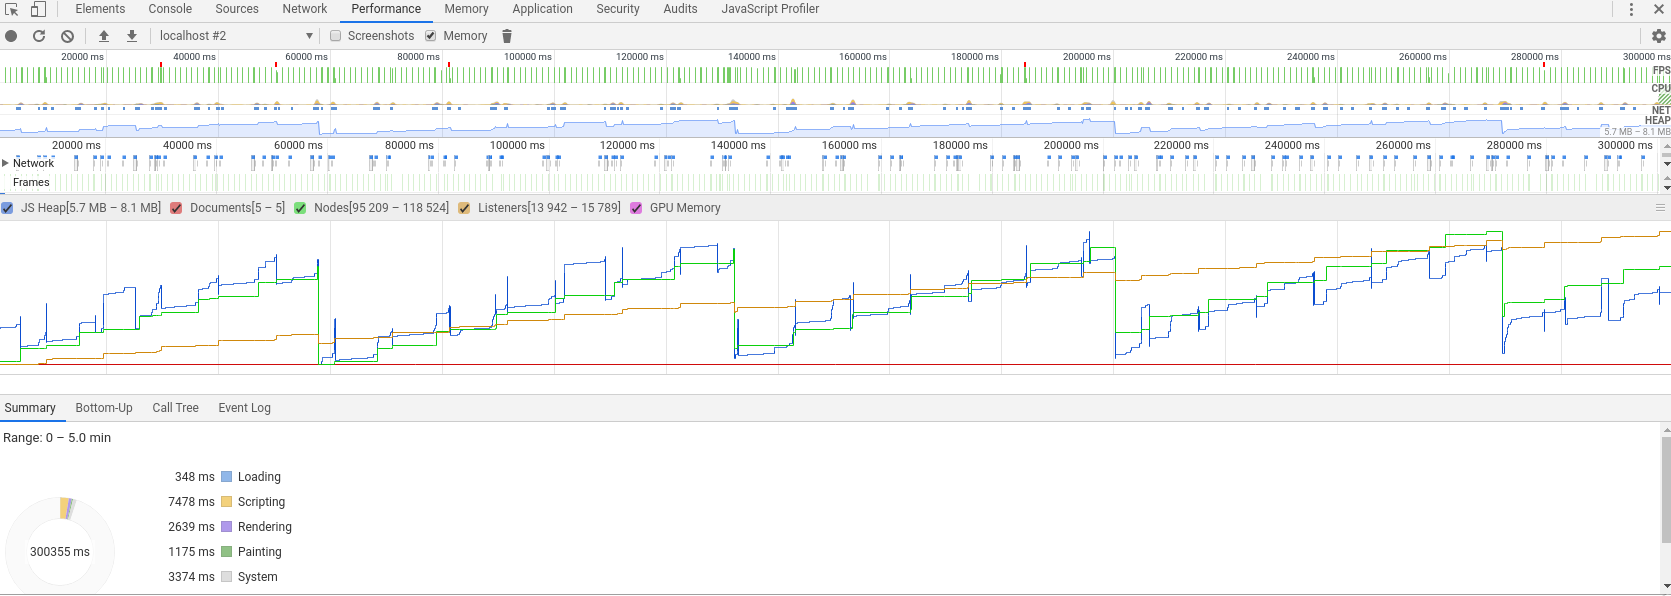
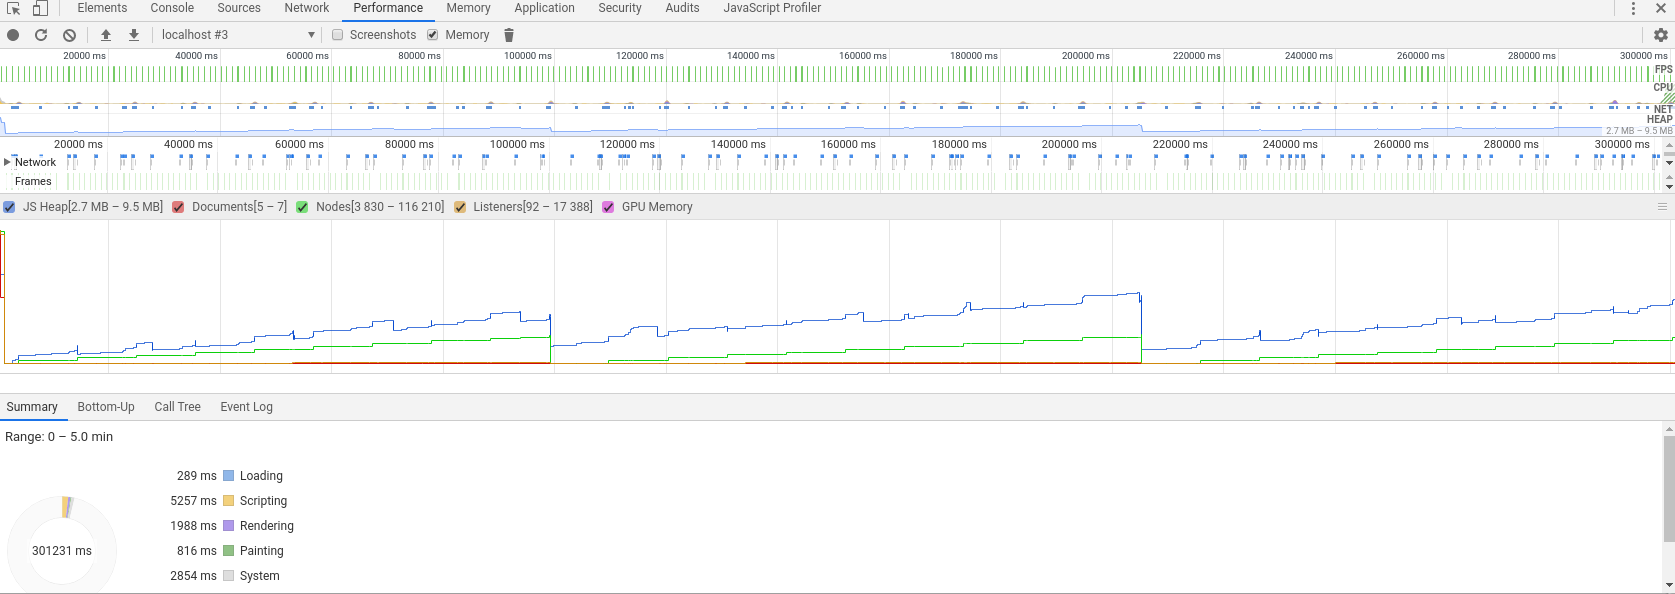
Hi, I have the same problem as described above. I made some test and realized that the problem is gone if I remove the "Map Navigation Tree" Widget from my dashboard. I made some recording with the chrome developer tools. Here is the result with the Navigation Tree Map:
And here without:
I hope it can help to find the root of the problem. Kind regards,
|
| Comment by Fabien Roubier [ 2020 Jul 30 ] |
|
May be something worth to mention: we set the highest refreshing frequency (10 seconds). |