[ZBX-17826] zabbix[vcache,cache,mode] reports "low memory mode" despite <75% of used cache buffer Created: 2020 May 27 Updated: 2024 Apr 10 Resolved: 2020 Jun 30 |
|
| Status: | Closed |
| Project: | ZABBIX BUGS AND ISSUES |
| Component/s: | Server (S) |
| Affects Version/s: | 4.4.8 |
| Fix Version/s: | 5.2 (plan) |
| Type: | Problem report | Priority: | Trivial |
| Reporter: | Marco Hofmann | Assignee: | Marina Generalova |
| Resolution: | Fixed | Votes: | 0 |
| Labels: | None | ||
| Remaining Estimate: | Not Specified | ||
| Time Spent: | Not Specified | ||
| Original Estimate: | Not Specified | ||
| Environment: |
Debian 10 Buster amd64 |
||
| Attachments: |
|
| Team: | |
| Sprint: | Sprint 65 (Jun 2020) |
| Description |
|
Steps to reproduce:
Result: Temporary spike:
zabbix[vcache,cache,mode]
Expected: |
| Comments |
| Comment by Vladislavs Sokurenko [ 2020 May 27 ] |
|
There should have been additional information in the log after |
| Comment by Marco Hofmann [ 2020 May 27 ] |
|
I copied the first occurrence and several afterwards, is that enough? Zabbix Server has 32GB RAM and config is -> ValueCacheSize=512M |
| Comment by Vladislavs Sokurenko [ 2020 May 27 ] |
|
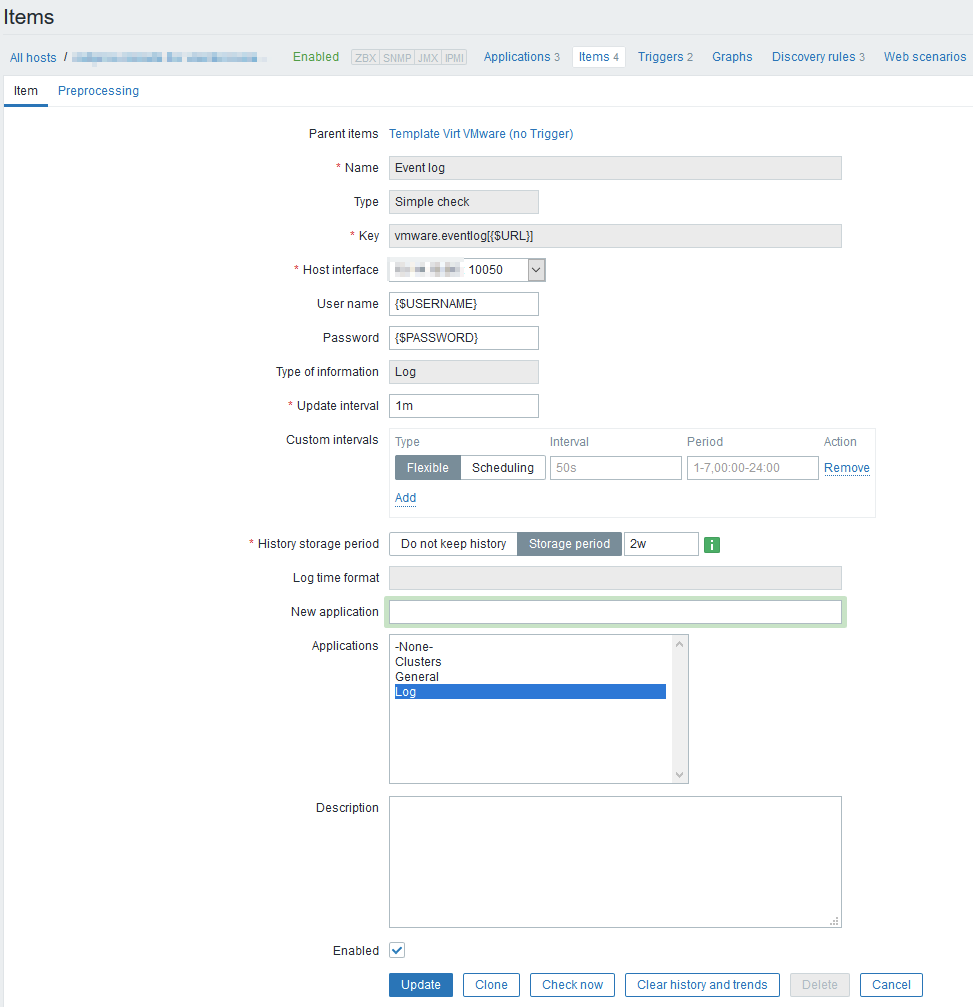
This item seems suspicious as it has 490489 values cached: Please try checking configuration of that item, it has 17 values per second and is cached for 8 hours worth of data, is that expected config ? |
| Comment by Marco Hofmann [ 2020 May 27 ] |
|
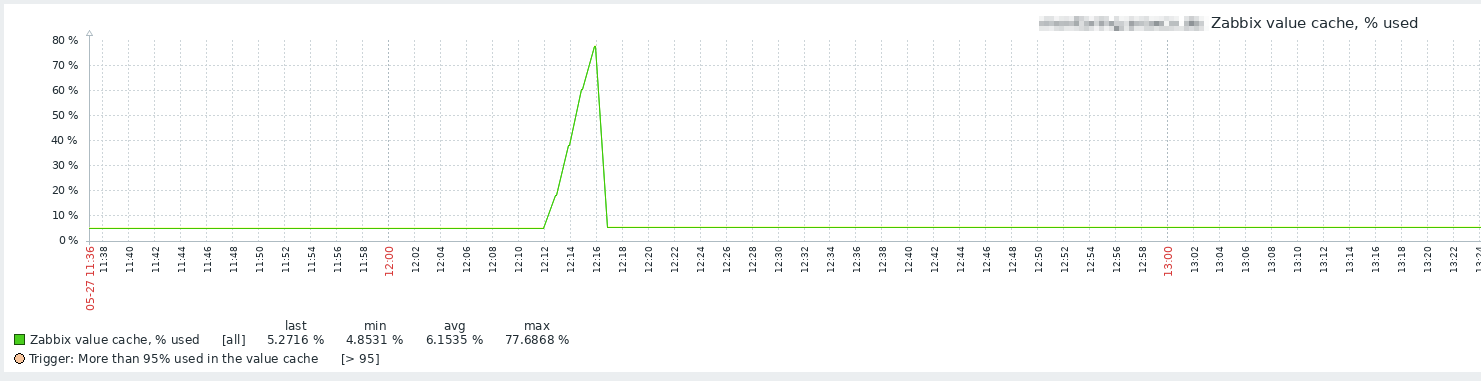
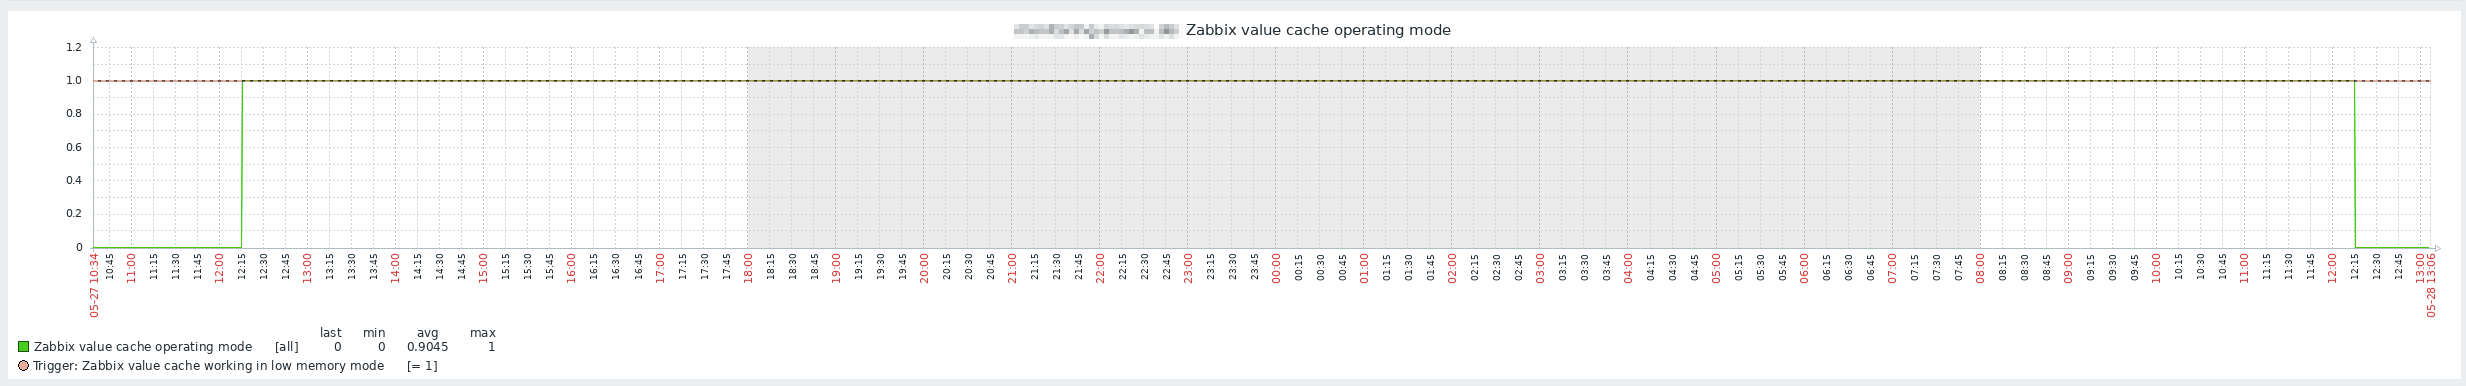
It is an VMware vCenter Evenlog item, that didn't work the past months. Maybe you saw my monologue in the Telegram Group, I summarize it for you: "I have one Zabbix Proxy. where the DB regulary grows to about 10GB or more. This is not a huge customer. 17 Windows Hosts, VMware Cluster = 62 NVPS." Since that moment, the VMware template started working again and that is also the temporary increase in the value cache we see in the first screenshot. BUT this item is only mentioned once in the log file I posted. Never again in all subsequent log entries I posted. It also fits timely exactly to the first graph, where we have a huge spike, which then drops immediately. The logs second that. But the "low memory mode" still stays on. EDIT: I forgot the screenshot of the item: |
| Comment by Vladislavs Sokurenko [ 2020 May 27 ] |
|
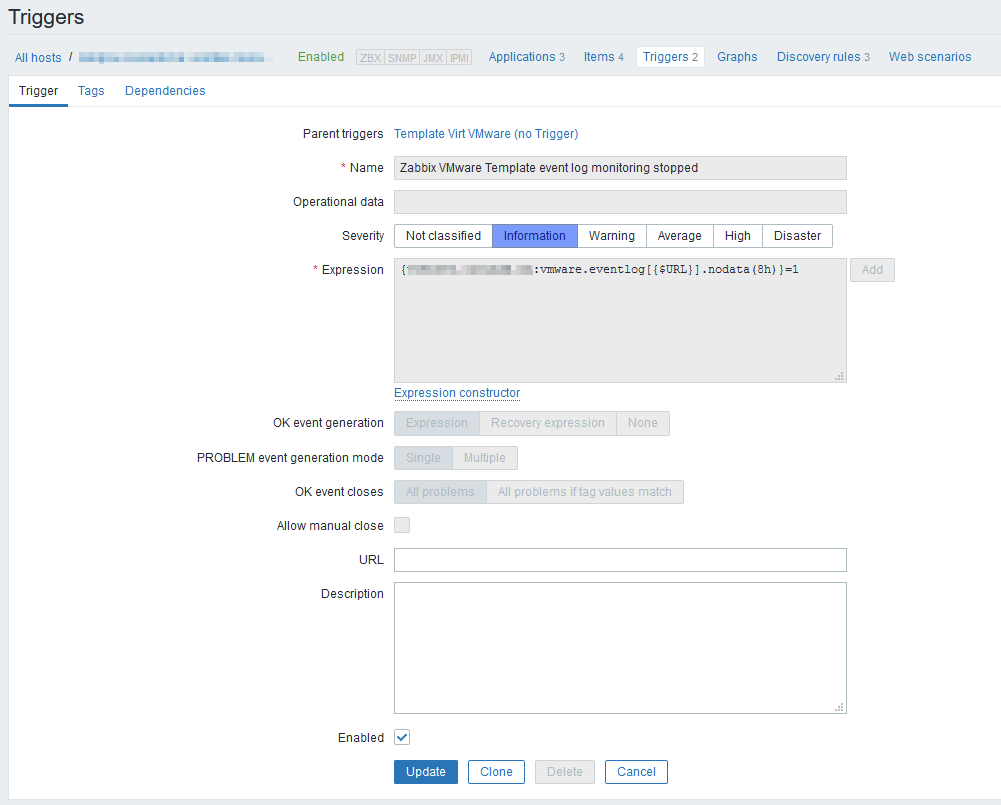
value cache is used for trigger, please attach screenshot of trigger |
| Comment by Marco Hofmann [ 2020 May 27 ] |
|
I only have a nodata trigger for the eventlog:
|
| Comment by Vladislavs Sokurenko [ 2020 May 27 ] |
|
Try removing it and see if it helps |
| Comment by Marco Hofmann [ 2020 May 27 ] |
|
AFAIK I can't simply delete a templated trigger. Would disabling be sufficient? But to be honest, I'm a bit confused that we ignore the fact, that this was only once in the log, and since then the debug infos are quite ok, as the graph is. |
| Comment by Marco Hofmann [ 2020 May 28 ] |
|
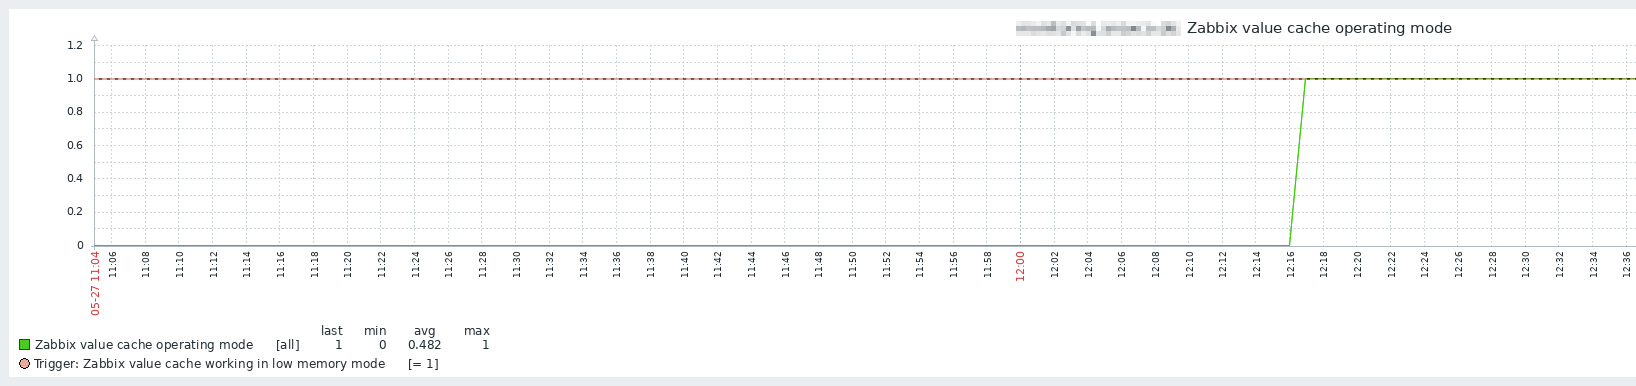
Excatly 24h later, the item value went back to 0 and the trigger to OK. Is this an expected behavior?
|
| Comment by Vladislavs Sokurenko [ 2020 May 28 ] |
|
Yes, low memory is reset every 24 hours but the root cause of out of memory is eventlog item with nodata trigger. |
| Comment by Marco Hofmann [ 2020 Jun 02 ] |
|
Thanks for updating this issue to Need info. What question didn't I answer sufficiently? In fact, I have more questions than before: In my very first screenshot, we see a spike that was there for about 4 minutes. That triggered the value cache operating mode for 24 hours. If this is an expected behavior, then this issue can be closed, as everything works as advertised. If this is true, then it's just me wondering, why this trigger is active for 24h. BUT if this trigger should go back to zero in <24h then this issue here is still relevant. Please don't get me wrong. I fully understand why my % value cache used went up. And we can all see that it went down again a few minutes later. |
| Comment by Vladislavs Sokurenko [ 2020 Jun 09 ] |
|
This is expected behavior and should be documented that value cache will remain in low memory mode for 24 hours. |
| Comment by Marco Hofmann [ 2020 Jun 09 ] |
|
Thank you very much for your answer! Then this issue is solved from my perspective. But it should be considered to change this issue to a documentation issue IMHO. Anything else I can do here? Or do I have to create a new issue for the documentation task? |
| Comment by Marina Generalova [ 2020 Jun 17 ] |
|
I have added a note to the item description in supported versions. Documentation updated: |