|
Duplicate |
|||
| duplicates |
|
Widget Problems : very bad request ex... | Closed |

[ZBX-17866] Problem by severity dashboard widget is slow for installations with lot of history data Created: 2020 Jun 03 Updated: 2024 Apr 10 Resolved: 2021 May 20 |
|
| Status: | Closed |
| Project: | ZABBIX BUGS AND ISSUES |
| Component/s: | Frontend (F) |
| Affects Version/s: | 5.0.1, 5.2.0alpha1 |
| Fix Version/s: | 6.0 (plan) |
| Type: | Problem report | Priority: | Trivial |
| Reporter: | Gregory Chalenko | Assignee: | Zabbix Development Team |
| Resolution: | Duplicate | Votes: | 5 |
| Labels: | dashboard, problemsbyseverity, widget | ||
| Remaining Estimate: | Not Specified | ||
| Time Spent: | Not Specified | ||
| Original Estimate: | Not Specified | ||
| Environment: |
os version: ubuntu 18.04.4 |
||
| Attachments: |
|
||||||||
| Issue Links: |
|
||||||||
| Team: | |
||||||||
| Sprint: | Sprint 65 (Jun 2020), Sprint 66 (Jul 2020), Sprint 67 (Aug 2020), Sprint 68 (Sep 2020), Sprint 69 (Oct 2020), Sprint 70 (Nov 2020), Sprint 71 (Dec 2020), Sprint 72 (Jan 2021), Sprint 73 (Feb 2021), Sprint 74 (Mar 2021), Sprint 75 (Apr 2021), Sprint 76 (May 2021) | ||||||||
| Description |
|
Steps to reproduce:
Result: |
| Comments |
| Comment by James Kirsop [ 2020 Jul 24 ] |
|
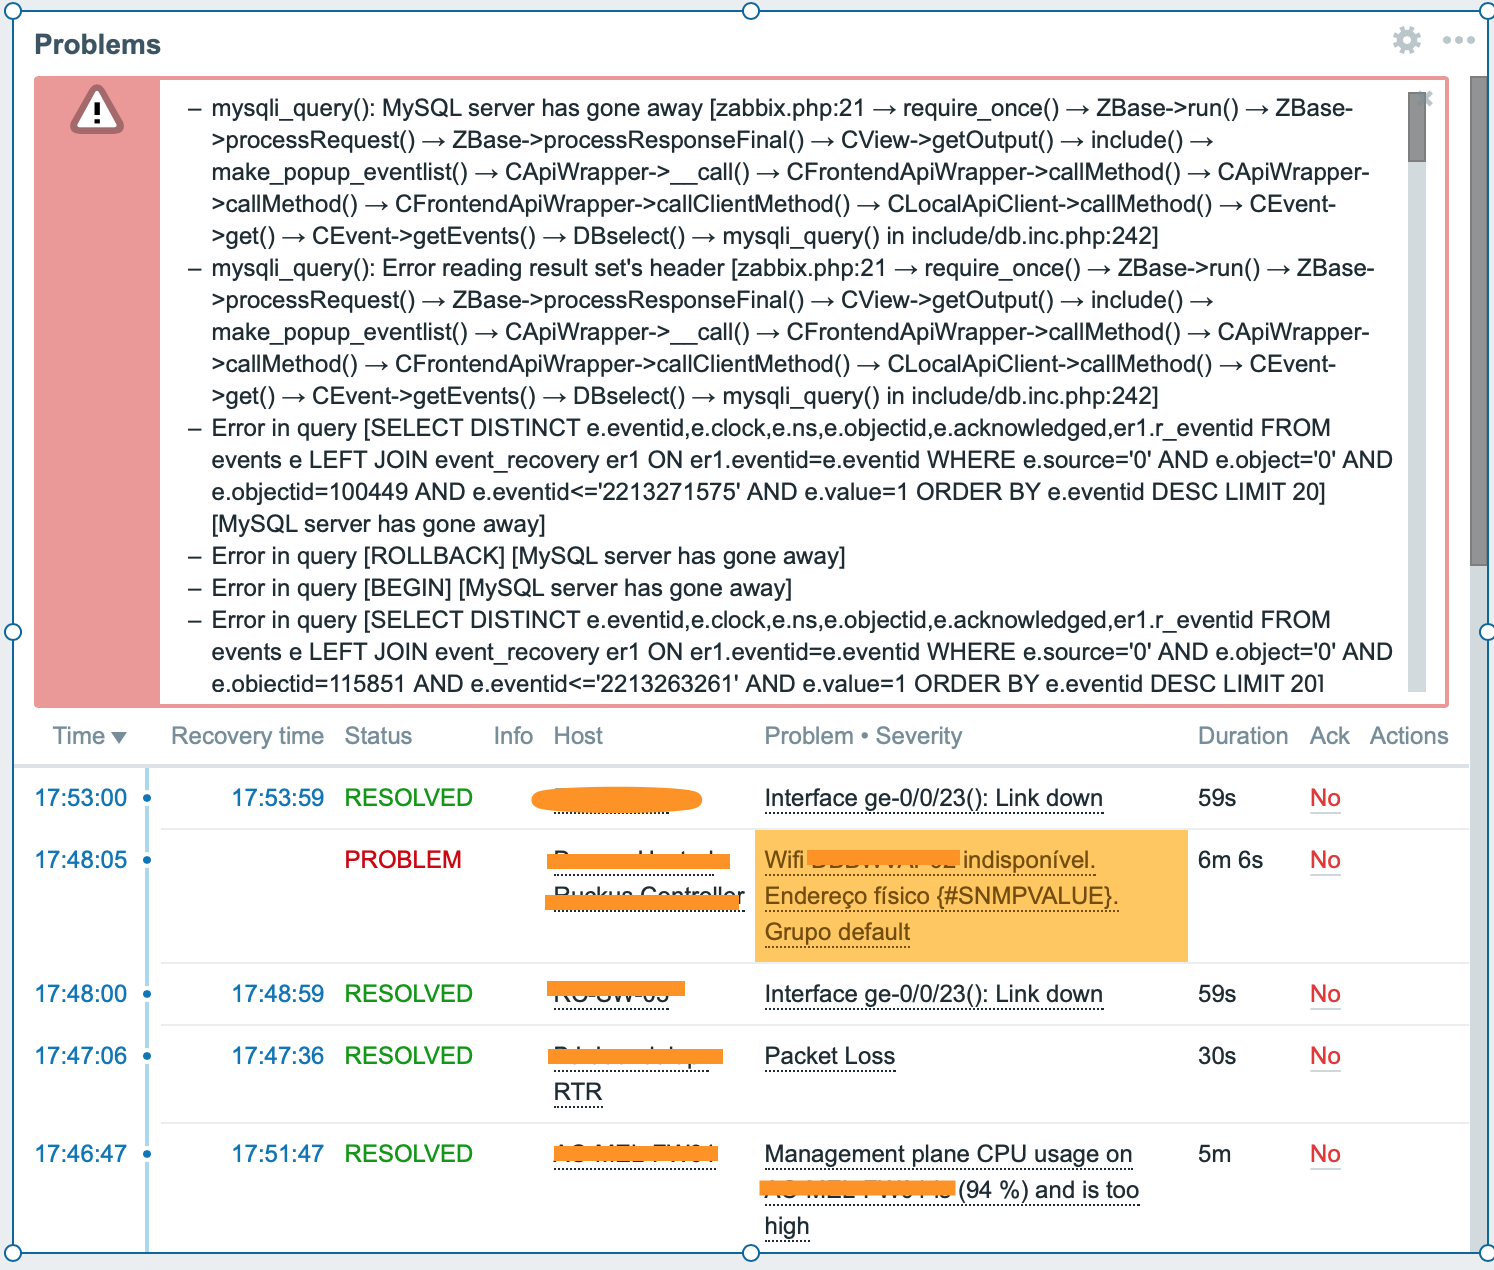
I'm also having a similar problem and an possible cause of the issue is that a query like the below, hangs around for hours in show processlist: SELECT DISTINCT e.eventid,e.clock,e.ns,e.objectid,e.acknowledged,er1.r_eventid FROM events e LEFT JOIN event_recovery er1 ON er1.eventid=e.eventid WHERE e.source='0' AND e.object='0' AND e.objectid=100449 AND e.eventid<='2213239615' AND e.value=1 ORDER BY e.eventid DESC LIMIT 20 In my testing, this query occurs when I load the default 5.0 dashboard with the Problems widget and not in only other circumstances (though I'd imagine if I created problem widgets elsewhere it would reappear). If I kill the query from from the MySQL shell the 'Problems' dashboard widget loads with correct data, but an error at the top: From my perspective, the long running query doesn't actually add anything because killing it still produces valid (and as far as I can tell, correct) widget data. I've seen variations on the above query try and return results for 7 hours and still continue to run. This means that the widget never correctly loads, and the MySQL server gets clogged up executing queries with no perceivable value. If I pull the ORDER BY from the statement, the query returns quickly. What is also interesting in my situation, is that the query has LIMIT 20 but the widget config defaults to limiting to 25 results, and changing the sort order in the Widget configuration has no bearing on the ORDER BY statement in the above query that runs only when the Problem widget is requested - even though it doesn't actually seem to be useful in returning results. Server and Database Info
The severity of this problem on my instance is far greater than 'trivial' - which is what this issue is marked as at the moment. I've documented the severe performance issues that this problem inflicts over at the Zabbix support forums: https://www.zabbix.com/forum/zabbix-troubleshooting-and-problems/405341-performance-issues-after-zabbix-5-0-and-mariadb-upgrade |
| Comment by James Kirsop [ 2020 Aug 03 ] |
|
This bug report should be at a higher priority than `Trivial`. On my reasonably sizeable installation, using the Problems widget on a dashboard renders my Zabbix installation as incredibly unstable due to the long running queries that queue up every time someone opens a dashboard (which we appreciate greatly as a feature). As mentioned in the link in my previous post Zabbix proxies regularly fall offline, and we see numerous other issues when these queries (isolated to the Problems widget) are stacked. The continued delay of resolving this means that we are unable to use the Problems widget, removing a piece of functionality that I'm sure others would also find helpful should they encounter this issue and have to do likewise. Since disabling the Problems widget, I've not encountered any of the performance issues we were previously seeing after our upgrade to 5.x from 4.0. |
| Comment by Alexander Vladishev [ 2020 Aug 03 ] |
|
This SQL statement is used to create pop-ups that appear when you hover the mouse over a description of the problem. Workaround - to comment these lines in the app/views/monitoring.widget.problems.view.php:187 ->setHint(
make_popup_eventlist(['comments' => $problem['comments'], 'url' => $problem['url'],
'triggerid' => $trigger['triggerid']], $eventid, $show_timeline, $data['fields']['show_tags'],
$data['fields']['tags'], $data['fields']['tag_name_format'], $data['fields']['tag_priority']
)
)
Please add more information to this ticket to help us resolve this issue:
|
| Comment by Alexander Vladishev [ 2020 Aug 03 ] |
|
Currently I cannot reproduce this issue with our test environment:
MySQL 5.5.62. SQL execution time: |
| Comment by James Kirsop [ 2020 Aug 04 ] |
The following is an extract of the output of: Please let me know if you require more tables. CREATE TABLE `events` (
events: 769886548 rows / 116.7GB
Tables are not partitioned (I've not had a need to do this yet, Zabbix has been performing well until I encountered this issue) |
| Comment by Alexander Vladishev [ 2020 Aug 04 ] |
|
Thanks! A similar problem is described in Also will be very useful information about execution time of these SQL statements:
|
| Comment by James Kirsop [ 2020 Aug 06 ] |
|
I've patched the changed files in that branch and are seeing slightly different results from `show processlist`: | 3181845 | root | localhost | zabbix_prod | Query | 1475 | Sending data | SELECT DISTINCT e.eventid,e.clock,e.ns,e.objectid,e.acknowledged,er1.r_eventid FROM events e LEFT JO | 0.000 | | 3186551 | zabbix_web | localhost | zabbix_prod | Query | 40 | Creating sort index | SELECT e.eventid,e.clock,e.ns,e.objectid,e.acknowledged,er1.r_eventid FROM events e LEFT JOIN event_ | 0.000 |
The good news is that the problems widget loaded after approximately 2-3 minutes of the 2nd query executing/page load. Previously this widget would never load in a timely fashion, so I do consider this an improvement. Subsequent widget updates/refreshes (without refreshing the page) seem to update in about 10-15 seconds. On a subsequent entire page refresh (at the browser level) the problems widget loads within a few seconds! The improved SQL statement above executed at the mysql CLI with the following output: `20 rows in set (0.65 sec)` As seen in my process list dump above, the 'original' query is still running (and I would expect it to take anywhere from 6-12 hours to execute based on some rough analysis I've done in the past). I'll to kill the query process because otherwise the server becomes burdened with trying to execute it. I think these patches have resolved my issue at the moment, but I'll keep a close eye on the performance of the server over the next few days to ensure that some of the associated performance issues we had don't crop up again. |
| Comment by James Kirsop [ 2020 Aug 26 ] |
|
This patch appears to have resolved nearly all my performance issues. I believe it's been included in 5.0.3 and so this issue can likely be closed. |
| Comment by Alexander Vladishev [ 2020 Aug 27 ] |
|
This patch already included in 5.0.3. Thank you! |
| Comment by Alexander Vladishev [ 2021 May 20 ] |
|
Closed as duplicate of |