[ZBX-17911] nodata(24h)=0 trigger starts alerting after zabbix-server restart Created: 2020 Jun 15 Updated: 2020 Dec 07 |
|
| Status: | Reopened |
| Project: | ZABBIX BUGS AND ISSUES |
| Component/s: | None |
| Affects Version/s: | 5.0.1 |
| Fix Version/s: | None |
| Type: | Problem report | Priority: | Trivial |
| Reporter: | Taavi Uibo | Assignee: | Zabbix Support Team |
| Resolution: | Unresolved | Votes: | 1 |
| Labels: | pending | ||
| Remaining Estimate: | Not Specified | ||
| Time Spent: | Not Specified | ||
| Original Estimate: | Not Specified | ||
| Environment: |
text, log, str are stored in Elasticsearch |
||
| Attachments: |
|
| Description |
|
After restarting Zabbix server all triggers that have nodata(24h)=0 start alerting and only way is to close the problems until zabbix-server is restarted again. It is kind of related to https://support.zabbix.com/browse/ZBX-17422 since the error in the trigger page is the same:
I understand, that this problem should go OK after 24h, but the problem started after ugprading from Zabbix 4.4.6 -> 5.0.1. In 4.4.6 there were no such problems after restarting Zabbix server so is this a new feature or a bug?
|
| Comments |
| Comment by Kristians Pavars [ 2020 Jun 15 ] |
|
Hi taavi60,
According to documentation this is the intended functionality as described https://www.zabbix.com/documentation/current/manual/appendix/triggers/functions Note that this function will display an error if, within the period of the 1st parameter: - there's no data and Zabbix server was restarted - there's no data and maintenance was completed - there's no data and the item was added or re-enabled Errors are displayed in the Info column in trigger configuration.
You could probably construct a more complex trigger argument that would also check the uptime of Zabbix Server process and compare it to nodata expression time using Linux commands and custom user parameter and only fire the trigger when both are true. root@zbx50:~# pidof zabbix_server -s 20212 root@zbx50:~# ps -p 20212 -o etimes | tr -d "[:blank:]" | grep -v 'ELAPSED' 392
Please be advised that this section of the tracker is for bug reports only. The case you have submitted can not be qualified as one, so please reach out to [email protected]
Regards,
|
| Comment by Mihkel Soomere [ 2020 Jun 15 ] |
|
I'm a collegue of Taavi (he is responsible for general Zabbix, I manage affected hosts and templates). I think you misunderstood the problem. Trigger going into error state is not the problem, that is fine and and known (for example activated nodata trigger will not clear automatically after Zabbix server restart). The real problem is that the trigger activates when the item has still no data stored. This example item/trigger should activate when data is found. However it activates even without any data - history is totally empty (this event is about NTFS corruption that has never happened), but when Zabbix server is restarted, the trigger immediately activates. AFAIK trigger going into error state should not activate the trigger. |
| Comment by Kristians Pavars [ 2020 Jun 15 ] |
|
Hi Mikhel,
Can you please attach screenshots of your trigger configuration? And also with your latest data for the item in question?
I will try to replicate and find out if this is the intended functionality or a bug.
Thanks, |
| Comment by Mihkel Soomere [ 2020 Jun 15 ] |
|
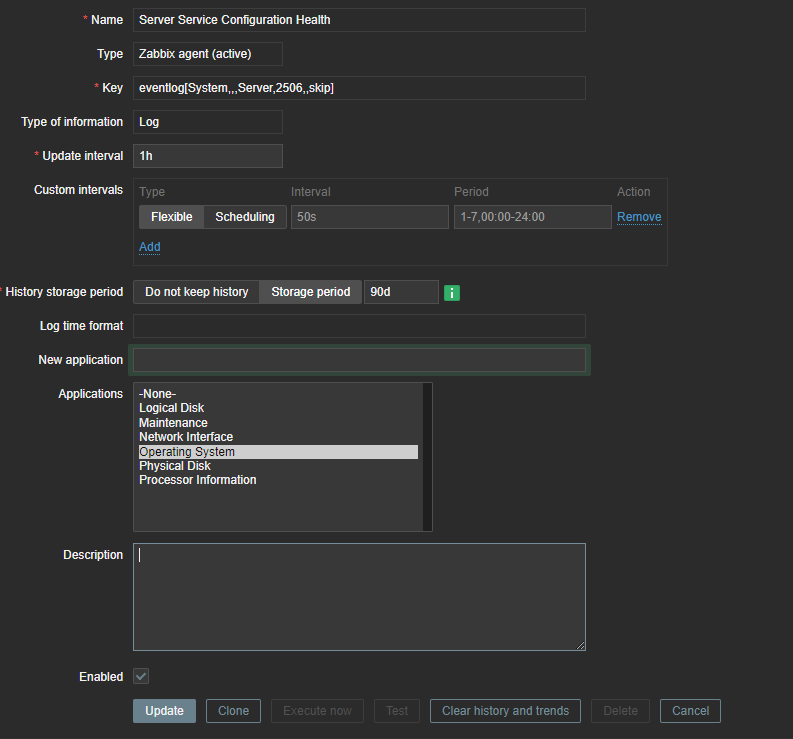
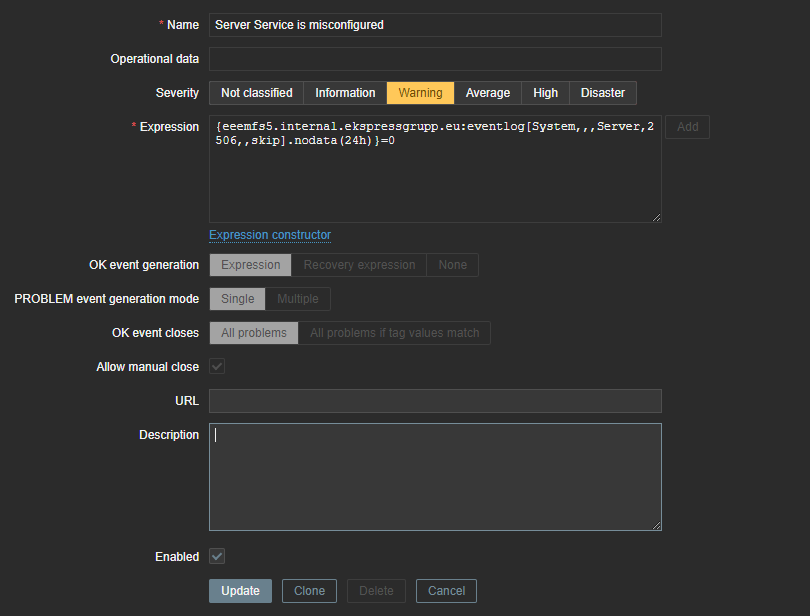
Taavi didn't pick the best example as the original trigger also has a regex check. I chose a very similar one that uses nodata only (minimal test case). Item configuration (templated, no preprocessing):
Trigger configuration:
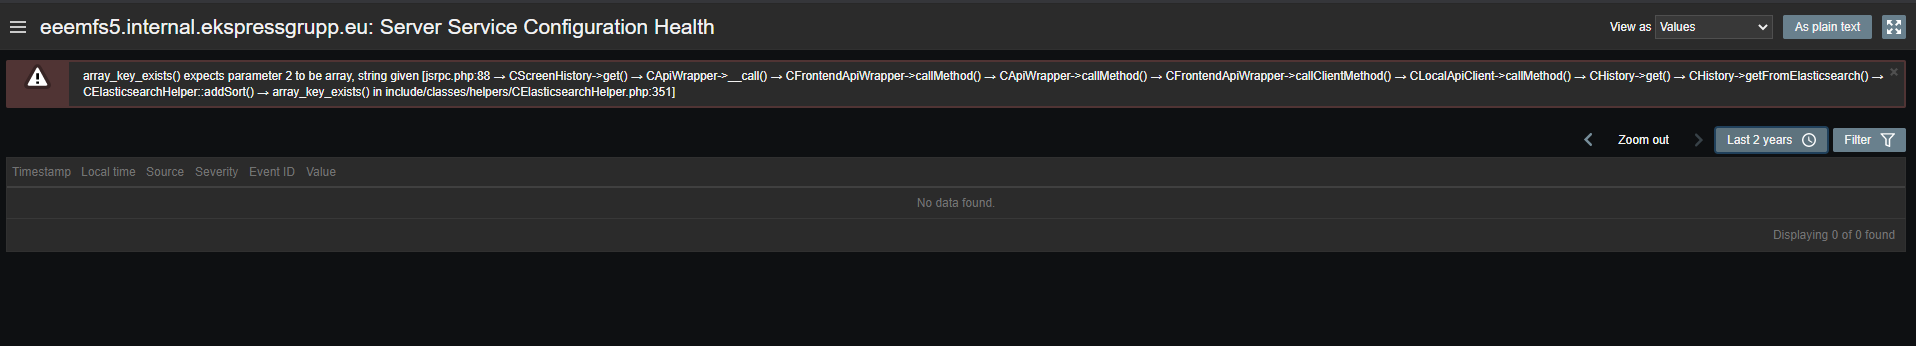
History (the error is an apparently harmless one pending fix in 5.0.2 https://support.zabbix.com/browse/ZBX-17782):
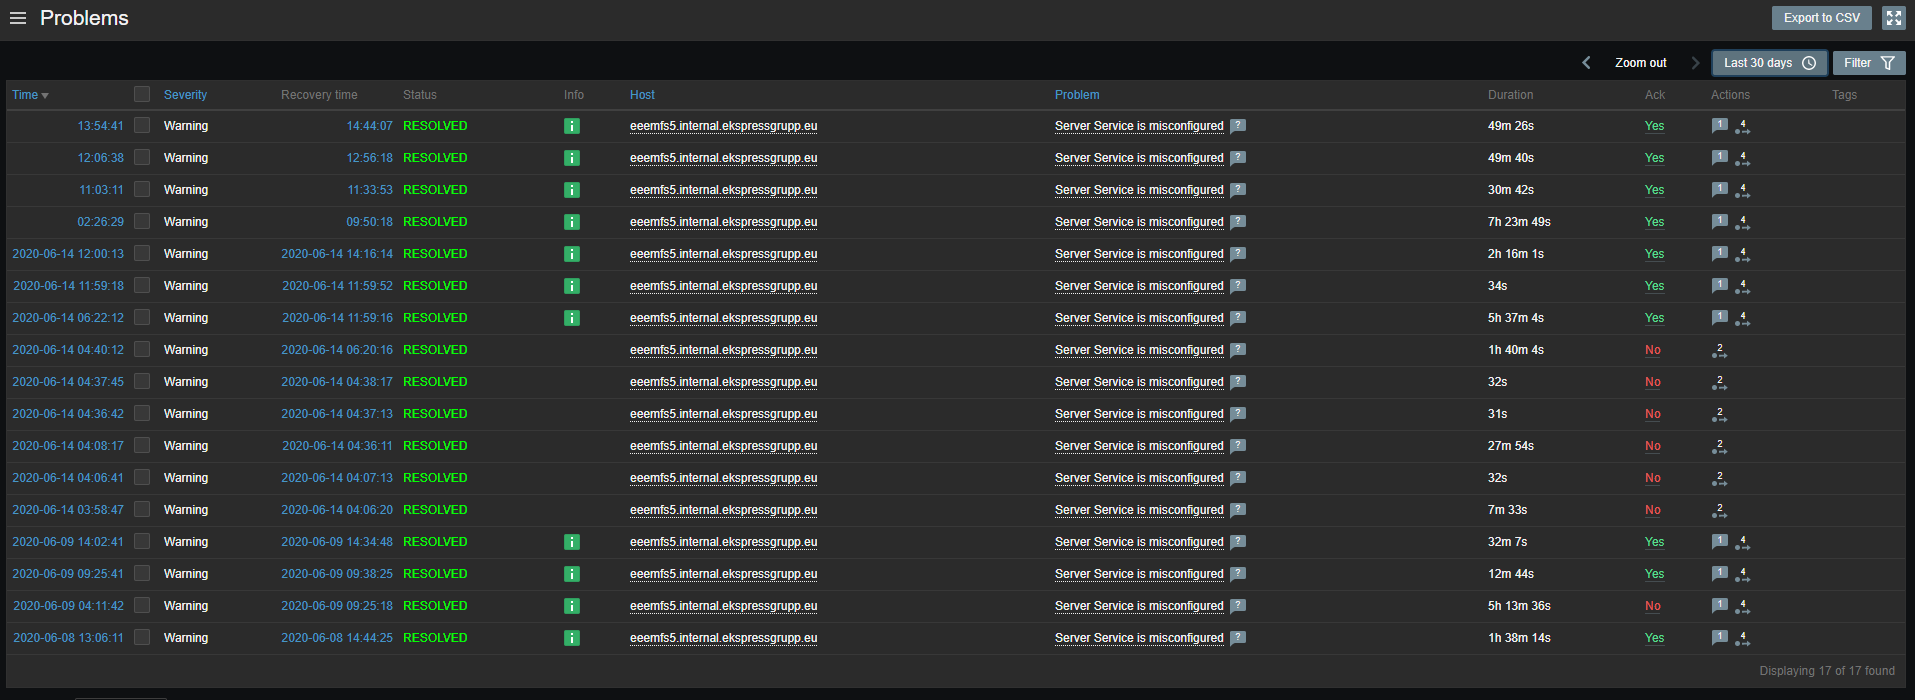
Problem history (some are real Zabbix restarts, some are unrelated configuration problems resulting in Zabbix restarts - all since upgrade to Zabbix 5.0; filter is hidden but it's filtered down to this specific trigger):
Some logic behind this check. Windows can have quite a few fault scenarios that are only logged to Event Log. However for some conditions there is no corresponding event to check if the issue has been resolved. So I check hourly for event indicating the fault condition. If data is ever found, it should activate the trigger (mostly it's very rare). However as there is never an event for clearing the condition, I just let it automatically close itself after 24 hours, unless a new faulting event is found. This used to work fine until Zabbix 5.0 - with the exception that Zabbix restart would cause the error state for normally activated triggers (that had real data) and you'd have to close them manually. That's understood and generally not a problem, as it requires manually closing maybe a few problems. Now I get notification flooded after every Zabbix restart and have to manually close hundreds to thousands of problems. The example is inspired by this SCOM's check https://systemcenter.wiki/?GetElement=Microsoft.Windows.Server.10.0.OperatingSystem.ServerServiceConfiguration.Rule&Type=Rule&ManagementPack=Microsoft.Windows.Server.2016.Monitoring&Version=10.0.8.0 |
| Comment by Kristians Pavars [ 2020 Jun 16 ] |
|
I wasn't able to reproduce this issue on Zabbix Server 5.0.1 with Zabbix Agent 5.0.1, after server restart the problem doesn't appear. I can see that the trigger does go into error state as stated, but it resolves after the time has passed and while in error state, it didn't generate any problems.
No problems:
Are you compiling from source/ using packaged version? What OS is your Zabbix server?
Thanks,
|
| Comment by Taavi Uibo [ 2020 Jun 16 ] |
|
We are using alpine zabbix docker images and text, log, str are stored in Elasticsearch
In our case the Value column goes to PROBLEM state also in trigger and resolves after the amount of time passes. Could it be a bug with using elasticsearch for storing log,str,text values?
|
| Comment by Kristians Pavars [ 2020 Jun 17 ] |
|
Hi taavi60
It could be a problem with Elasticsearch as it's support is still in experimental state, you can read more in documentation: https://www.zabbix.com/documentation/current/manual/appendix/install/elastic_search_setup
I will try to find out if this is the expected behavior.
Thanks, |
| Comment by Kristians Pavars [ 2020 Jun 22 ] |
|
Hi Taavi,
I wasn't able to find out much. I would suggest you to try with one of the supported databases (mysql, postgersql) for storage and see if you are experiencing the same features. Since Elasticsearch support is experimental feature, we can't help much here. I would suggest going the traditional route, that way you can figure out if the problem is Elasticsearch related.
Thanks, |
| Comment by Kristians Pavars [ 2020 Jul 02 ] |
|
Hi taavi60
There has been some time since last update on this ticket, can we assume that this ticket can be closed?
Did you manage to try out regular DB for text data storage and did you notice the same issue there?
Thanks, |
| Comment by Taavi Uibo [ 2020 Oct 14 ] |
|
Sorry for such a long delay - we managed to switch from elasticsearch back to mysql and the problem persists with MySQL also |
| Comment by Thiago Leão Melo [ 2020 Dec 07 ] |
|
I think it is related to same issue of it:
https://support.zabbix.com/browse/ZBX-18418
|