[ZBX-18217] Random Breaks in Dashboard Data View Created: 2020 Aug 07 Updated: 2020 Sep 23 Resolved: 2020 Aug 31 |
|
| Status: | Closed |
| Project: | ZABBIX BUGS AND ISSUES |
| Component/s: | Frontend (F) |
| Affects Version/s: | 4.0.23, 5.0.2 |
| Fix Version/s: | None |
| Type: | Problem report | Priority: | Trivial |
| Reporter: | Josh W | Assignee: | Renats Valiahmetovs (Inactive) |
| Resolution: | Workaround proposed | Votes: | 0 |
| Labels: | None | ||
| Remaining Estimate: | Not Specified | ||
| Time Spent: | Not Specified | ||
| Original Estimate: | Not Specified | ||
| Environment: |
RHEL7 Server, AWS Aurora DB (MySQL v5.7.12) |
||
| Attachments: |
|
| Description |
|
This issue is present in versions 4.2.8 & 5.0.2. There are random breaks in the data view of certain dashboards, wherein the colour-coded set of items being monitored does not appear (see attachsments for typical case). If you hover over parts where breaks in the graph occur, you are still able to see values for the items being monitored. Also, there are no breaks in 'Latest View' for any of the collected data (items) that populate the dashboard. Adjusting the time interval view has no impact on the problem. It appears to occur in dashboards where there are >4 items being displayed. Dashboards pulling in less data do not appear to be affected. There are no log errors for any of the items that populate the problem dashboards.
|
| Comments |
| Comment by Alexander Vladishev [ 2020 Aug 09 ] |
|
Could you attach screenshots of the configuration of these items including preprocessing tab. |
| Comment by Josh W [ 2020 Aug 10 ] |
|
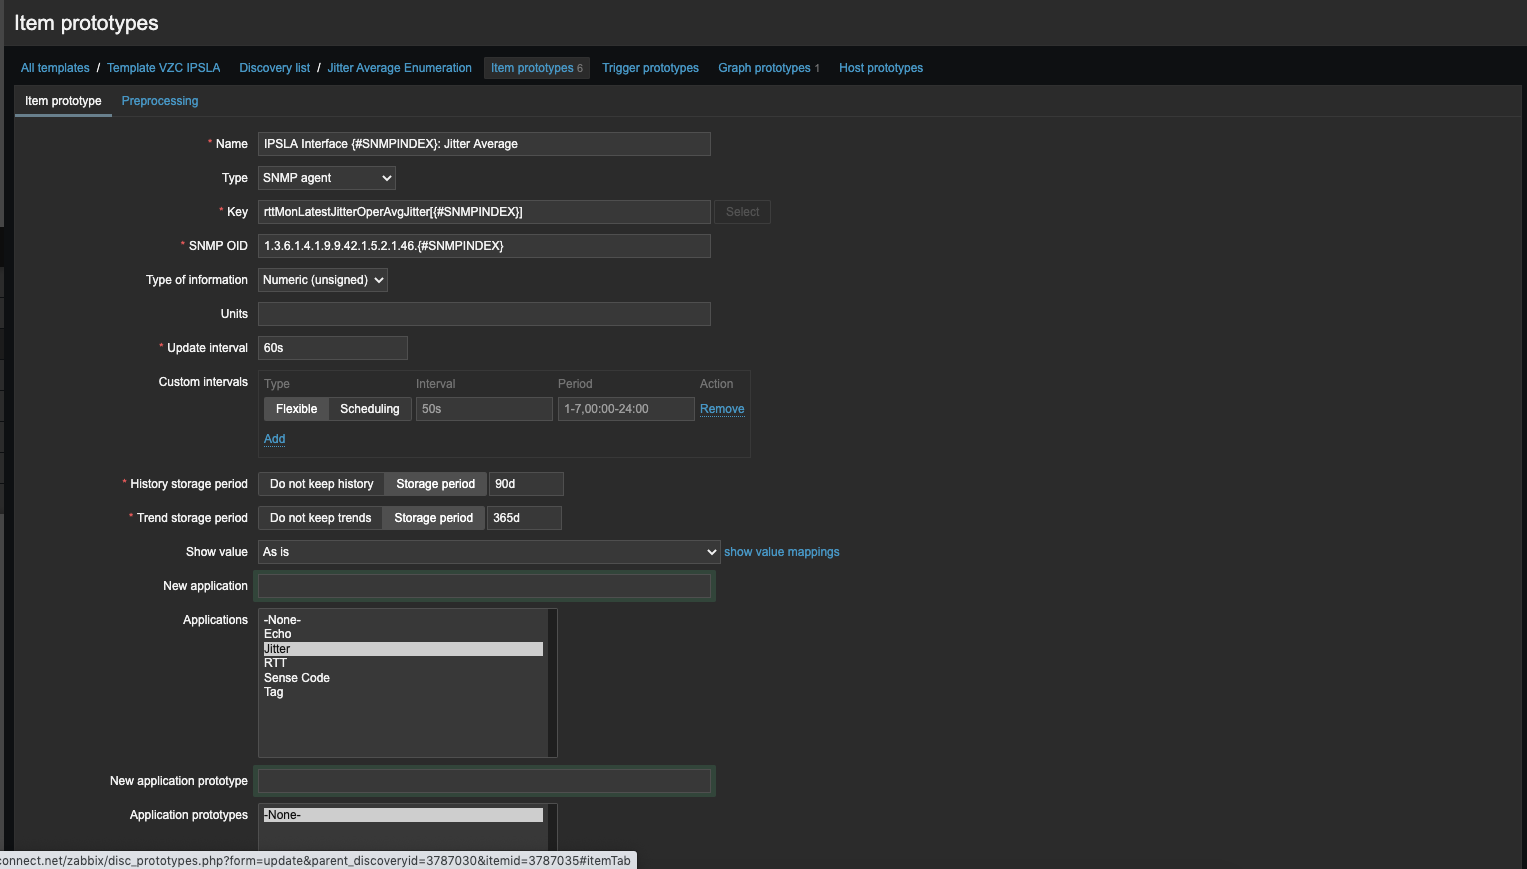
Hello - please see attached. All the items in the problem graphs are item prototypes. They're all configured identically; I've included the prototype for "Jitter Average" as an example. As you can see, no preprocessing has been applied:
|
| Comment by Josh W [ 2020 Aug 31 ] |
|
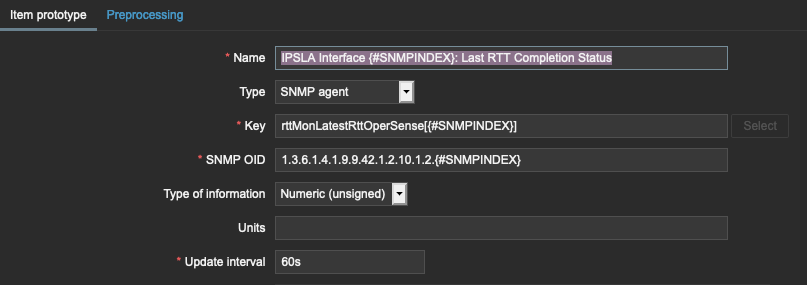
Looks like the problem was with two of the IPSLA monitoring item prototypes (screenshots). I was able to remedy by disabling these monitoring items then removing/re-adding all the hosts that the item prototypes were applied to. Just removing the items and waiting for discovery to iterate did not fix the problem; the hosts had to be removed and added in again. This is the only problem of this sort I've encountered across hundreds of thousands of monitoring items. Closing this issue, although the root cause has not been determined.
|
| Comment by Josh W [ 2020 Aug 31 ] |
|
Root cause unclear - workaround applied. See comments. |