[ZBX-18390] zabbix-agent2 "driver: bad connection" on MySQL check Created: 2020 Sep 18 Updated: 2021 Mar 05 |
|
| Status: | Need info |
| Project: | ZABBIX BUGS AND ISSUES |
| Component/s: | None |
| Affects Version/s: | 5.0.3 |
| Fix Version/s: | None |
| Type: | Problem report | Priority: | Trivial |
| Reporter: | Dmitry Verkhoturov | Assignee: | Renats Valiahmetovs (Inactive) |
| Resolution: | Unresolved | Votes: | 0 |
| Labels: | None | ||
| Remaining Estimate: | Not Specified | ||
| Time Spent: | Not Specified | ||
| Original Estimate: | Not Specified | ||
| Environment: |
Debian 10 |
||
| Attachments: |
|
| Description |
|
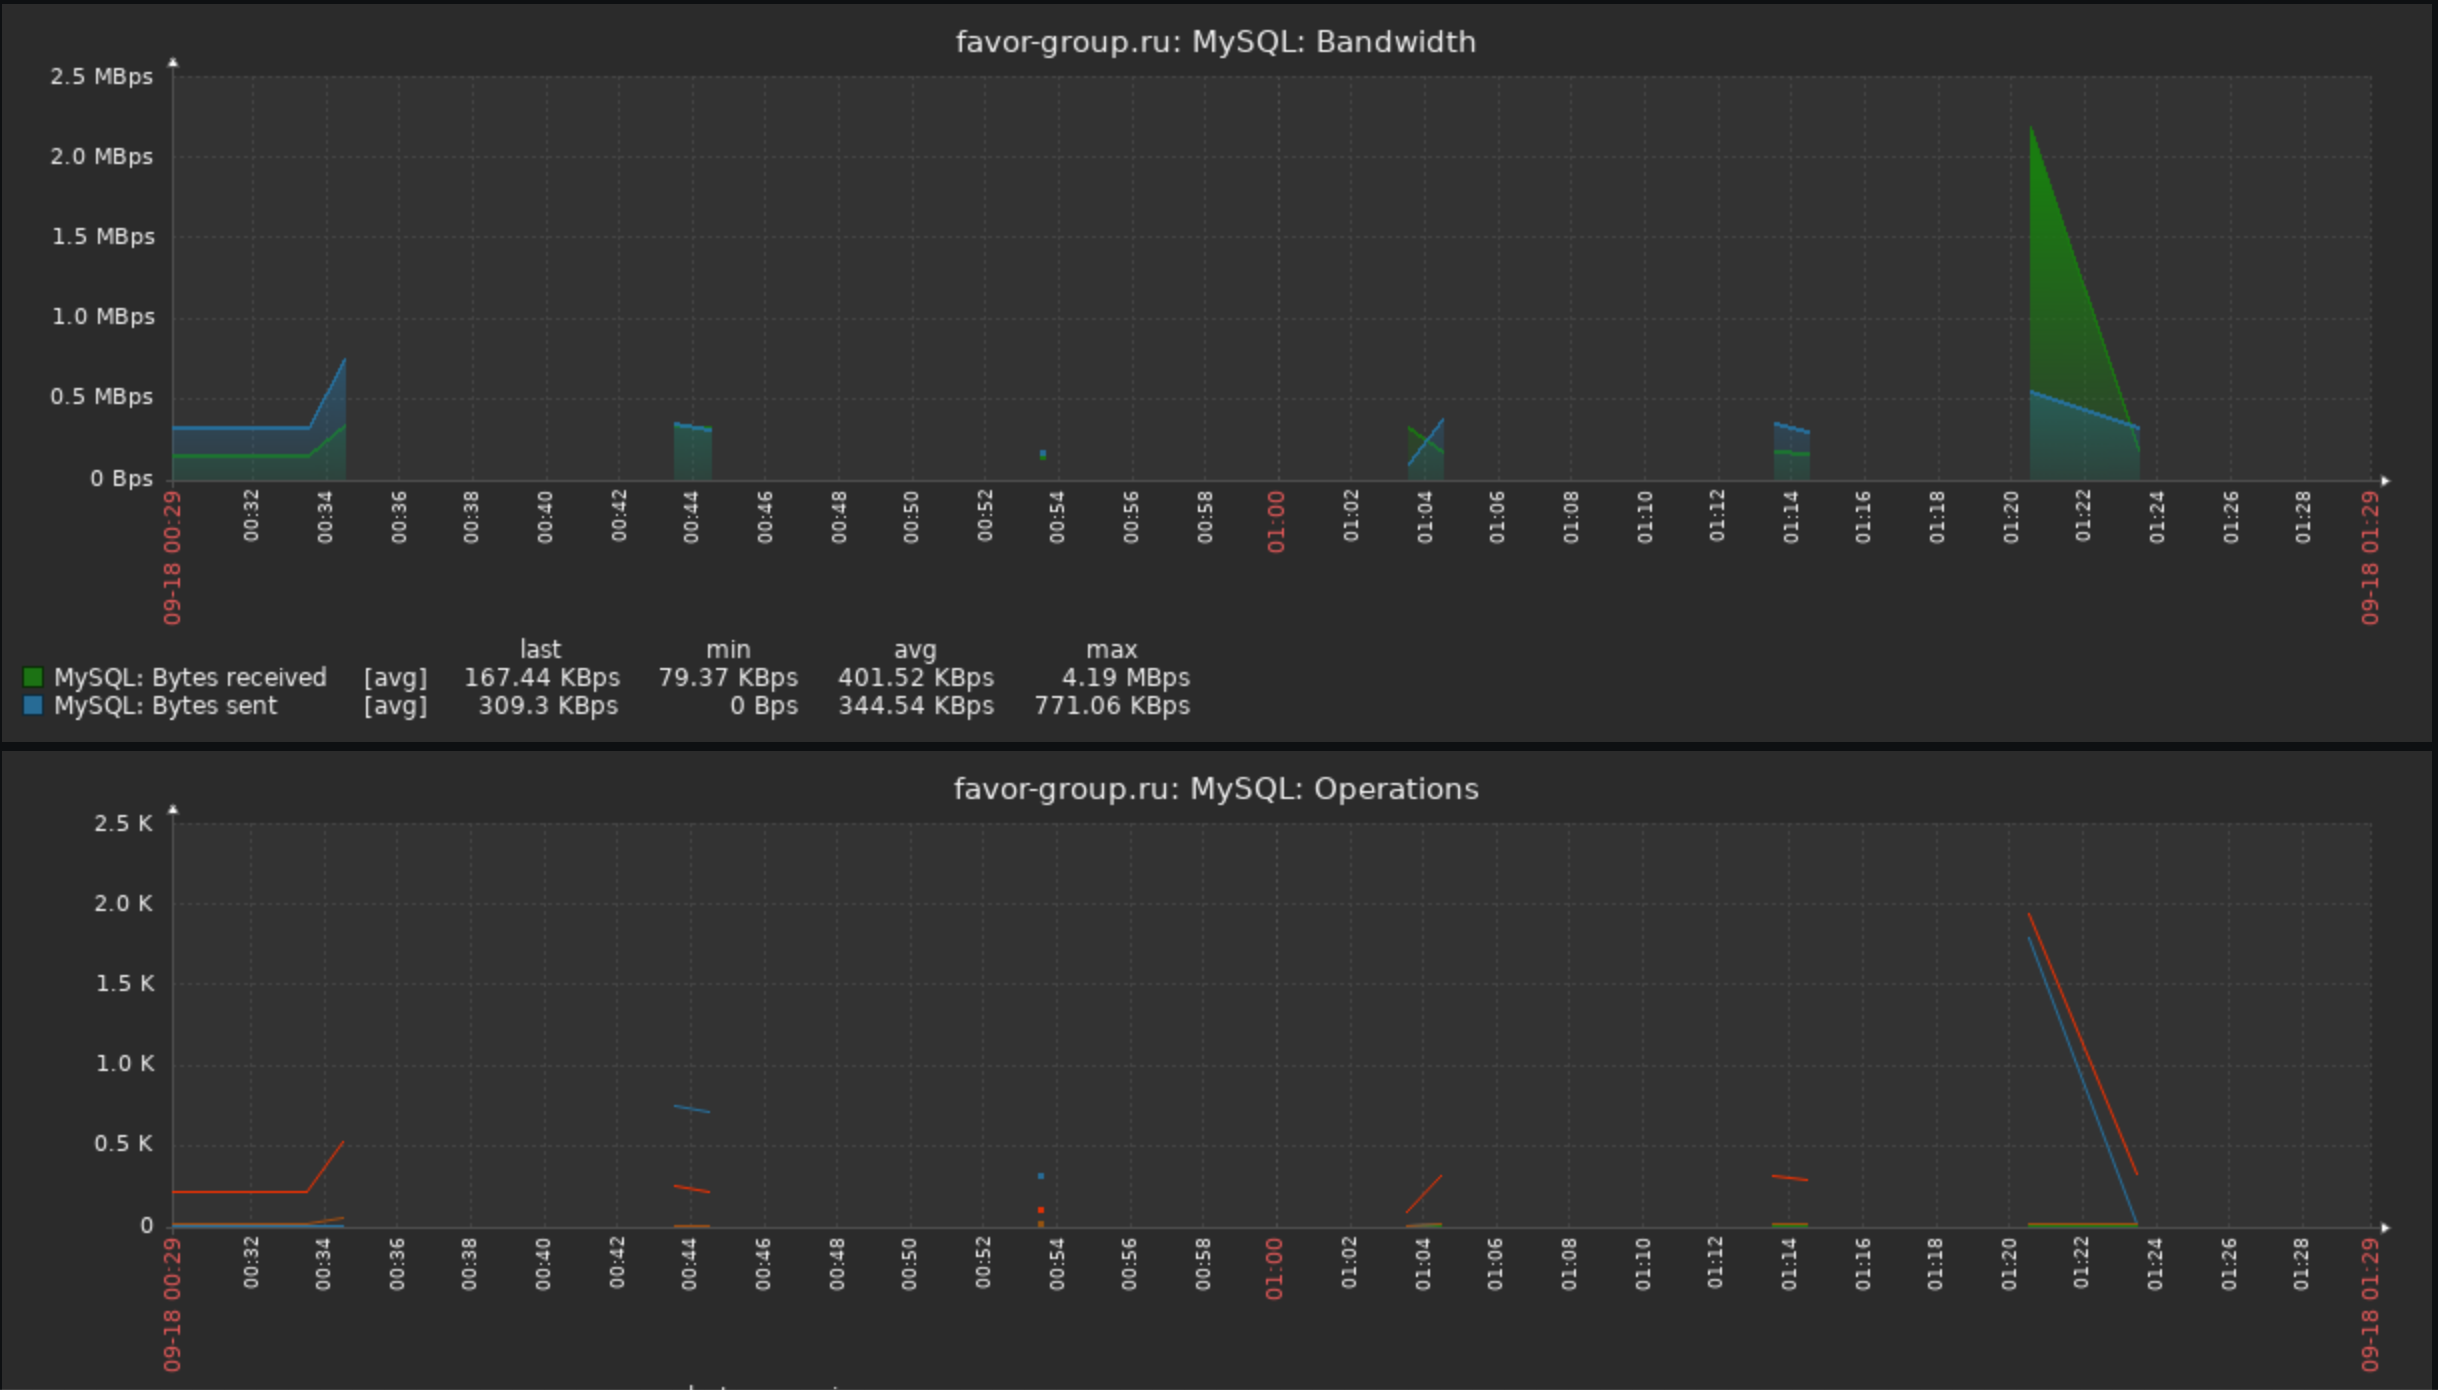
I have a MariaDB server in which I created a user according to "Template DB MySQL by Zabbix agent 2" instruction. $ egrep -v '^#|^$' /etc/zabbix/zabbix_agent2.conf PidFile=/var/run/zabbix/zabbix_agent2.pid LogFile=/var/log/zabbix/zabbix_agent2.log LogFileSize=0 ServerActive=example.org,<server external IP> Hostname=server.example.org Include=/etc/zabbix/zabbix_agent2.d/*.conf ControlSocket=/tmp/agent.sock In the web-interface, I have "Template DB MySQL by Zabbix agent 2" added to that host. The only alteration I made is I changed the items' type from "Zabbix Agent" to "Zabbix Agent ("active") to make it work without incoming connections, but the problem manifested itself before that change as well. The problem is that MySQL data from the agent comes in a very unreliable manner. Here is the log of the agent: $ tail -1000 /var/log/zabbix/zabbix_agent2.log | cut -d ' ' -f 3- | sort | uniq -c 264 check 'mysql.db.discovery["unix:/var/run/mysqld/mysqld.sock","zbx_monitor","password"]' is not supported: driver: bad connection 263 check 'mysql.db.size["unix:/var/run/mysqld/mysqld.sock","zbx_monitor","password","db_name"]' is not supported: driver: bad connection 209 check 'mysql.db.size["unix:/var/run/mysqld/mysqld.sock","zbx_monitor","password","other_db_name"]' is not supported: driver: bad connection 264 check 'mysql.get_status_variables["unix:/var/run/mysqld/mysqld.sock","zbx_monitor","password"]' is not supported: driver: bad connection And here is what I see in the web-interface:
Data collection flaps with an unhelpful error message. MySQL error log: $ grep zbx_monitor /var/log/mysql/error.log <...> 2020-09-18 1:23:27 611815 [Warning] Aborted connection 611815 to db: 'unconnected' user: 'zbx_monitor' host: 'localhost' (Got an error writing communication packets) 2020-09-18 1:23:48 611818 [Warning] Aborted connection 611818 to db: 'unconnected' user: 'zbx_monitor' host: 'localhost' (Got timeout reading communication packets) $ grep zbx_monitor /var/log/mysql/error.log | grep -c 'Got an error writing communication packets' 1 $ grep zbx_monitor /var/log/mysql/error.log | grep -c 'Got timeout reading communication packets' 129 The fact that the message is unhelpful could be attributed to MySQL library, however, it could be wrapped with more context which will be helpful. Also if there is a way to help me figure out why exactly this is happening, I would be very grateful. |
| Comments |
| Comment by Aigars Kadikis [ 2020 Sep 21 ] |
This can also happen if you have 'Timeout=30' in zabbix_agentd.conf and the host has one heavy UserParameter installed(not related to MySQL monitoring) which consumes all 30 second to obtain one metric. It's a rare case, but still a possibility. Please also try to simulate the check via passive channel, just to eliminate the problem with DB engine: time zabbix_get -s 127.0.0.1 -p 10050 -k 'mysql.db.discovery["unix:/var/run/mysqld/mysqld.sock","zbx_monitor","password"]' time zabbix_get -s 127.0.0.1 -p 10050 -k 'mysql.db.size["unix:/var/run/mysqld/mysqld.sock","zbx_monitor","password","db_name"]'' time zabbix_get -s 127.0.0.1 -p 10050 -k 'mysql.db.size["unix:/var/run/mysqld/mysqld.sock","zbx_monitor","password","other_db_name"]' time zabbix_get -s 127.0.0.1 -p 10050 -k 'mysql.get_status_variables["unix:/var/run/mysqld/mysqld.sock","zbx_monitor","password"]' How fast the metrics get obtained now? For testing purposes, can you try to leave the only MySQL monitoring in this host, does the behaviour is the same? |
| Comment by Dmitry Verkhoturov [ 2020 Sep 23 ] |
root@kvmru05-19571:~# time zabbix_get -s 127.0.0.1 -p 10050 -k mysql.db.size["unix:/var/run/mysqld/mysqld.sock","zbx_monitor","password","db_name"]
ZBX_NOTSUPPORTED: driver: bad connectionreal	0m0.012s
user	0m0.008s
sys	0m0.002s
The bad answer right away. I can't remove other templates as I'll lose all history that way. |
| Comment by Dmitry Verkhoturov [ 2021 Feb 17 ] |
|
I've tested once more with zabbix_agent2 (Zabbix) 5.2.3 Revision ae46273 21 December 2020, compilation time: Dec 30 2020 23:47:20 running inside the container, it gets all information for MySQL once after the restart and then spams logs with that error:
2021-02-17T19:56:26.000954736Z 2021/02/17 19:56:26.000807 check 'mysql.get_status_variables["unix:/var/run/mysqld/mysqld.sock","zbx_monitor","password"]' is not supported: driver: bad connection
|
| Comment by Dmitry Verkhoturov [ 2021 Mar 05 ] |
|
I found the issue root cause: multiple servers in ServerActive, two in my case, were causing the agenе misbehavior. After leaving only one server on the list everything works fine:
I believe I've had it with MariaDB version based on 5.7, and had it with PerconaDB 5.7 and 8.0, and the last change in behaviour after leaving single ServerActive was observed on zabbix_agent2 (Zabbix) 5.2.5 Revision 1afd0de 22 February 2021, compilation time: Feb 22 2021 16:08:20.
Renats Valiahmetovs would you be so kind to test if you could reproduce it? |