[ZBX-19041] Still high Memory utilization by preprocessing manager Created: 2021 Feb 19 Updated: 2023 Jul 19 Resolved: 2023 Jul 19 |
|
| Status: | Closed |
| Project: | ZABBIX BUGS AND ISSUES |
| Component/s: | Server (S) |
| Affects Version/s: | 4.0.28 |
| Fix Version/s: | None |
| Type: | Problem report | Priority: | Trivial |
| Reporter: | Colin Leroy-Mira | Assignee: | Unassigned |
| Resolution: | Cannot Reproduce | Votes: | 0 |
| Labels: | preprocessing | ||
| Remaining Estimate: | Not Specified | ||
| Time Spent: | Not Specified | ||
| Original Estimate: | Not Specified | ||
| Attachments: |
|
| Description |
|
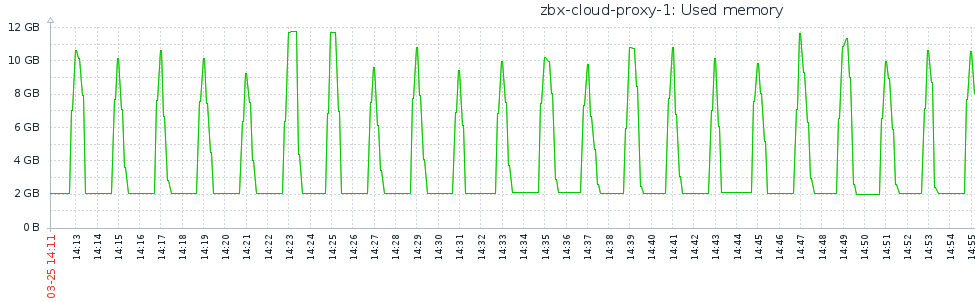
Hi, But it also seems that the preprocessor process progresses in its memory usage by steps, allocating memory (going up to 5GB here), freeing memory (back to a few hundred megs) ; once in a while, the freeing is much less, and the "base" memory usage goes up.
I've attached the template, which is really simple, having one master item and one discovery rule. The difficulty comes from the size of the /metrics endpoint, which returns a 19MB document. |
| Comments |
| Comment by Colin Leroy-Mira [ 2021 Feb 19 ] |
|
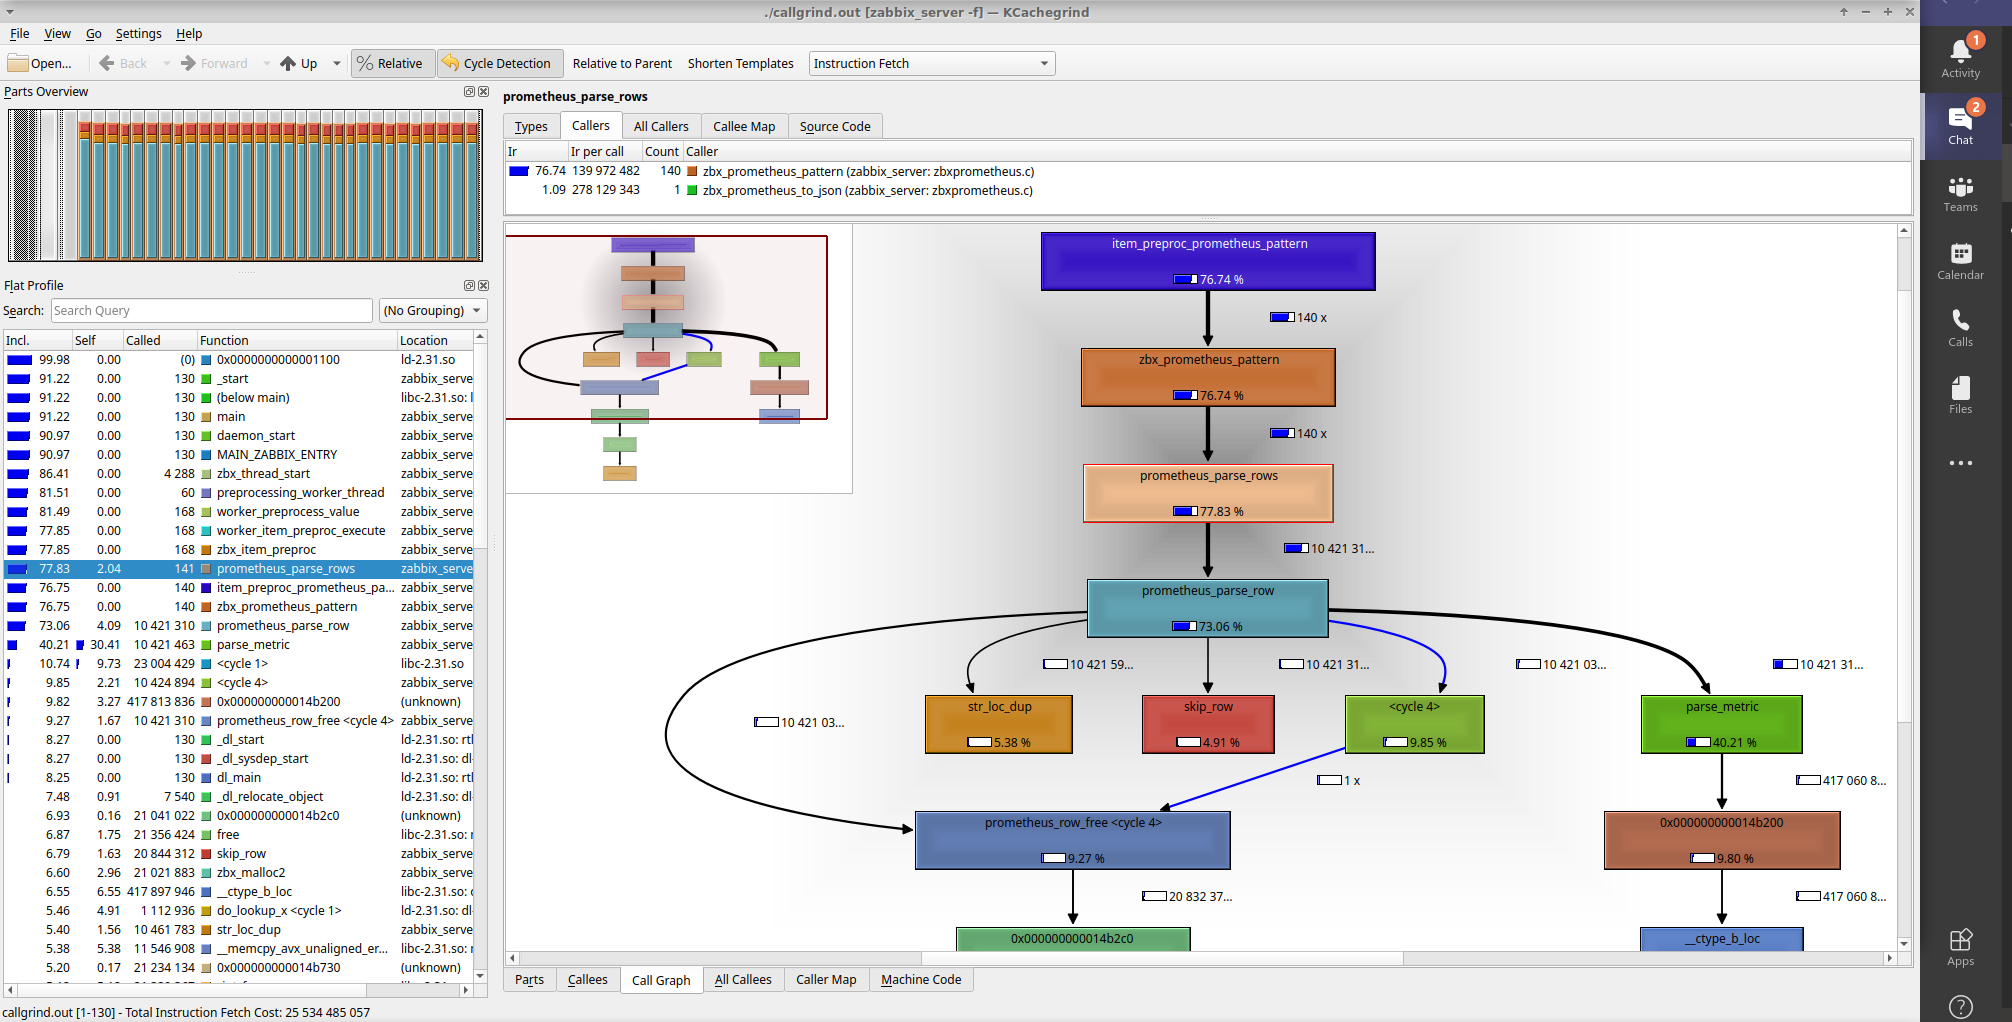
Hi, I've locally compiled Zabbix (git release/5.0 79eae73f9313997c608b676512209e0989ab55ae) and after a day of investigation, I don't think there's a leak. The memory usage goes up a lot, I think, because every dependant item gets a copy of the value of the master item, which is the full 20MB Prom metrics page. Then it takes some time to flush the preprocessing queue because the preprocessing of each dependant item is done (I think) on the full 20MB value each time, and that parsing takes quite a lot of CPU. (cf attached kcachegrind). It seems like a difficult thing to optimize. |
| Comment by Vladislavs Sokurenko [ 2021 Feb 19 ] |
|
It no longer gets a copy but each worker still needs the actual value to be preprocessed, how many preprocessing workers do you have ? Decreasing this number could help with memory consumption. On a side note maybe it is possible to optimize template somehow to convert prometheus to json and work with that, not sure. |
| Comment by Colin Leroy-Mira [ 2021 Feb 19 ] |
|
Hi, Thanks for the quick reply. Yes, I've seen (and hoped) that 17694's fix involved a refcount and much less copying, but there's still a copy done, if I'm not mistaken, when the tasks are passed to the preprocessor workers via IPC. That seems kind of unavoidable though. I've tried increasing the workers, but not decreasing. I will test that.
|
| Comment by Alexey Pustovalov [ 2021 Mar 25 ] |
|
Hello Colin, Did you test that? Kind regards, |
| Comment by Colin Leroy-Mira [ 2021 Mar 25 ] |
|
Hi Alexey, Sorry I forgot to reply to you. I did (with a single preprocessor worker), but it's not enough for us. I suppose it could work if Zabbix server runs on a huge machine or VM. We've also tested running those via a Zabbix proxy and it doesn't seem to be scalable at all :
This is on a proxy dedicated to only two hosts, grabbing Kafka metrics. |