[ZBX-19136] Pollers randomly stop qurying SNMP Created: 2021 Mar 18 Updated: 2024 Oct 11 Resolved: 2024 Oct 11 |
|
| Status: | Closed |
| Project: | ZABBIX BUGS AND ISSUES |
| Component/s: | Proxy (P), Server (S) |
| Affects Version/s: | 5.2.4 |
| Fix Version/s: | None |
| Type: | Problem report | Priority: | Trivial |
| Reporter: | Kevin Daudt | Assignee: | Zabbix Support Team |
| Resolution: | Cannot Reproduce | Votes: | 0 |
| Labels: | None | ||
| Remaining Estimate: | Not Specified | ||
| Time Spent: | Not Specified | ||
| Original Estimate: | Not Specified | ||
| Environment: |
Ubuntu 18.04 / 20.04 |
||
| Attachments: |
|
| Description |
|
Since a couple of weeks, for hosts being monitored with SNMP, proxies randomly stop monitoring hosts with SNMP for up to an hour. In /etc/zabbix/zabbix_proxy.conf, we have the following settings" Timeout=15 UnavailableDelay=300 UnreachableDelay=15 UnreachablePeriod=120 Here is an example in the log (with warning log level) where things work as expected: 123006.208 SNMP agent item "sensor.temperature" on host "pdu-302" failed: first network error, wait for 15 seconds 123051.023 SNMP agent item "phase.loadstate[3]" on host "pdu-302" failed: another network error, wait for 15 seconds 123206.062 temporarily disabling SNMP agent checks on host "pdu-302": host unavailable 123206.174 enabling SNMP agent checks on host "pdu-302": host became available There was an issue getting SNMP data, the proxy tried again shortly after, marked as unuavailabe, and short after was marked as available again. Here is an example of unexpected behavior (log level 4 enabled after host was marked unavailable): 45296:20210317:130733.726 SNMP agent item "ilo.temperature[ambient]" on host "usvh016" failed: first network error, wait for 15 seconds 45679:20210317:130933.643 temporarily disabling SNMP agent checks on host "usvh016": host unavailable 45777:20210317:140933.116 enabling SNMP agent checks on host "usvh016": host became available 45383:20210317:141024.397 In get_values_snmp() host:'usvh016' addr:'usvh016-ilo' num:1 Zabbix only reports a single issue, then 2 minutes later, immediately marks the host as unavailable, and starts monitoring again after 1 hour (tcpdump confirmed no SNMP traffic to the host in between). This happens with random hosts (different hosts each time) and just a couple of times per day. This seemed behavior seemed to have started randomly somewhere in Zabbix 5.0.x, and we still have it with Zabbix 5.2.4. Before that, everything was stable. The poller process usage is less then 25% at it's peak, unreachable pollers less than 4%. The host has plenty of resources. It happens. |
| Comments |
| Comment by Sergey Simonenko (Inactive) [ 2021 Mar 19 ] |
|
Would you please set the debug level to trace (5) temporarily? Kind regards, |
| Comment by Kevin Daudt [ 2021 Mar 19 ] |
|
Will do that as soon as I notice the issue again. |
| Comment by Kevin Daudt [ 2021 Mar 22 ] |
|
In this case, I could only catch the last 10 minutes where I increased the log level to mode 5 for pollers: 3809:20210322:121113.923 SNMP agent item "cpqHeThermalTempStatus" on host "usrenderav113" failed: first network error, wait for 15 seconds 4355:20210322:121138.219 SNMP agent item "cpqHeThermalTempStatus" on host "usrenderav113" failed: another network error, wait for 15 seconds 4157:20210322:121318.220 temporarily disabling SNMP agent checks on host "usrenderav113": host unavailable 4373:20210322:131338.105 enabling SNMP agent checks on host "usrenderav113": host became available 3912:20210322:131603.522 In get_values_snmp() host:'usrenderav113' addr:'usrenderav113-ilo' num:28 3912:20210322:131603.524 SNMP [public@usrenderav113-ilo:161] SNMP was reported down for 1 hour, but in the meantime, I had no issues querying SNMP to that host. In the mean time, nothing additionally was logged. |
| Comment by Sergey Simonenko (Inactive) [ 2021 Mar 22 ] |
|
This doesn't appear like debug level 5 (it should include info like timestamps when disable action was initiated and till what time). Kind regards, |
| Comment by Kevin Daudt [ 2021 Apr 09 ] |
|
Here is a log file. I've enabled trace logging about 15 minutes after the message that the host was disabled (I cannot leave trace logging enabled because it would quickly fill up the disks). The relevant host is usmailext025, with hostid 200200000051824. Excerpts: 8791:20210322:153942.182 SNMP agent item "memory.[17]" on host "usmailext025.domain.org" failed: first network error, wait for 15 seconds 9293:20210322:154142.044 temporarily disabling SNMP agent checks on host "usmailext025.domain.org": host unavailable [..] 8770:20210322:155310.412 log level has been increased to 5 (trace) 8827:20210322:155310.412 log level has been increased to 5 (trace) [..] 8827:20210322:155406.149 In zbx_activate_item_host() hostid:200200000051824 itemid:200200012789146 type:5 8827:20210322:155406.149 End of zbx_activate_item_host() [..] 9448:20210322:164142.673 enabling SNMP agent checks on host "usmailext025.domain.org": host became available 9233:20210322:164227.713 resuming SNMP agent checks on host "usmailext025.domain.org": connection restored |
| Comment by Dmitry Krupornitsky [ 2021 Apr 22 ] |
|
Can we definitely exclude network errors? What about SNMP timeouts, may be its time to increase them? I would check your devices to see if the SNMP query is even making it to the device from the proxy, learn the time it takes and see what is happening to it. Perhaps a loop script with logging, querying some OID value via snmpwalk from least loaded device or such will detach problems from Zabbix and narrow it to networking only, if so. Make sure the packet is not being dropped and SNMP service stays up. Since it is UDP, anything can happen. If you have multiple routes you might need to assign some priority to use the same routes if the main proxy links are up. |
| Comment by Kevin Daudt [ 2021 Apr 30 ] |
|
@dmitry Thanks for the suggestions. We're still collecting more data when these events occur, but when they happen, I can still manually query the hosts with snmpwalk, so even if it was a network issue that triggered the first warning, in the hour that Zabbix shows the device as unavailable, it has been a short event, and Zabbix should be able to pick up right after. Here is another example of difference in behavior (collected afterwards from the log) 1850:20210430:103506.419 SNMP agent item "sensor.temperature" on host "h-txa-1ter-pdu-302" failed: first network error, wait for 15 seconds 2390:20210430:103536.022 SNMP agent item "outlet.current[23]" on host "h-txa-1ter-pdu-302" failed: another network error, wait for 15 seconds 2164:20210430:103606.046 SNMP agent item "outlet.current[23]" on host "h-txa-1ter-pdu-302" failed: another network error, wait for 15 seconds 2402:20210430:103651.080 SNMP agent item "outlet.current[12]" on host "h-txa-1ter-pdu-302" failed: another network error, wait for 15 seconds 2123:20210430:103706.117 resuming SNMP agent checks on host "h-txa-1ter-pdu-302.": connection restored Here, this host apparently has (network) issues, and snmp can not be queried for a while (it retries 3 more times), but 2 minutes later it's restored. Then later: 1952:20210430:115251.443 SNMP agent item "phase.loadstate[3]" on host "h-txa-1ter-pdu-302" failed: first network error, wait for 15 seconds 2407:20210430:115451.384 temporarily disabling SNMP agent checks on host "h-txa-1ter-pdu-302": host unavailable 2377:20210430:115451.688 enabling SNMP agent checks on host "h-txa-1ter-pdu-302": host became available It was marked unavailable 2 minutes after it was first network error, but no attempts in between, but immediately after it was marked as unavailable, it's marked as available again. At this point, nothing indicated this is purely a network issue, the device still responds to snmp queries, even though Zabbix says it's unavailable. |
| Comment by Kevin Daudt [ 2021 May 06 ] |
|
@Dmitry Krupornitsky We've setup a continuous packet dump on the proxy capturing SNMP traffic. Here is an example of a host that is marked as having network issues: 1854:20210505:144640.852 SNMP agent item "cpqHeMibCondition" on host "usvmw106" failed: first network error, wait for 15 seconds 2166:20210505:144840.221 temporarily disabling SNMP agent checks on host "usvmw106": host unavailable 2188:20210505:150340.605 enabling SNMP agent checks on host "usvmw106": host became available This is the relevant packet dump:
There is not a single SNMP query unanswered, yet between 14:43 and 15:03, the proxy did not send a single packet out anymore, so it's certainly not a network issue, at most something at the host level. |
| Comment by Dmitry Krupornitsky [ 2021 May 11 ] |
|
Yep, thats strange. What about SNMP communities in items, are they valid? What did you use for snmwalk? |
| Comment by Kevin Daudt [ 2021 May 11 ] |
|
I used the same community string with snmpwalk as we configured in Zabbix. As you can see in that screenshot, there is no indication of an incorrect community string (all requests are answered), it's just that Zabbix stops asking for a period. And for the record, there has not been single snmp request that was not answered in the 30 minutes before this event. |
| Comment by Dmitry Krupornitsky [ 2021 May 13 ] |
|
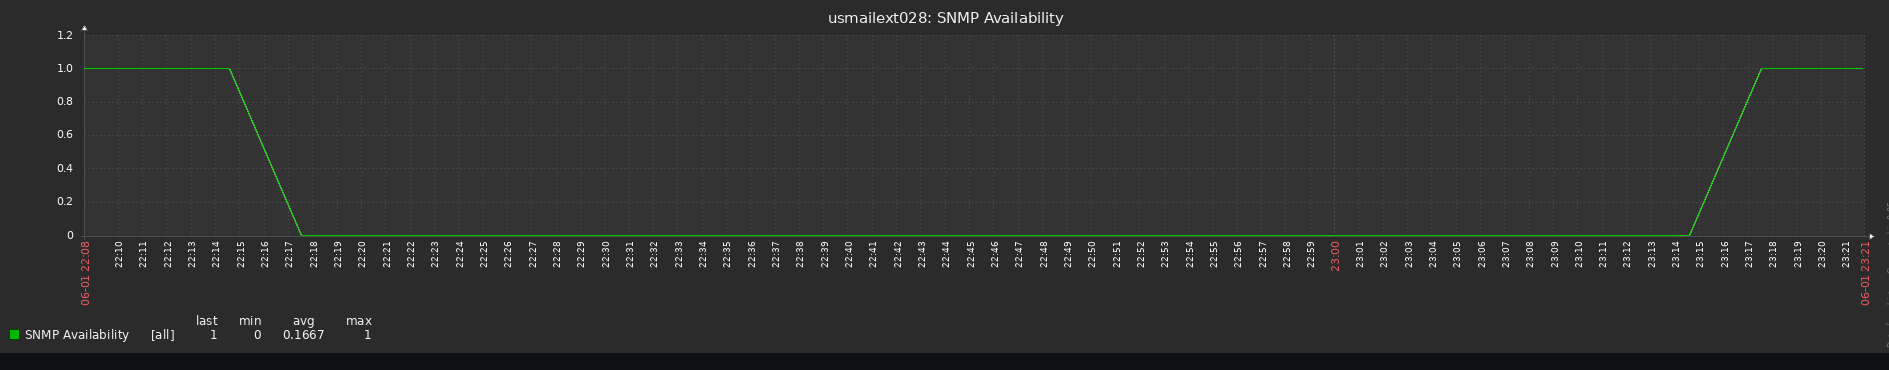
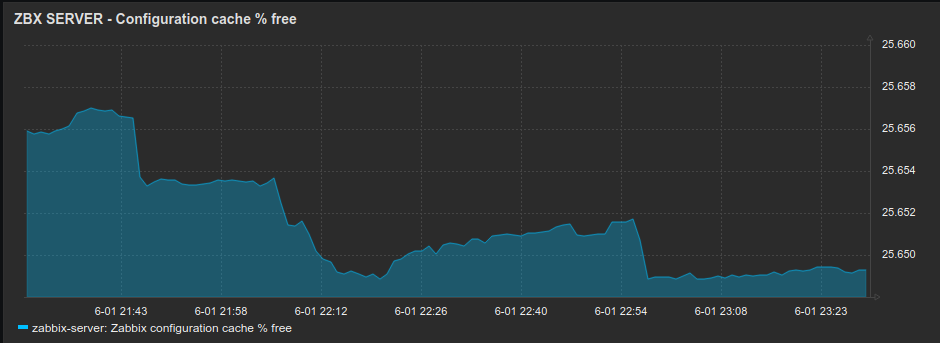
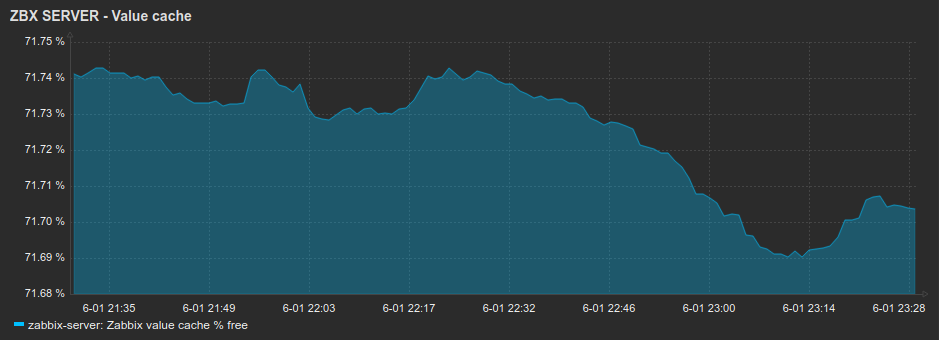
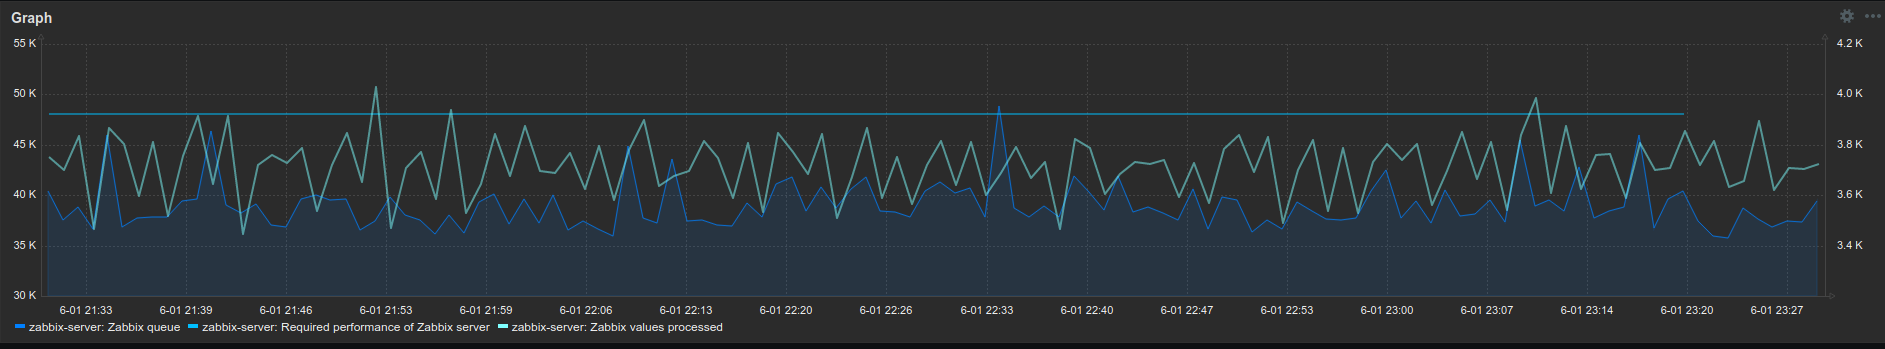
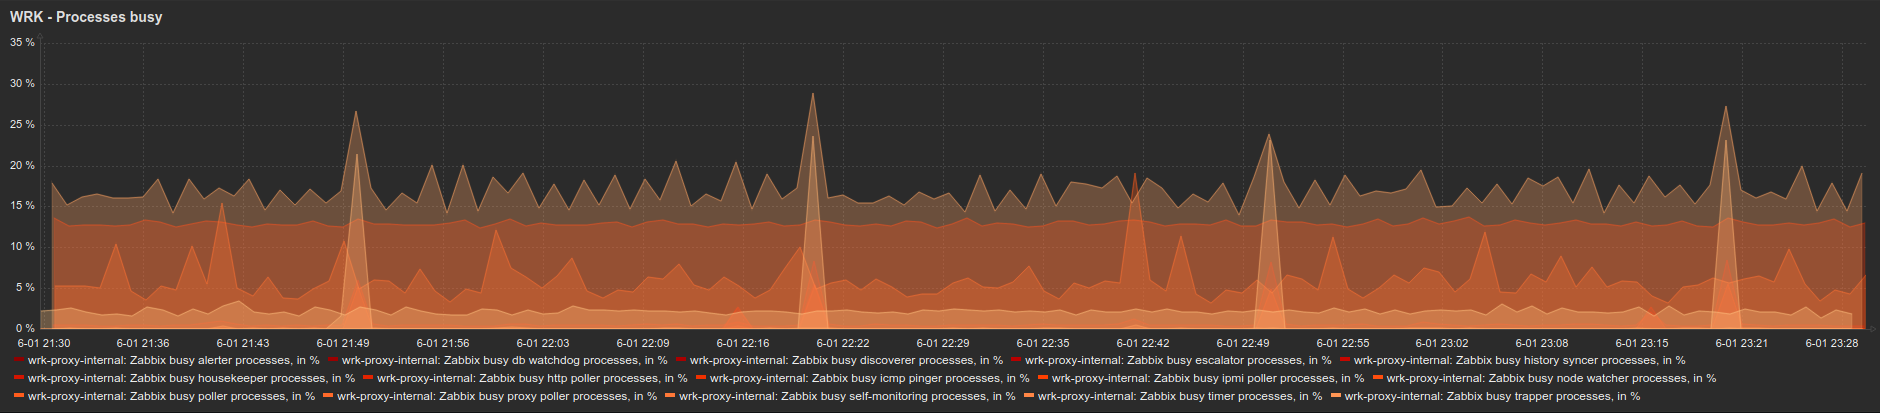
Just some thoughts on your case: 1) What about the time on your Zabbix server and proxies, devices and so on. Is it the same? 2) Can you gather a slightly bigger log with debug=4 around the problem: say 10 minutes before and after host becomes unavailable. 3) Could you please show the following graphs for a several hours before the problem: Zabbix cache usage % free |
| Comment by Kevin Daudt [ 2021 Jun 02 ] |
|
1) The time is synchronized on these servers with ntp (chrony) 2) usmailext028_wrk_proxy_dbg.log.gz Specifically: 10454:20210601:221437.414 In get_values_snmp() host:'usmailext028.domain.org' addr:'usmailext028-ilo.domain.org' num:82 10454:20210601:221437.419 getting SNMP values failed: usmailext028-ilo.domain.org: [-2] Name or service not known 10454:20210601:221437.420 SNMP agent item "cpqDaPhyDrvStatus.[0.29]" on host "usmailext028.domain.org" failed: first network error, wait for 15 seconds 10855:20210601:221637.005 temporarily disabling SNMP agent checks on host "usmailext028.domain.org": host unavailable [..] 11073:20210601:231637.017 enabling SNMP agent checks on host "usmailext028.domain.org": host became available 10945:20210601:231652.137 SNMP agent item "memory.[1]" on host "usmailext028.domain.org" failed: first network error, wait for 15 seconds 11029:20210601:231707.087 resuming SNMP agent checks on host "usmailext028.domain.org": connection restored 3)
|
| Comment by Kevin Daudt [ 2021 Jun 03 ] |
|
Just some extra comments:
|
| Comment by Kevin Daudt [ 2021 Sep 17 ] |
|
After adding a caching DNS server on the proxies, the problem is not occurring very frequently anymore, so it has to do with DNS queries failing. The question is still why it sometimes takes up to an hour before it will even try again. |
| Comment by Kevin Daudt [ 2024 Oct 11 ] |
|
I have not experienced this issue anymore for a long time, so I'm closing this issue. |