|
Hello, Thomas.
I tested this out with some of the widgets and it does look like they refresh in my environment. For example, I can see the problem duration gets updated every 10 seconds in the Problems widget.
Could you give me some examples of widgets where you're seeing this issue?
|
|
Hi Arturs,
I have a graph in the Global view dashboard where I display the temperature of my server room.
This graph is not refreshed.
I attach screenshots of them.
|
|
Just made a test with the Problems widget.
Set the refresh period to 10 seconds, shut down a PC.
In this Problems widget the duration is refreshed every 10 seconds.
So the refresh is working here.
Widgets with graphs don't get refreshed.
|
|
Added a screenshot "Problems".
The duration in the Problems widget is updated every 10 seconds.
The widget "Server Room Temperature" with the graph is not refreshed. So see the last time info 16:39 in the graph.
At the local clock you see the actual time of about 16:48.
|
|
Hello Support Team!
I have the same problem.
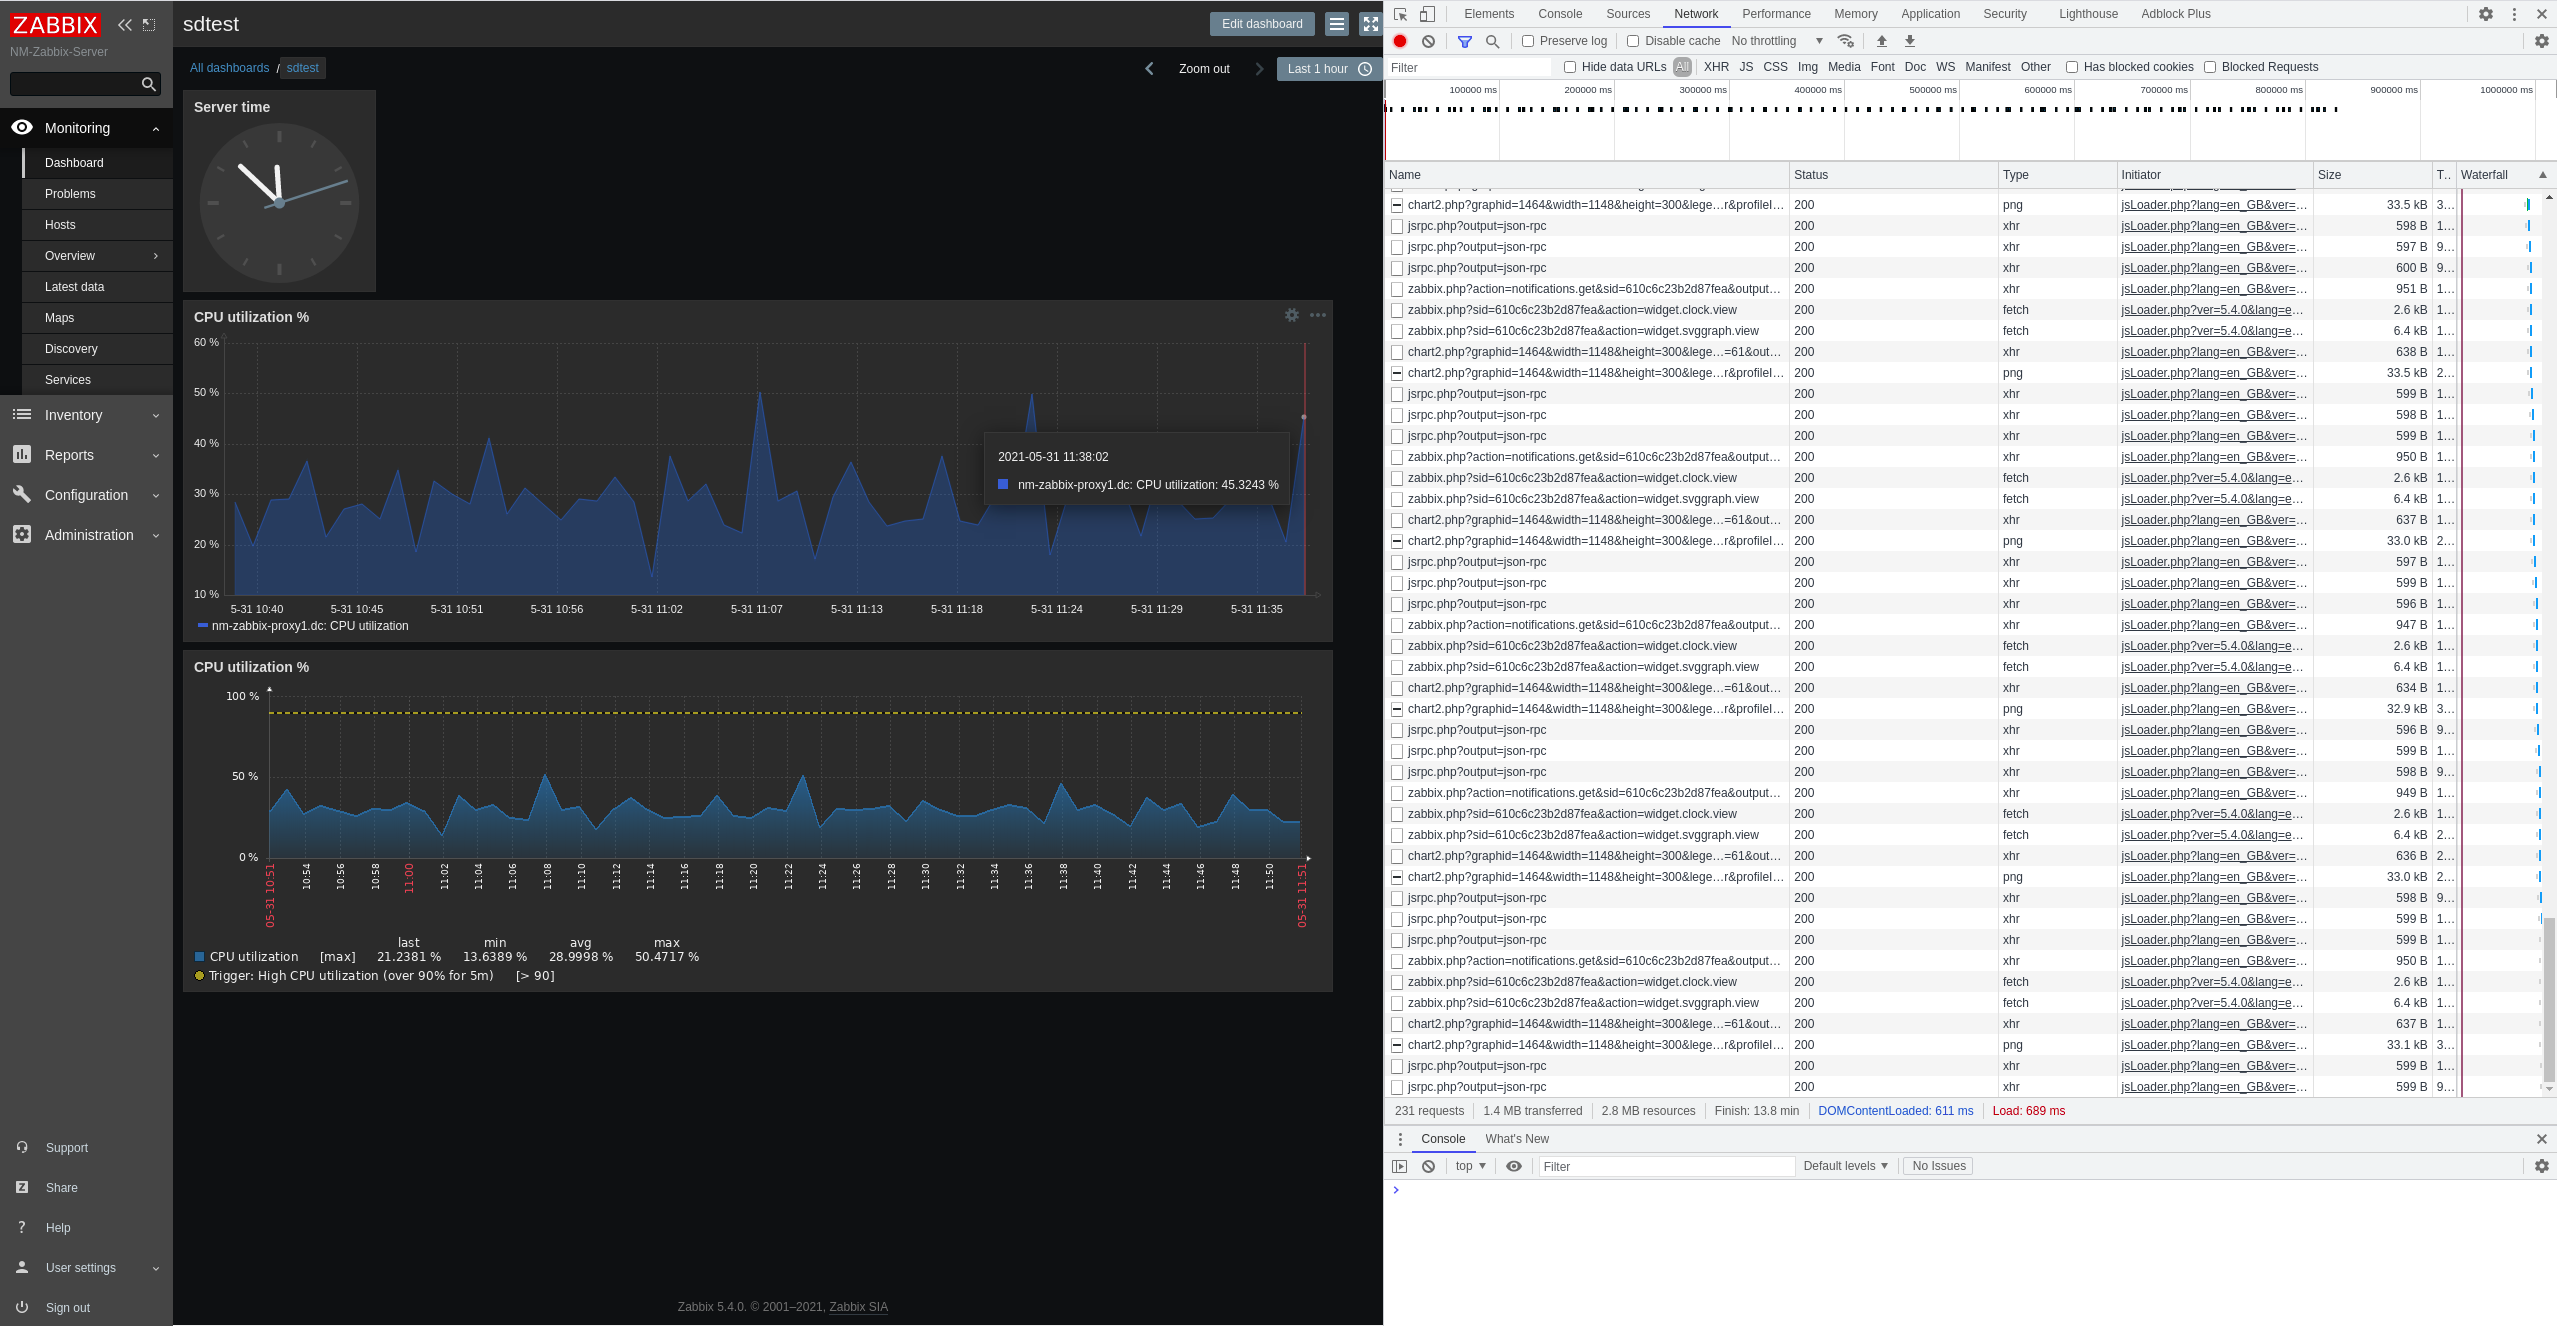
After upgrading from 5.0.4 to 5.4.0 all graph widgets are not refreshed anymore. But widgets with classic graphs work well.
Installation information:
Red Hat Enterprise Linux release 8.3 (Ootpa)
zabbix-web-deps-5.4.0-8.el8.noarch
zabbix-web-pgsql-5.4.0-8.el8.noarch
zabbix-nginx-conf-5.4.0-8.el8.noarch
zabbix-web-5.4.0-8.el8.noarch
php-fpm-7.2.24-1.module+el8.2.0+5510+6771133c.x86_64
nginx-1.14.1-9.0.1.module+el8.0.0+5347+9282027e.x86_64
Google Chrome (Version 91.0.4472.77 (Official Build) (64-bit))
Test dashboard screenshot is attached (sdtest_zabbix_dashboard_graph_problem_1.png). Please let me know if you need more information.

|
|
Hello to all of you,
Exactly the same thing is happening to us.
We consider, in our NOC this problem as a high priority, as we do not see in our dashboards the real time update of temperatures, cpu loads or network load. As they are informative screens, we cannot be pressing F5 every 20 seconds.
We ask you to consider this problem as a priority.
Thank you very much
|
|
Resolved in development branch feature/ZBX-19419-5.4
|
|
Fixed in:
|
Generated at Sun Apr 06 01:51:57 EEST 2025 using Jira 9.12.4#9120004-sha1:625303b708afdb767e17cb2838290c41888e9ff0.
