|
Duplicate |
|||
| is duplicated by |
|
zabbix5.4.2 Scheduled report is gener... | Closed |
[ZBX-19713] zabbix5.4.2 Scheduled report is generated but no graphical info shown on pdf attachment Created: 2021 Jul 21 Updated: 2021 Oct 28 Resolved: 2021 Oct 28 |
|
| Status: | Closed |
| Project: | ZABBIX BUGS AND ISSUES |
| Component/s: | None |
| Affects Version/s: | None |
| Fix Version/s: | None |
| Type: | Incident report | Priority: | Trivial |
| Reporter: | edjung | Assignee: | Zabbix Support Team |
| Resolution: | Incomplete | Votes: | 0 |
| Labels: | dashboard, graphs | ||
| Remaining Estimate: | Not Specified | ||
| Time Spent: | Not Specified | ||
| Original Estimate: | Not Specified | ||
| Environment: |
ubuntu server20.04LTS, nginx, mariadb10.5, zabbix 5.4.2 |
||
| Attachments: |
|
||||||||
| Issue Links: |
|
||||||||
| Description |
|
Steps to reproduce:
please review my attachments with this issue |
| Comments |
| Comment by Aleksey Volodin [ 2021 Jul 22 ] |
|
Hello edjung! Thank you for reporting this. Can you please provide some additional information? Share the output of this command
zabbix_web_service -V
Also increase log level for the zabbix_web_service and share the log file while you test the Schedule report. Best regards, |
| Comment by edjung [ 2021 Jul 26 ] |
|
thanks, Aleksey Volodin here's the web_service version root@zabbix54:/etc/zabbix# zabbix_web_service -V Copyright (C) 2021 Zabbix SIA |
| Comment by edjung [ 2021 Jul 26 ] |
|
here comes the log file after I changed debug level to 5 with restarting zabbix and generated test report at local time https://drive.google.com/file/d/1P-VxKGeqTOyCHI2sbku59g-UPnMFWOjO/view?usp=sharing thanks again for your kindly replies, |
| Comment by Aleksey Volodin [ 2021 Jul 26 ] |
|
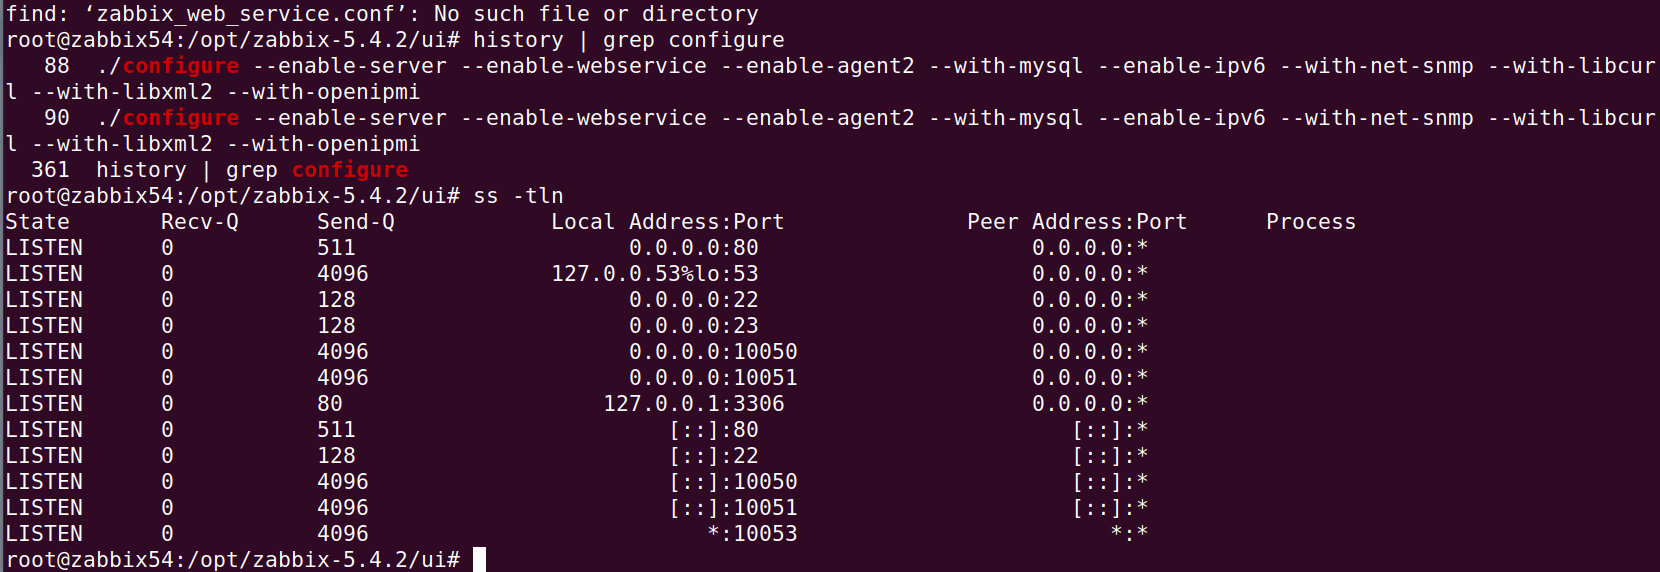
Thank you for share additional information. But maybe you sent the wrong one log file. Previous i asked you to provide information from zabbix_web_service. To do this please edit zabbix_web_service configuration file /etc/zabbix/zabbix_web_service.conf and change from # DebugLevel=3 to DebugLevel=5 Then restart zabbix_web_service. |
| Comment by edjung [ 2021 Jul 30 ] |
|
|
| Comment by edjung [ 2021 Aug 03 ] |
|
thanks for your replies, Aleksey, |
| Comment by edjung [ 2021 Aug 03 ] |
|
my google-chrome version is: Google Chrome 91.0.4472.114 |
| Comment by edjung [ 2021 Aug 03 ] |
|
I got it, use apt install zabbix-web-service instead of configure from source, |
| Comment by edjung [ 2021 Aug 03 ] |
|
thanks again, Aleksey, |
| Comment by Antons Sincovs [ 2021 Aug 26 ] |
|
Hello Edjung! Could you please share your current status regarding the scheduled report generation? Do you still have issues? Kind regards, |
| Comment by edjung [ 2021 Aug 29 ] |
|
Hi, Antons Sincovs, but my graph report still missing some parts, you can check my latest update attachment above at 3rd. August, please advise me. |
| Comment by Antons Sincovs [ 2021 Sep 06 ] |
|
Hello Edjung! I have prepared a step-by-step instruction for you which I followed on a CentOS 8 freshly installed VM. Here is the PDF report with a graph which I obtained as a result test_report_zabbix-server-cpu-interrup-time-graph.pdf Please try following it and see if it helps. 1. Download google chrome
wget https://dl.google.com/linux/direct/google-chrome-stable_current_x86_64.rpm
2. Install google chrome dnf localinstall -y google-chrome-stable_current_x86_64.rpm 3. Install Zabbix web service dnf install zabbix-web-service 4. Modify the Zabbix server configuration to enable web service /etc/zabbix/zabbix_server.conf add lines (set communication between the Zabbix server and web service, make sure that the port 10053 is not blocked) :
WebServiceURL=http://<IP/DNS name>:10053/report
start at least one reporter process: StartReportWriters=1 5. Modify /etc/zabbix/zabbix_web_service.conf to allow Zabbix server connections: AllowedIP=<Zabbix server's IP/DNS name> 6. Enable and start the web service systemctl enable zabbix-web-service.service --now 7. Check permissions for the user role - must include: “Access to UI elements”>“Scheduled reports” 8. Permissions to manage scheduled reports: “Access to API”>“Manage scheduled reports” 9. Enable communication between the Zabbix frontend and the Web service (you need to specify your frontend URL that will be reachable by the web service): “Administration”>“General”>“Other configuration parameters”>“Frontend URL”><IP/DNS name of Zabbix frontend> 10. Make sure that email media type is assigned to the user you try to send scheduled reports to 11. Versions of packages used:
Kind regards, |
| Comment by edjung [ 2021 Sep 13 ] |
|
Dear Mr. Sincovs, gratefully, |
| Comment by Antons Sincovs [ 2021 Sep 23 ] |
|
Hello Edjung! Regards, |
| Comment by edjung [ 2021 Sep 27 ] |
|
Sorry for my late comment of progress, gratefully, |
| Comment by edjung [ 2021 Sep 27 ] |
|
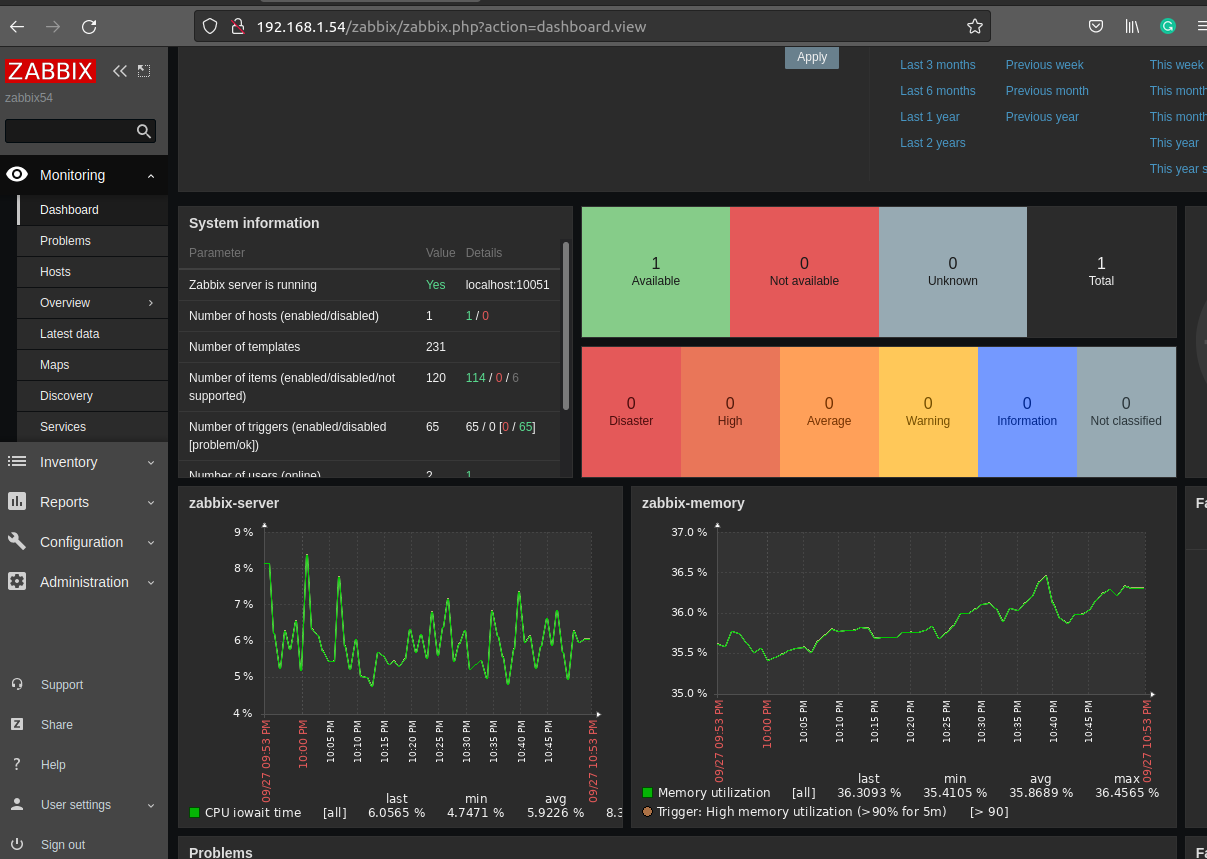
Respectful Mr. Sincovs, sadly to say, here's the no-graph report, test-report_2021-09-27_22-46.pdf the graphs my newly installed zabbix server dashboard lools like below
|
| Comment by Antons Sincovs [ 2021 Oct 11 ] |
|
Hello Edjung! Repeated all the steps with Ubuntu 20.04 + Zabbix server 5.4.4 + Zabbix web service 5.4.4. Here are the steps a took: 1. Get the debian package with Google Chrome stable
wget https://dl.google.com/linux/direct/google-chrome-stable_current_amd64.deb
2. Install the package sudo dpkg -i google-chrome-stable_current_amd64.deb 3. Install Zabbix web-service apt install zabbix-web-service 4. Modify the Zabbix server configuration to enable web service /etc/zabbix/zabbix_server.conf add lines (set communication between the Zabbix server and web service, make sure that the port 10053 is not blocked) :
WebServiceURL=http://<IP/DNS name>:10053/report
start at least one process: StartReportWriters=1 5.Modify /etc/zabbix/zabbix_web_service.conf : AllowedIP=<Zabbix server's IP/DNS name> My particular example /etc/zabbix/zabbix_server.conf:
StartReportWriters=3
WebServiceURL=http://localhost:10053/report
/etc/zabbix/zabbix_web_service.conf: AllowedIP=127.0.0.1 Frontend URL (“Administration”>“General”>“Other configuration parameters”):
http://localhost/
Test_report_2021-10-11_08-01-ubuntu.pdf Please, note, that when creating a scheduled report you have to select the "Period" for data to be displayed and can vary among "Previous day", "Previous week", "Previous month" and "Previous year". There is one more reason why your graphs can be blank - the absence of data. As you can see - I have switched the VM on for some time the day before I have generated the test report for some data to be present on graphs, as I chose "Previous day" period. By the was are do you use HTTP or HTTPS for the frontend webserver? Kind regards, |
| Comment by edjung [ 2021 Oct 21 ] |
|
Respectful Mr. Sincovs, Thanks for your specific description, I'll try to do all over again, to see if the situation changed or not, my original idea is that, the graph report can show instant data in time, I will update my test as soon as possible, gratefully, |
| Comment by Antons Sincovs [ 2021 Oct 22 ] |
|
Just, please note, that, that "Period" setting in "Scheduled reports" for now can only include the following time periods:
|
| Comment by edjung [ 2021 Oct 23 ] |
|
Dear Mr. Sincovs, you're right about the time period issue, that's exactly the reason of my mistake, I can now generate graph report since I waited the data to be collected for over a day. here's the result: test-report_2021-10-23_21-07.pdf Thanks for all kind and patient replies from you and the amazing Zabbix development team. Sincerely yours, ed |
| Comment by Antons Sincovs [ 2021 Oct 23 ] |
|
You are always welcome, Ed! |