[ZBX-19718] Chart only shows data if date range is up to 3 days. Created: 2021 Jul 21 Updated: 2021 Jul 26 Resolved: 2021 Jul 26 |
|
| Status: | Closed |
| Project: | ZABBIX BUGS AND ISSUES |
| Component/s: | Frontend (F) |
| Affects Version/s: | 5.0.14 |
| Fix Version/s: | None |
| Type: | Incident report | Priority: | Trivial |
| Reporter: | Leandro Mendes Ribeiro | Assignee: | Aleksey Volodin |
| Resolution: | Won't Do | Votes: | 0 |
| Labels: | None | ||
| Remaining Estimate: | Not Specified | ||
| Time Spent: | Not Specified | ||
| Original Estimate: | Not Specified | ||
| Environment: |
The chart only shows data if the date range is up to 3 days. Also, it does not load the chart. I need to be able to fetch the history without this limiter. |
||
| Attachments: |
|
| Description |
|
Steps to reproduce:
Result: Until Zabbix 3.X there was an option inside Administration > General > GUI called "Show events not older than" which since Zabbix 4.0 has been removed. Thanks in advance for any help about it, if you need more information just ask. |
| Comments |
| Comment by Aleksey Volodin [ 2021 Jul 22 ] |
|
Hello Leandro Mendes Ribeiro! Thank you for reporting this. Can you please add Admin user to Debug user group, and then try to change graph setting once again? Press DEBUG button on page with error. Then attach log here as file please.
Best regards, |
| Comment by Leandro Mendes Ribeiro [ 2021 Jul 22 ] |
|
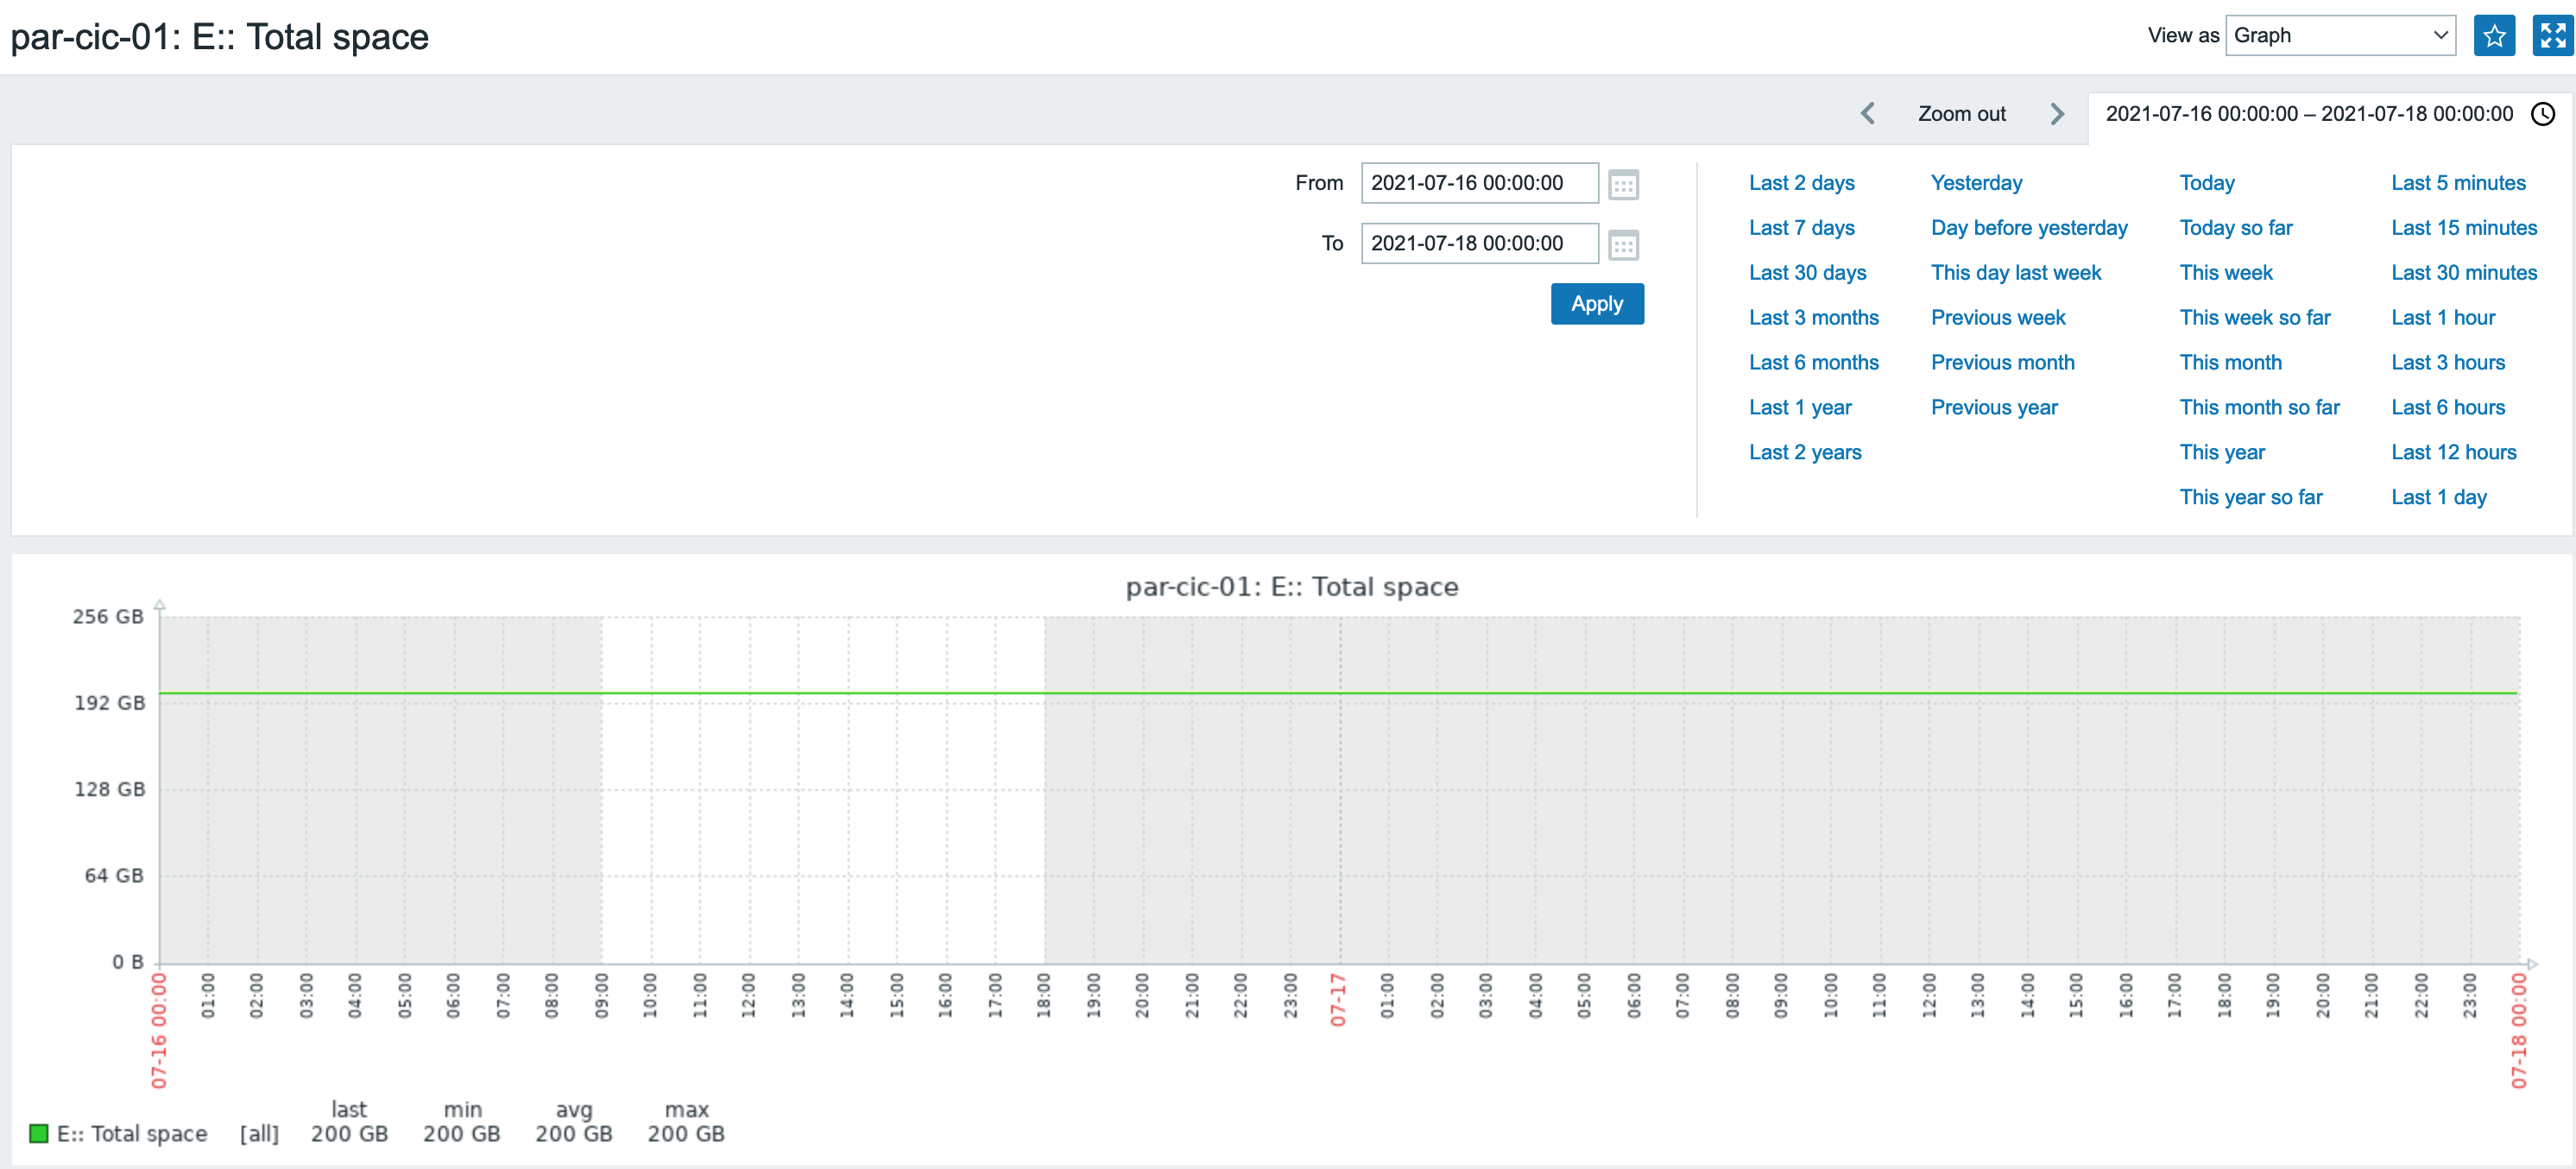
Hi Aleksey. Of course, I did a test filtering From '2021-07-16 00:00:00' To 'now'. I have attached the Debug.txt file. Thanks |
| Comment by Aleksey Volodin [ 2021 Jul 23 ] |
|
And for double check - from graph i can see this is some Windows host, with Windows Agent template assigned? And how long ago was this host created? |
| Comment by Leandro Mendes Ribeiro [ 2021 Jul 23 ] |
|
This host is using Zabbix Agent 2 in version 5.0.5, the host was created more than a year ago...can I identify in any field the exact creation date? By the way, this problem occurs regardless of the operating system, including network hosts, with communication via SNMP. A detail that might be relevant to this problem, the architecture I'm using consists of Zabbix Server running on a VM with CentOS 7, while Front runs on Kubernetes, and is currently using the last image available: zabbix/zabbix-web-nginx-mysql:alpine-5.0-latest. |
| Comment by Aleksey Volodin [ 2021 Jul 23 ] |
|
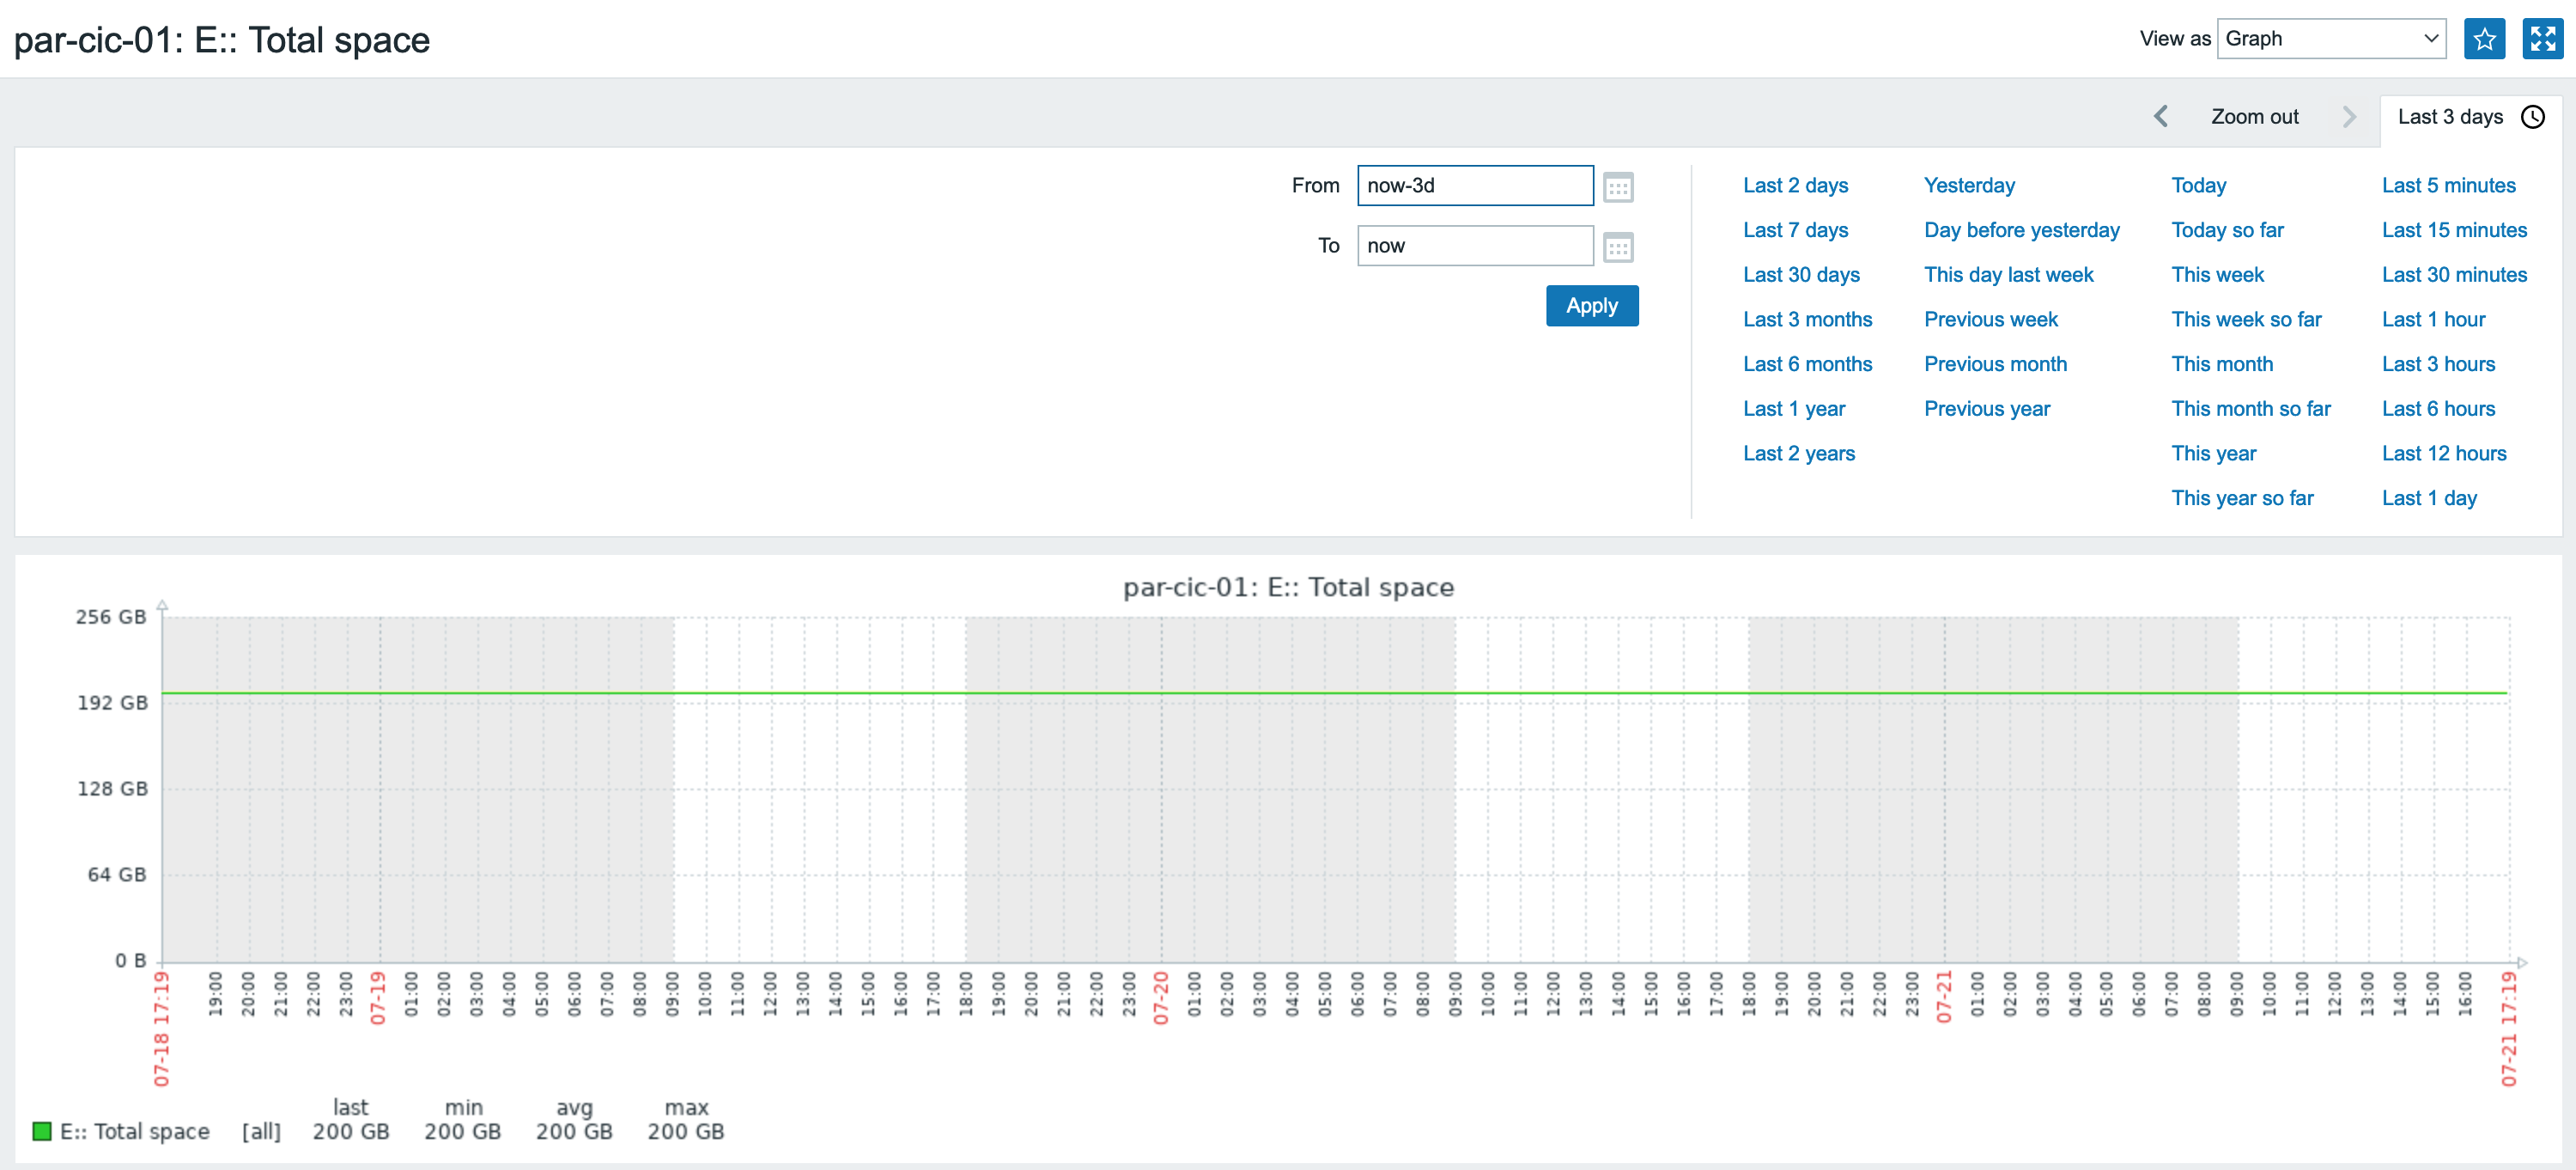
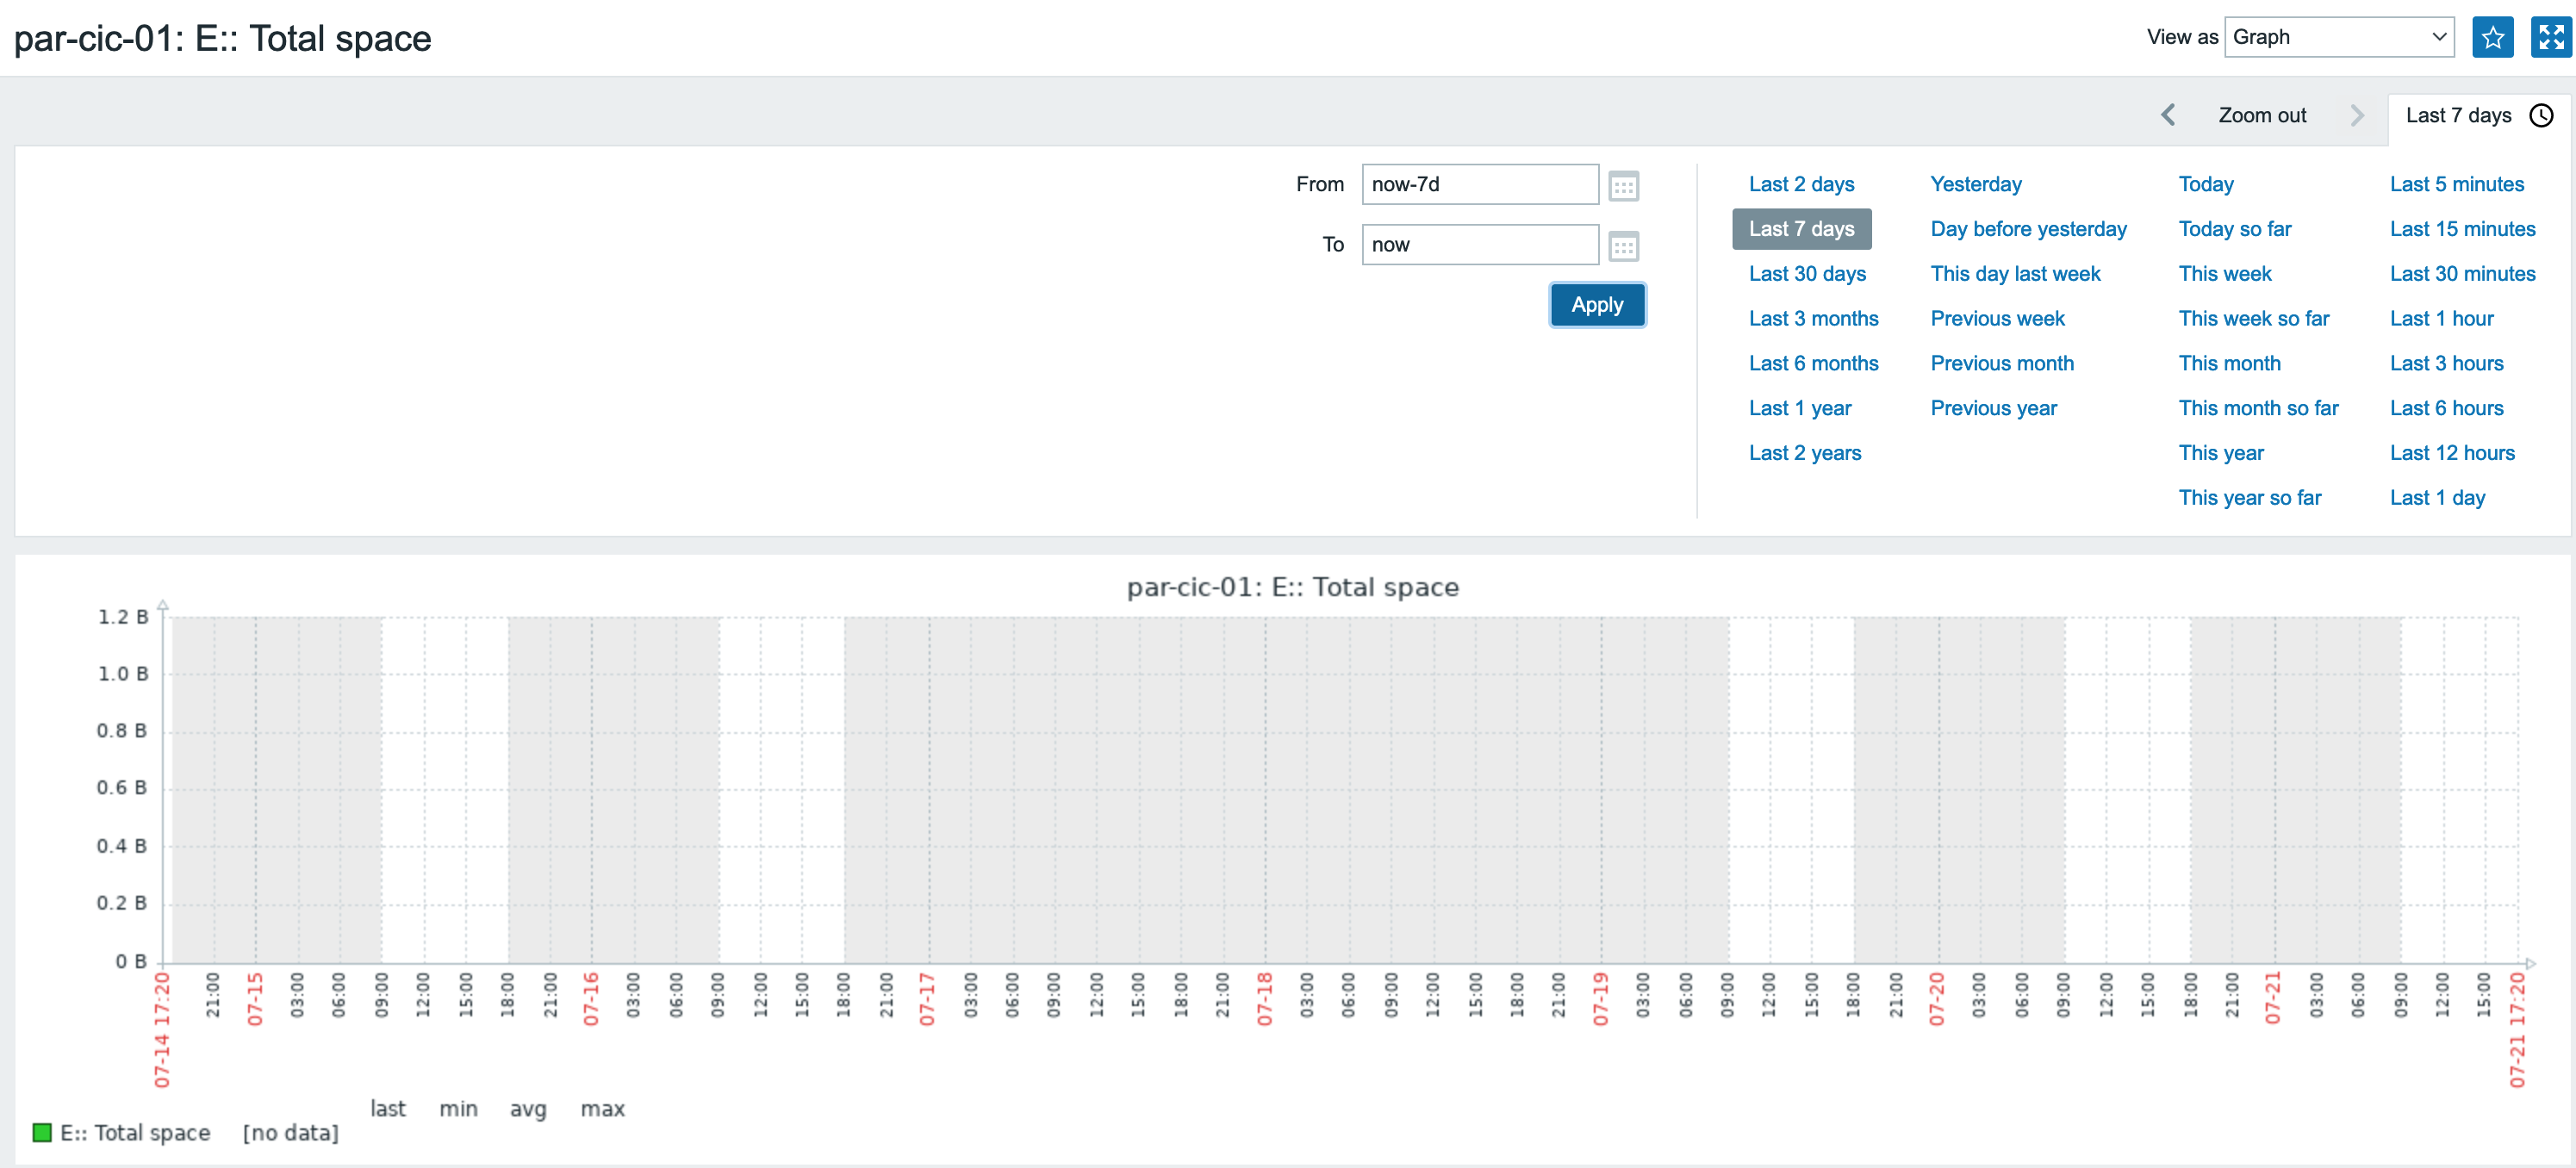
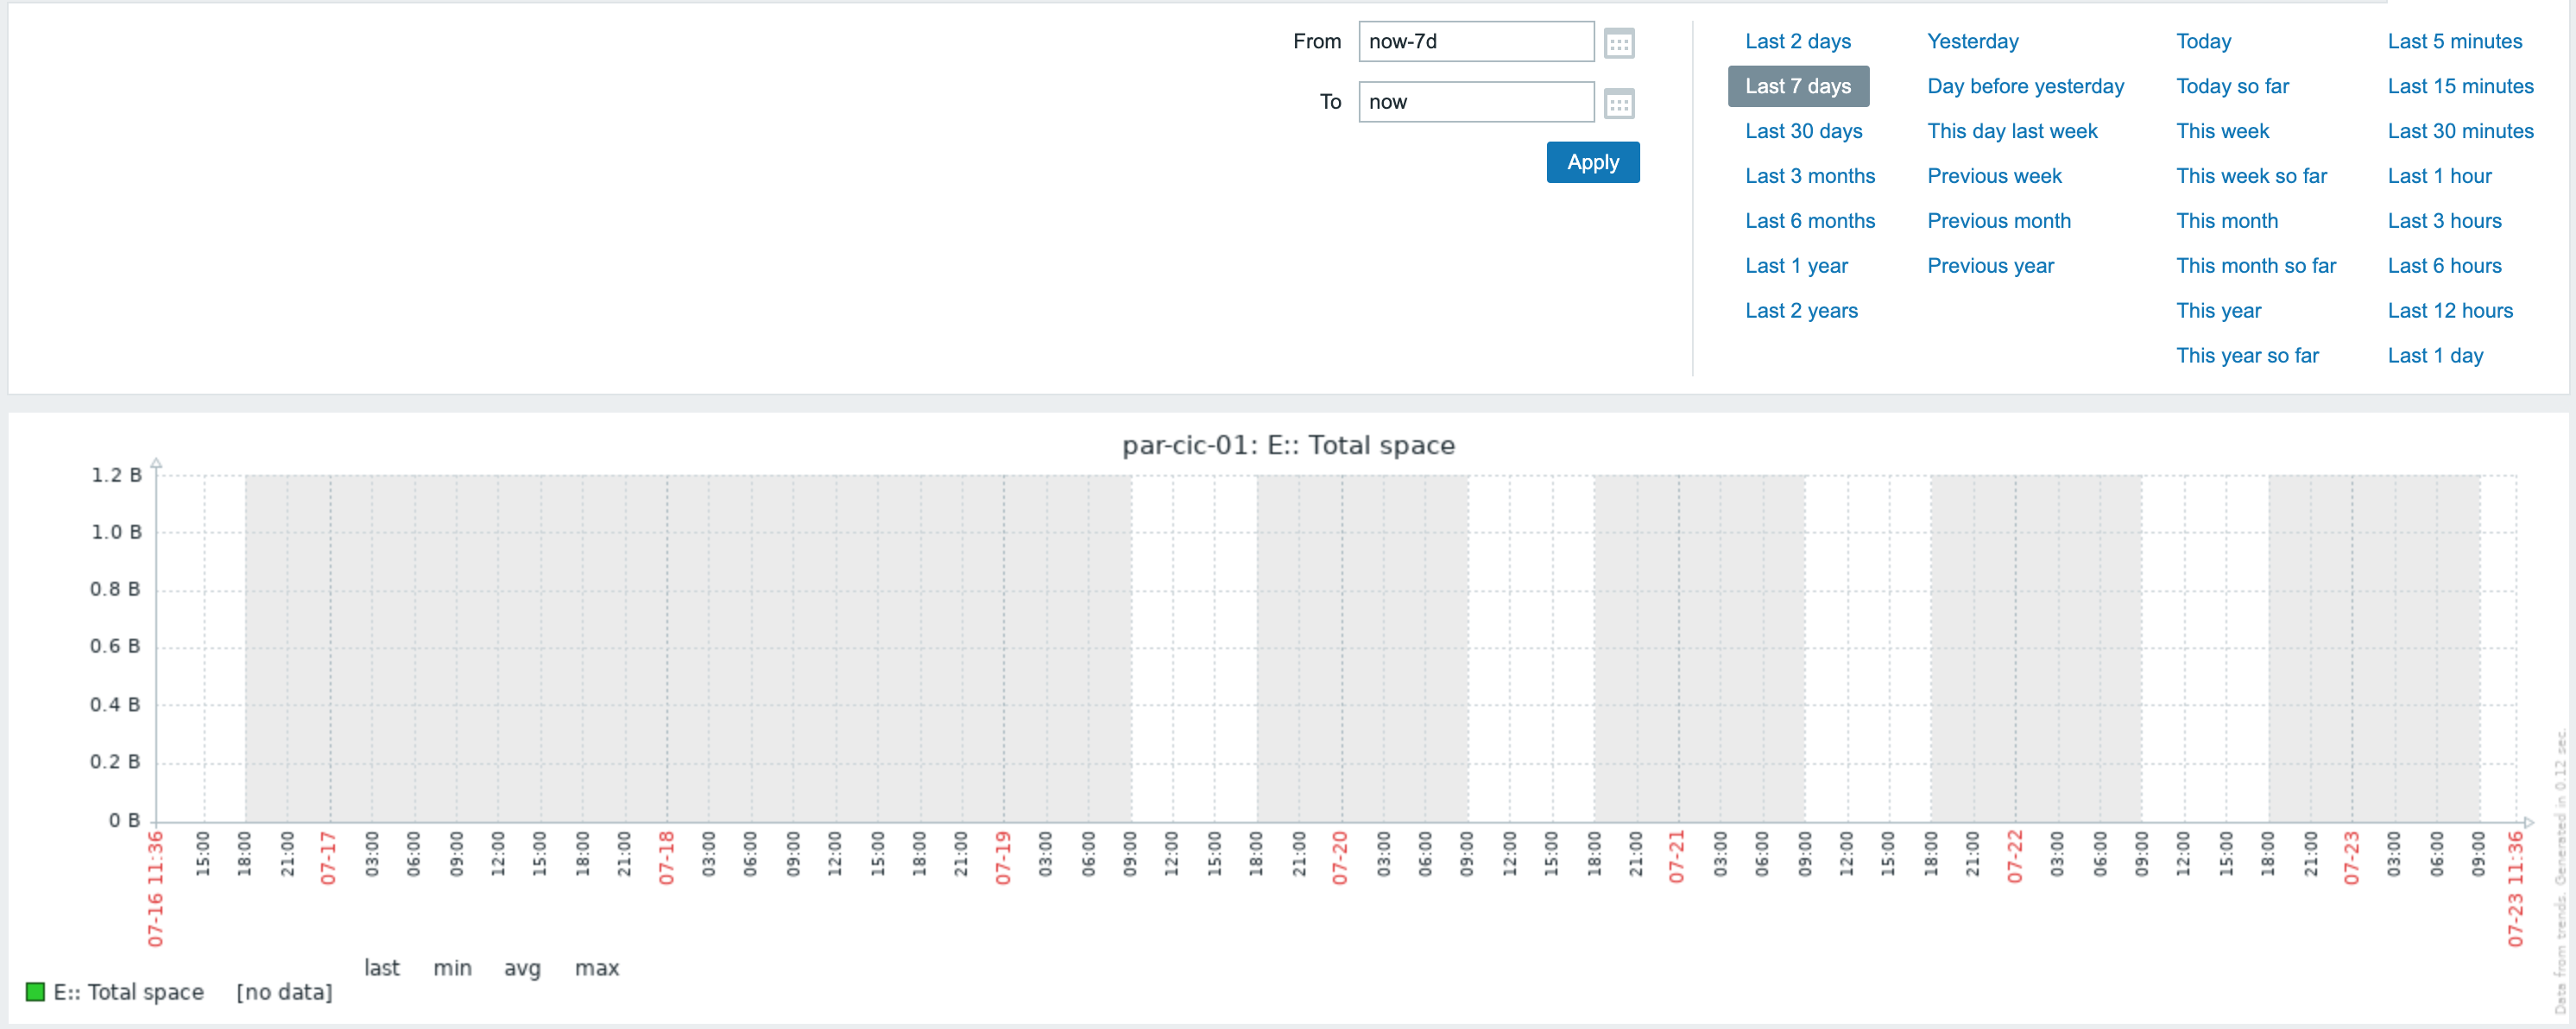
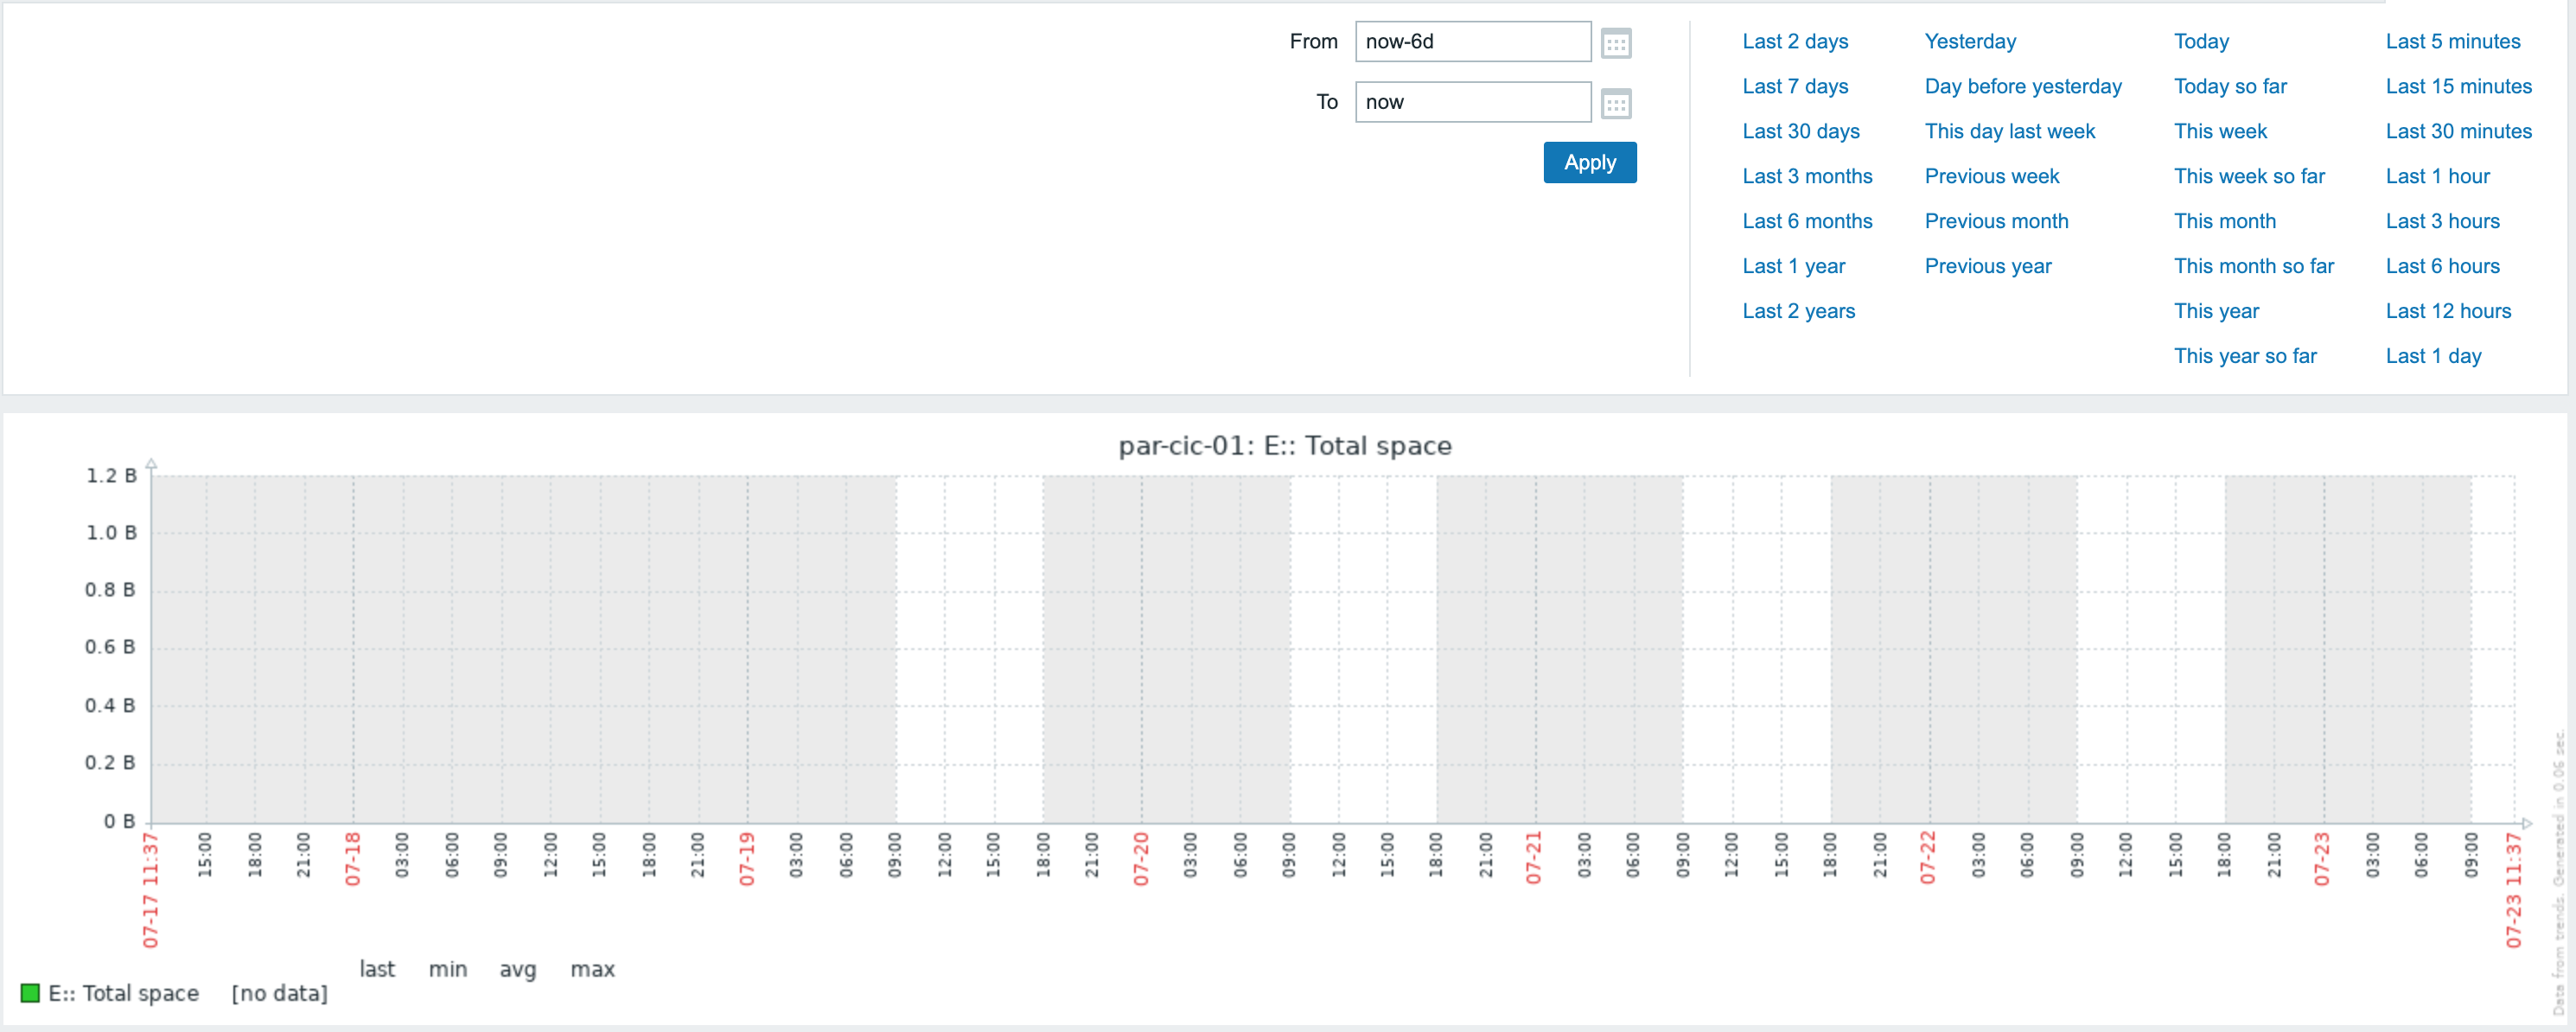
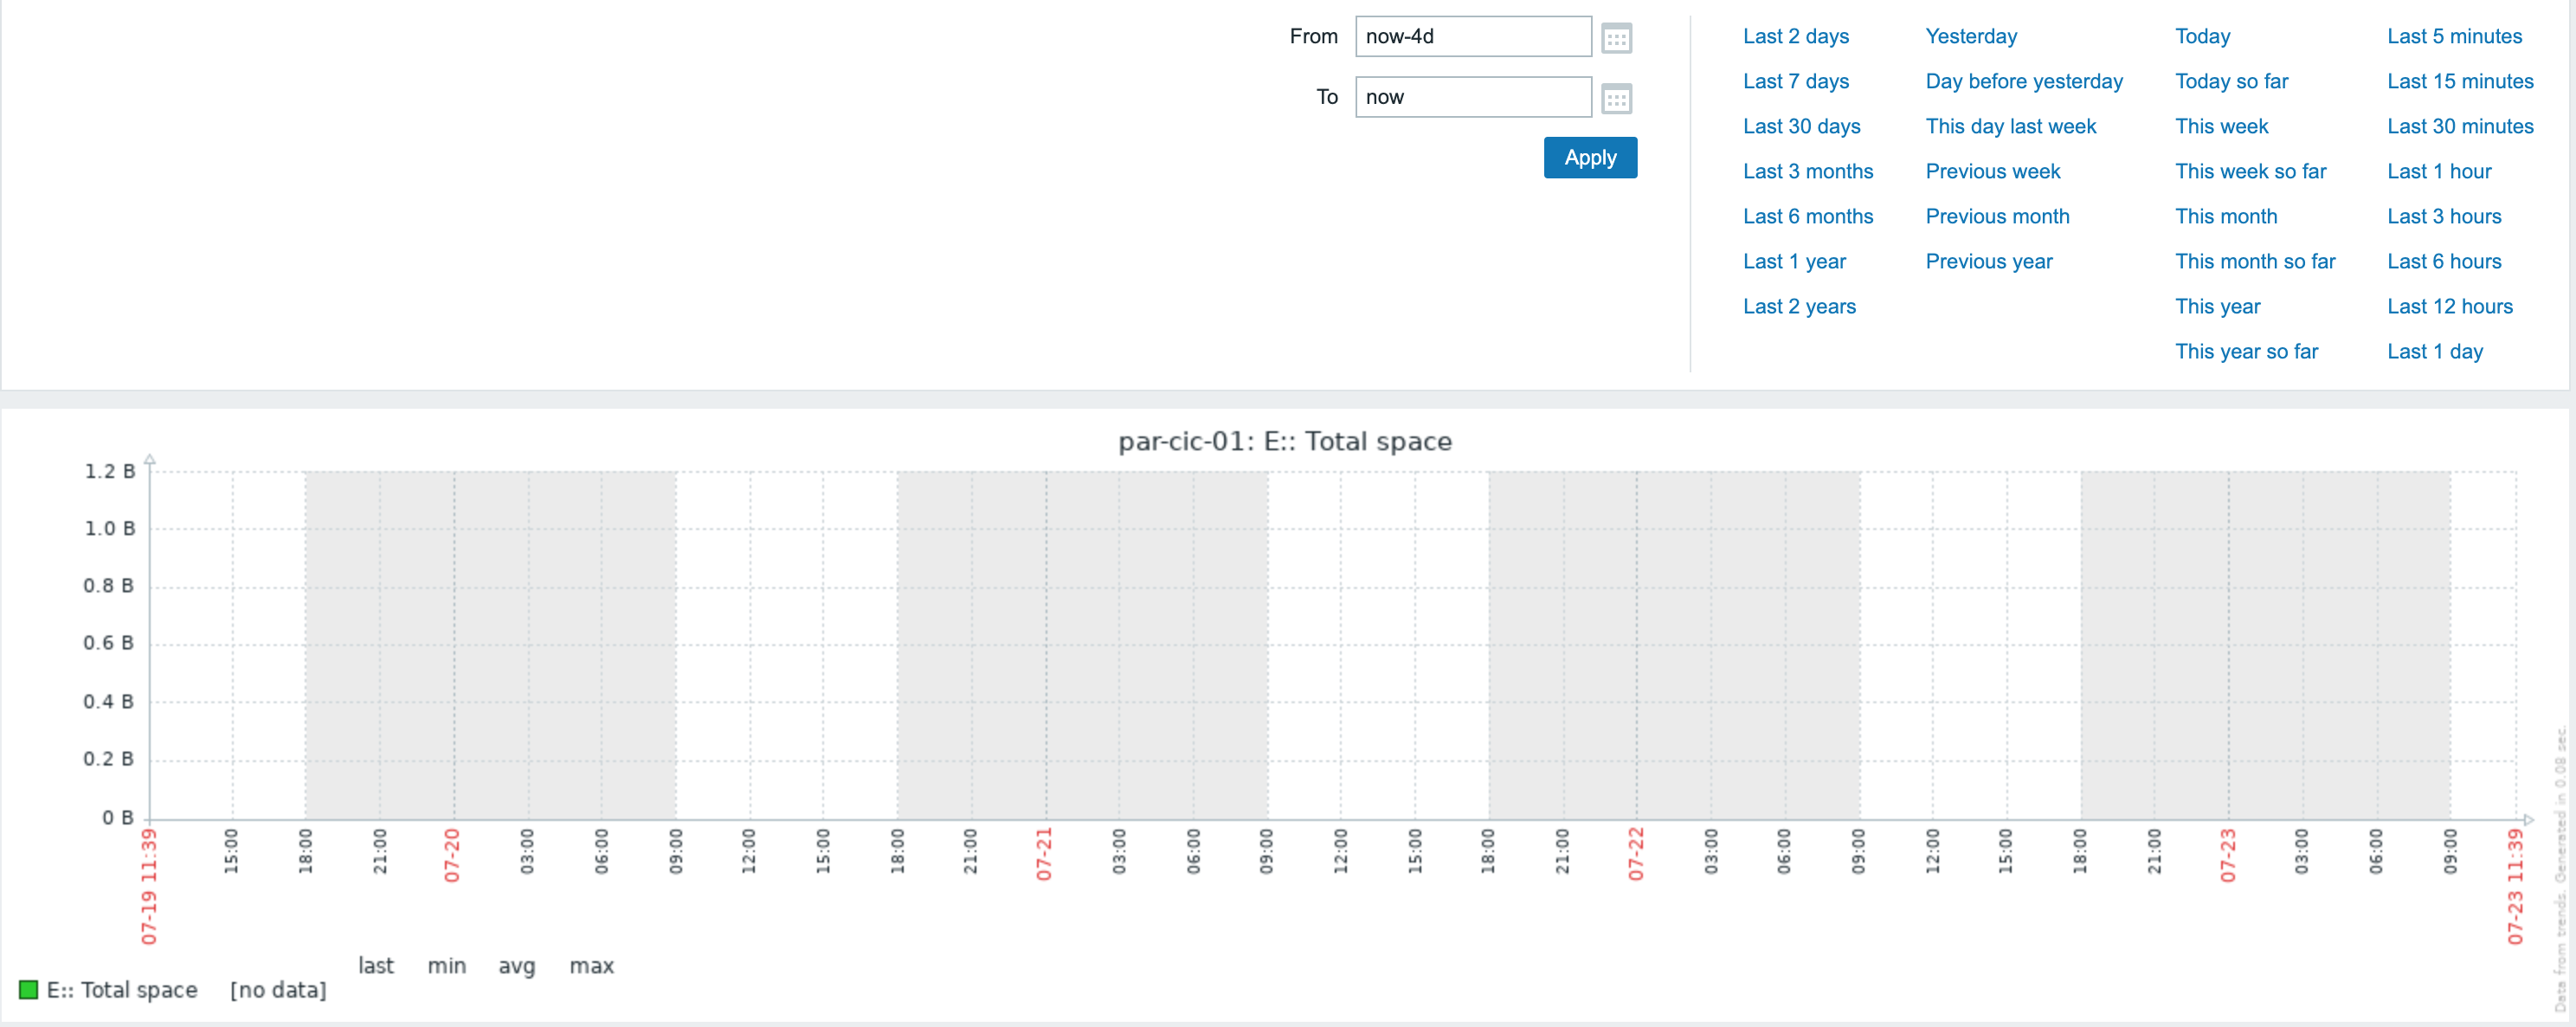
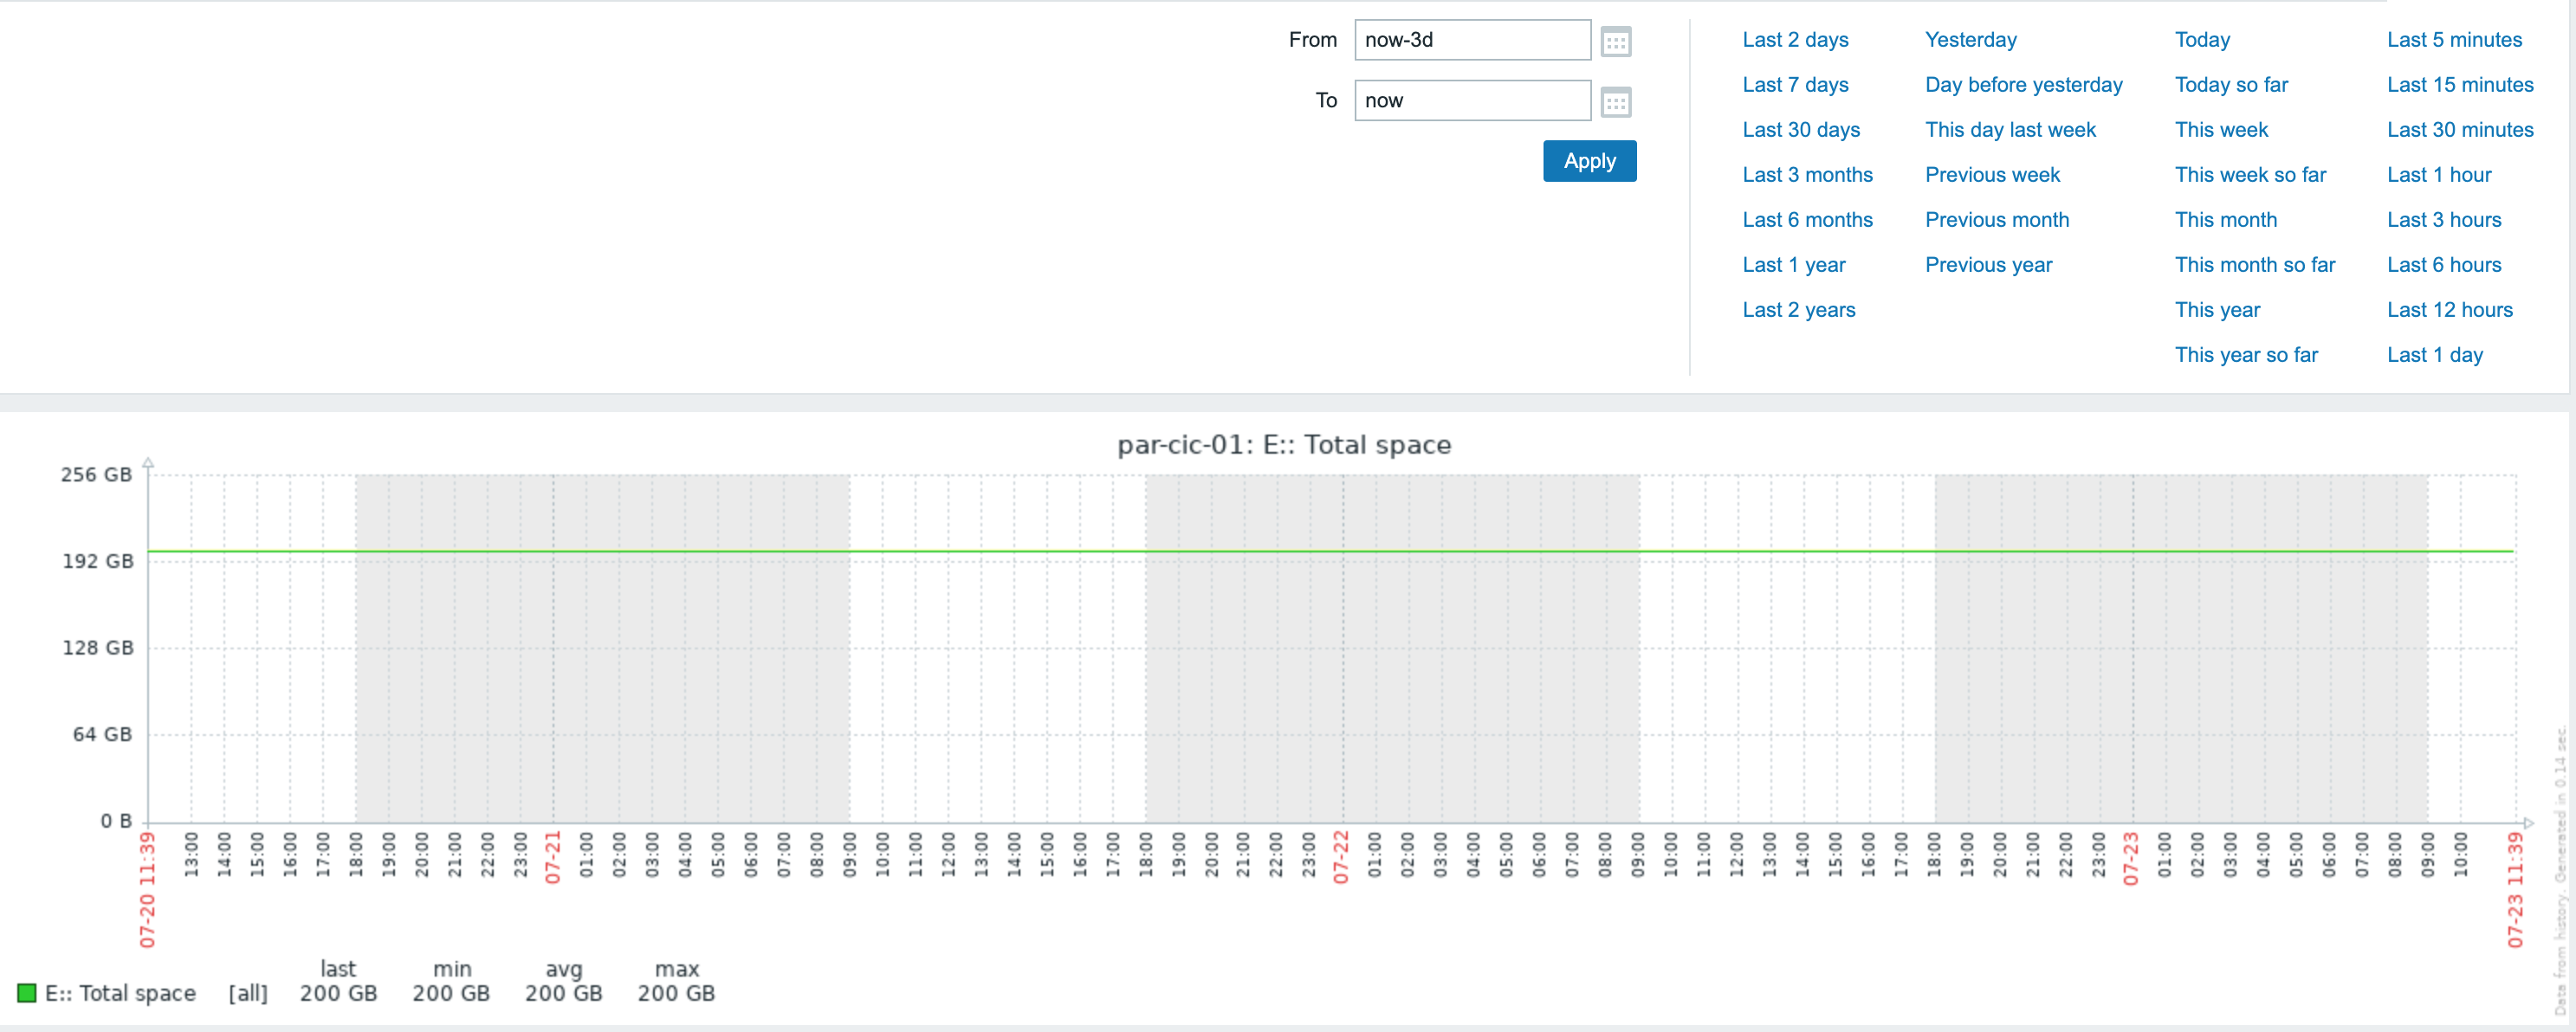
Can you please share your Housekeeper settings? And also please enable Debug mode once again and show to graphs with From now-7d and From now-6d. Notice there is a gray, vertical caption is displayed at the bottom right of a graph indicating where the data come from. There are two options may be - Trends and history. Trends use for period more then week, and history for less then week period. |
| Comment by Aleksey Volodin [ 2021 Jul 23 ] |
|
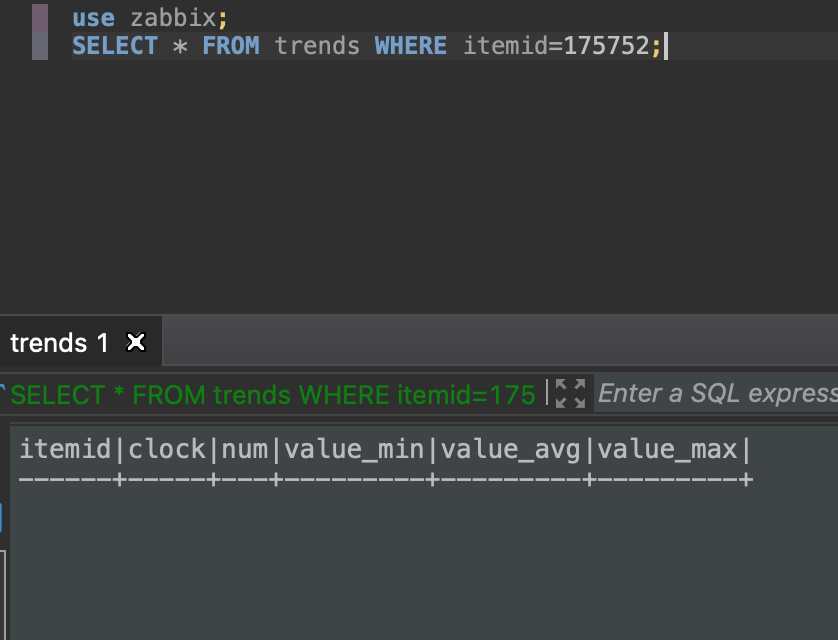
And you can also check is there any trends for you items by using this SQL: SELECT * FROM trends WHERE itemid=ITEMID; Perform this check for items that have graph display problems. |
| Comment by Leandro Mendes Ribeiro [ 2021 Jul 23 ] |
|
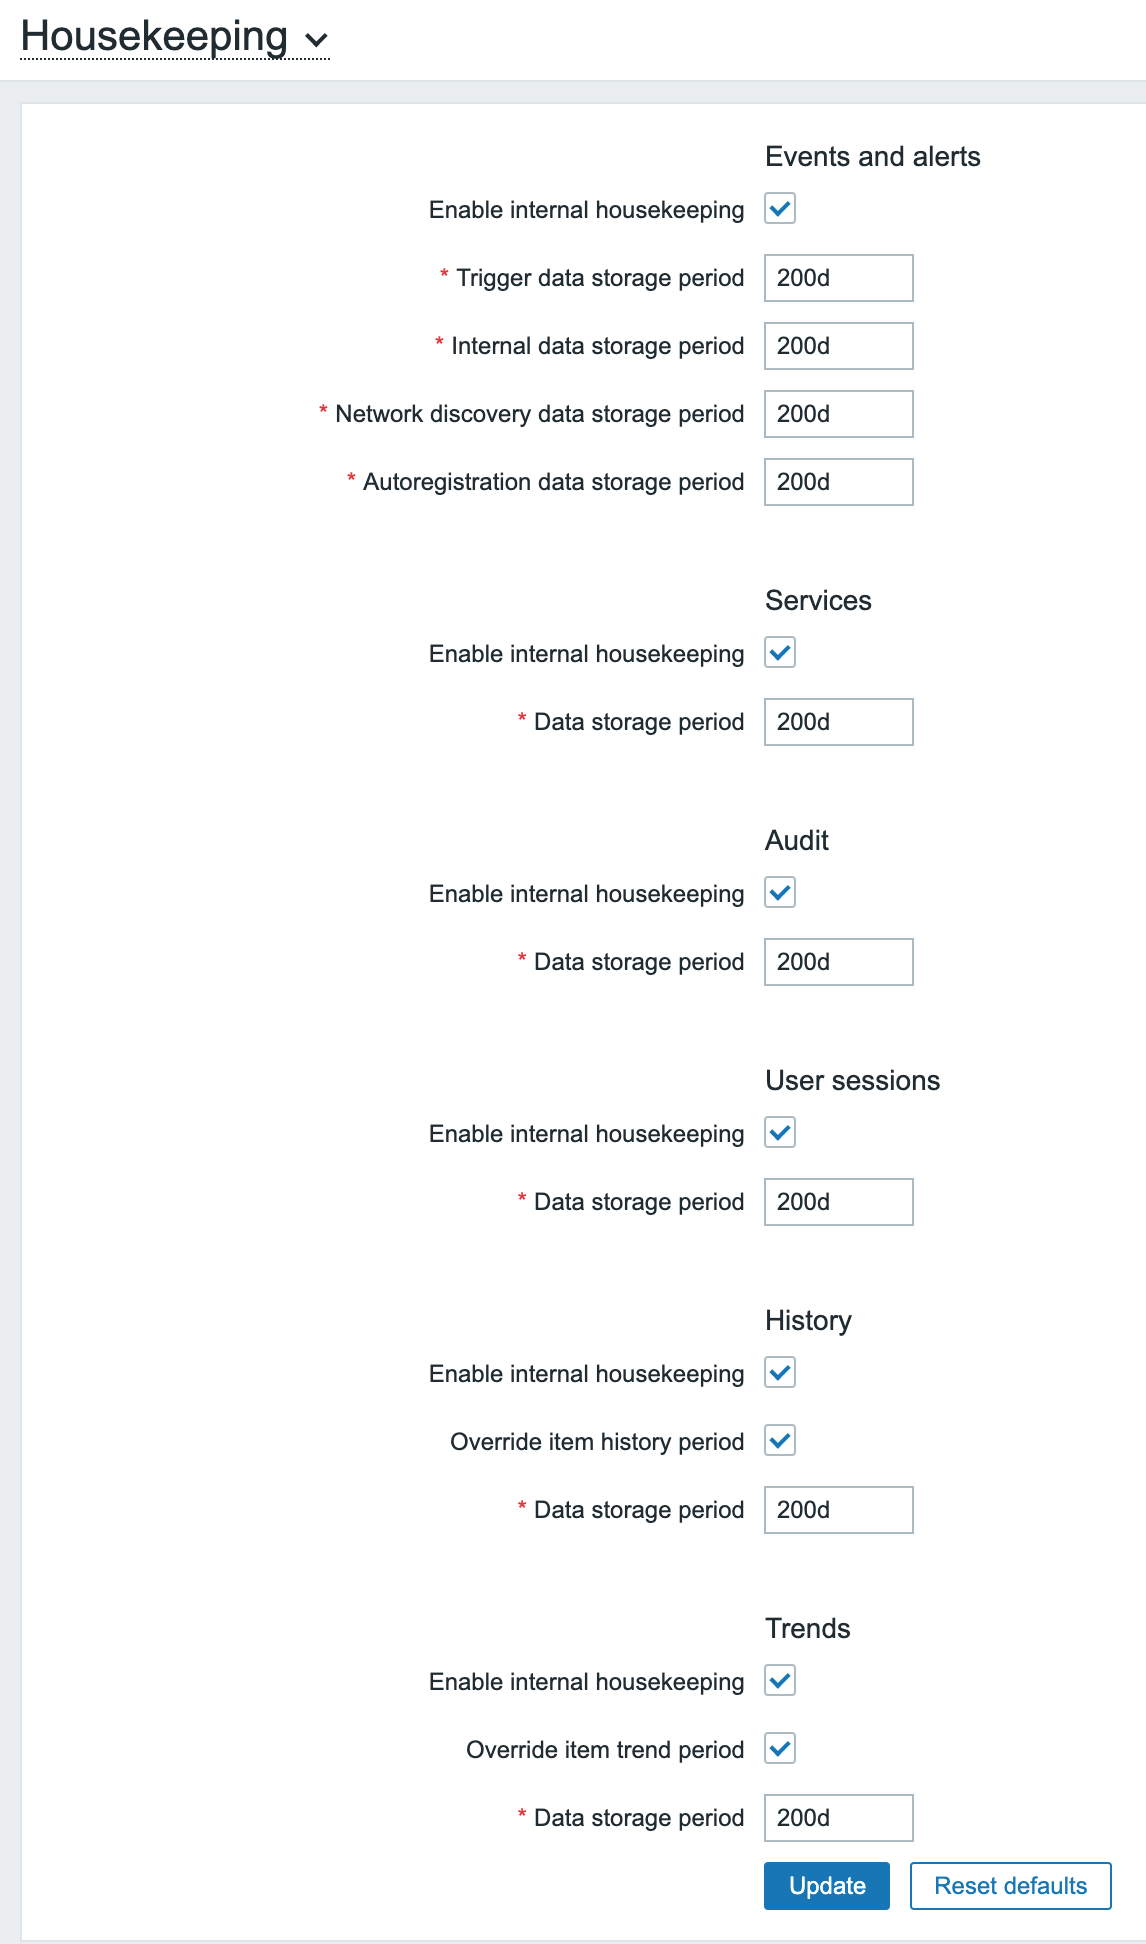
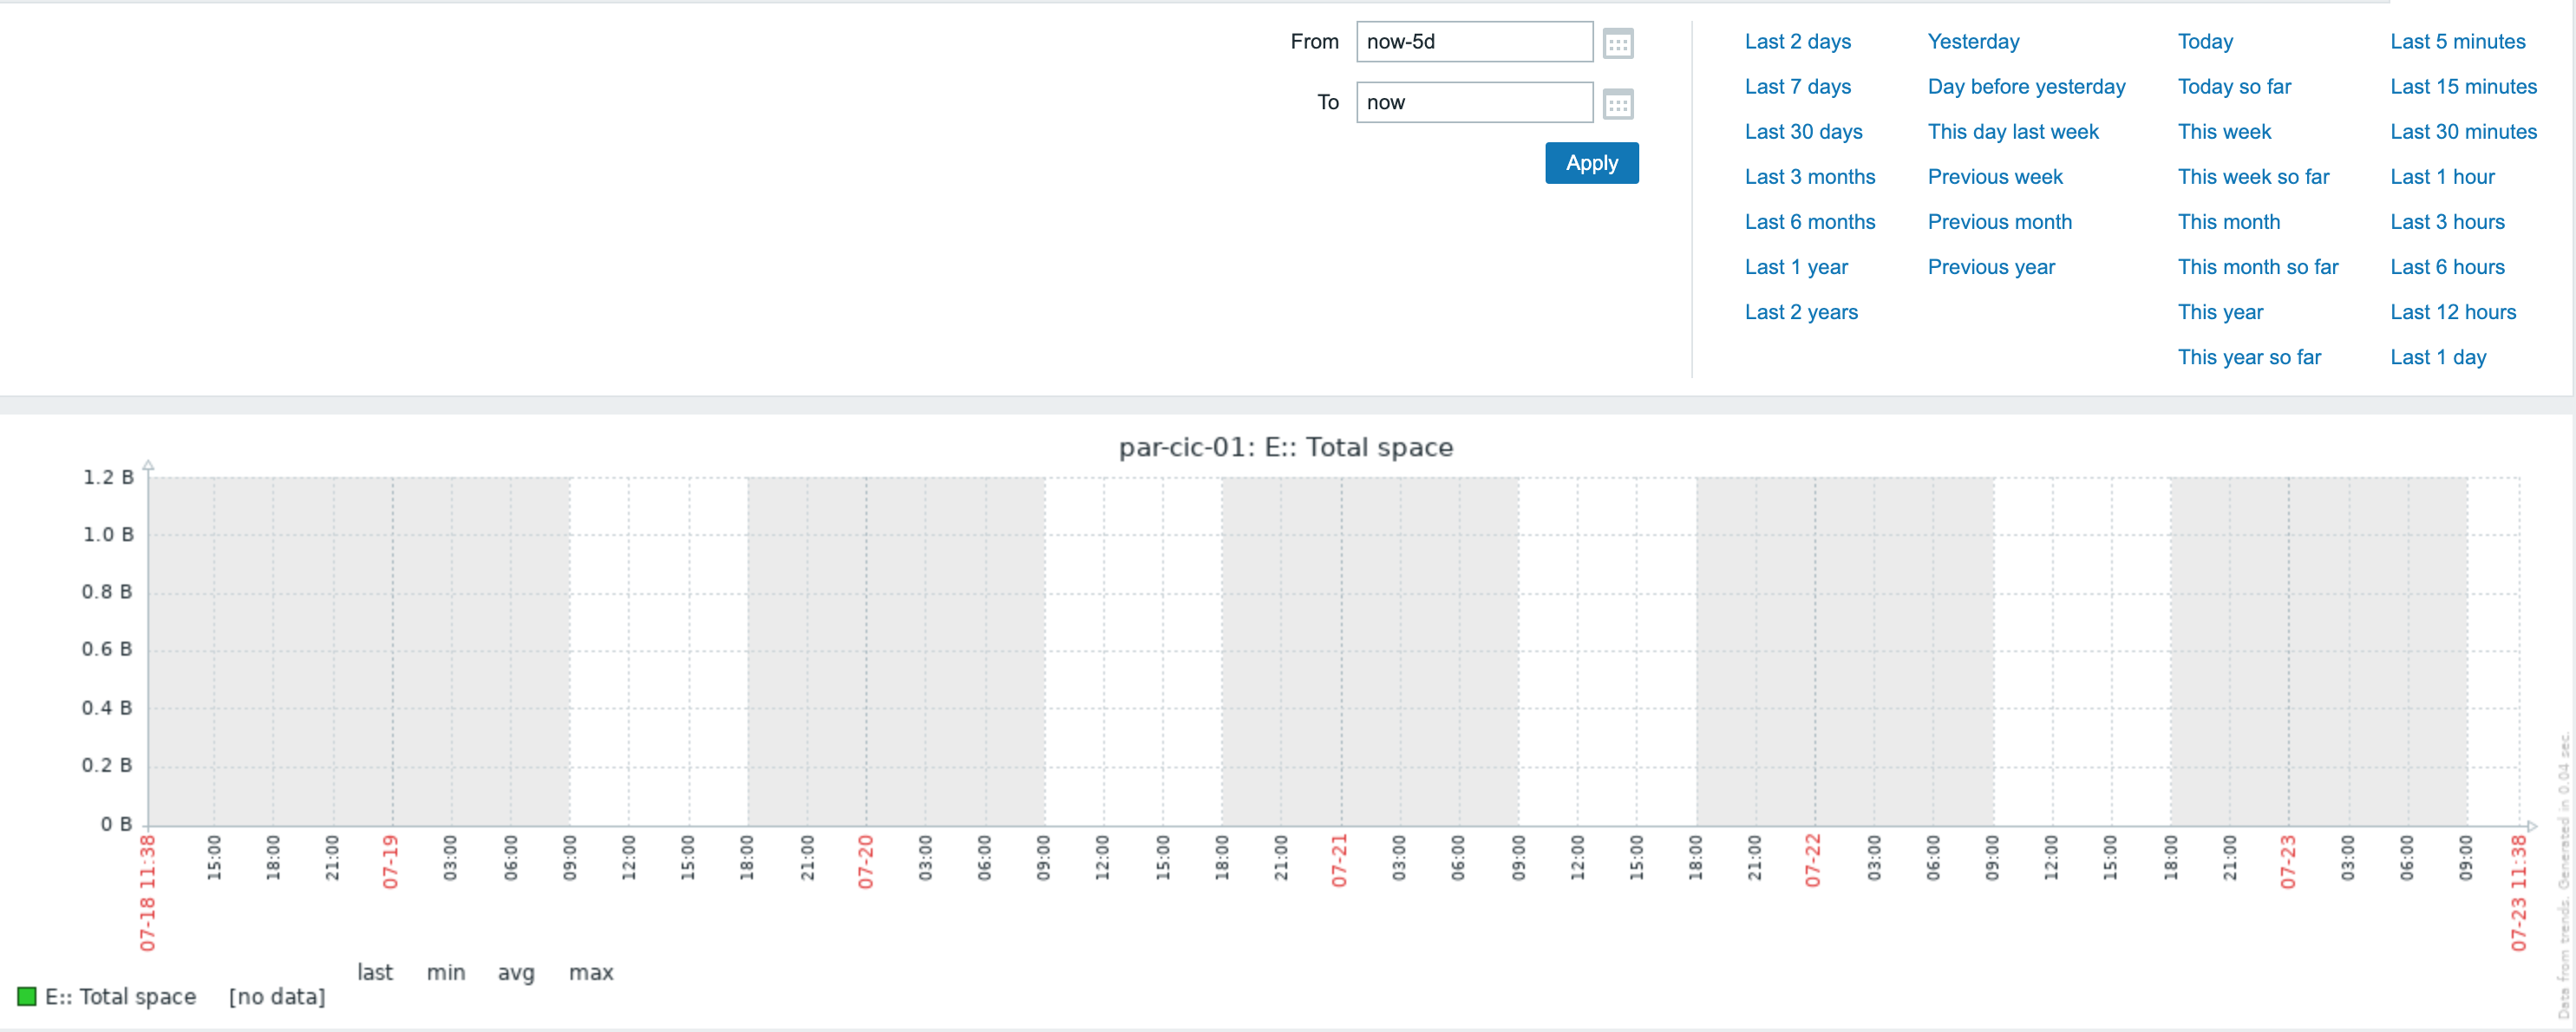
Sure. Housekeeper Settings: As you can see in the prints I'm sending, only when I consult Now-3d that the history table is used...since 4d it is using the trends table. We ran the select you requested and it didn't return any value, but this table is not empty. |
| Comment by Aleksey Volodin [ 2021 Jul 23 ] |
|
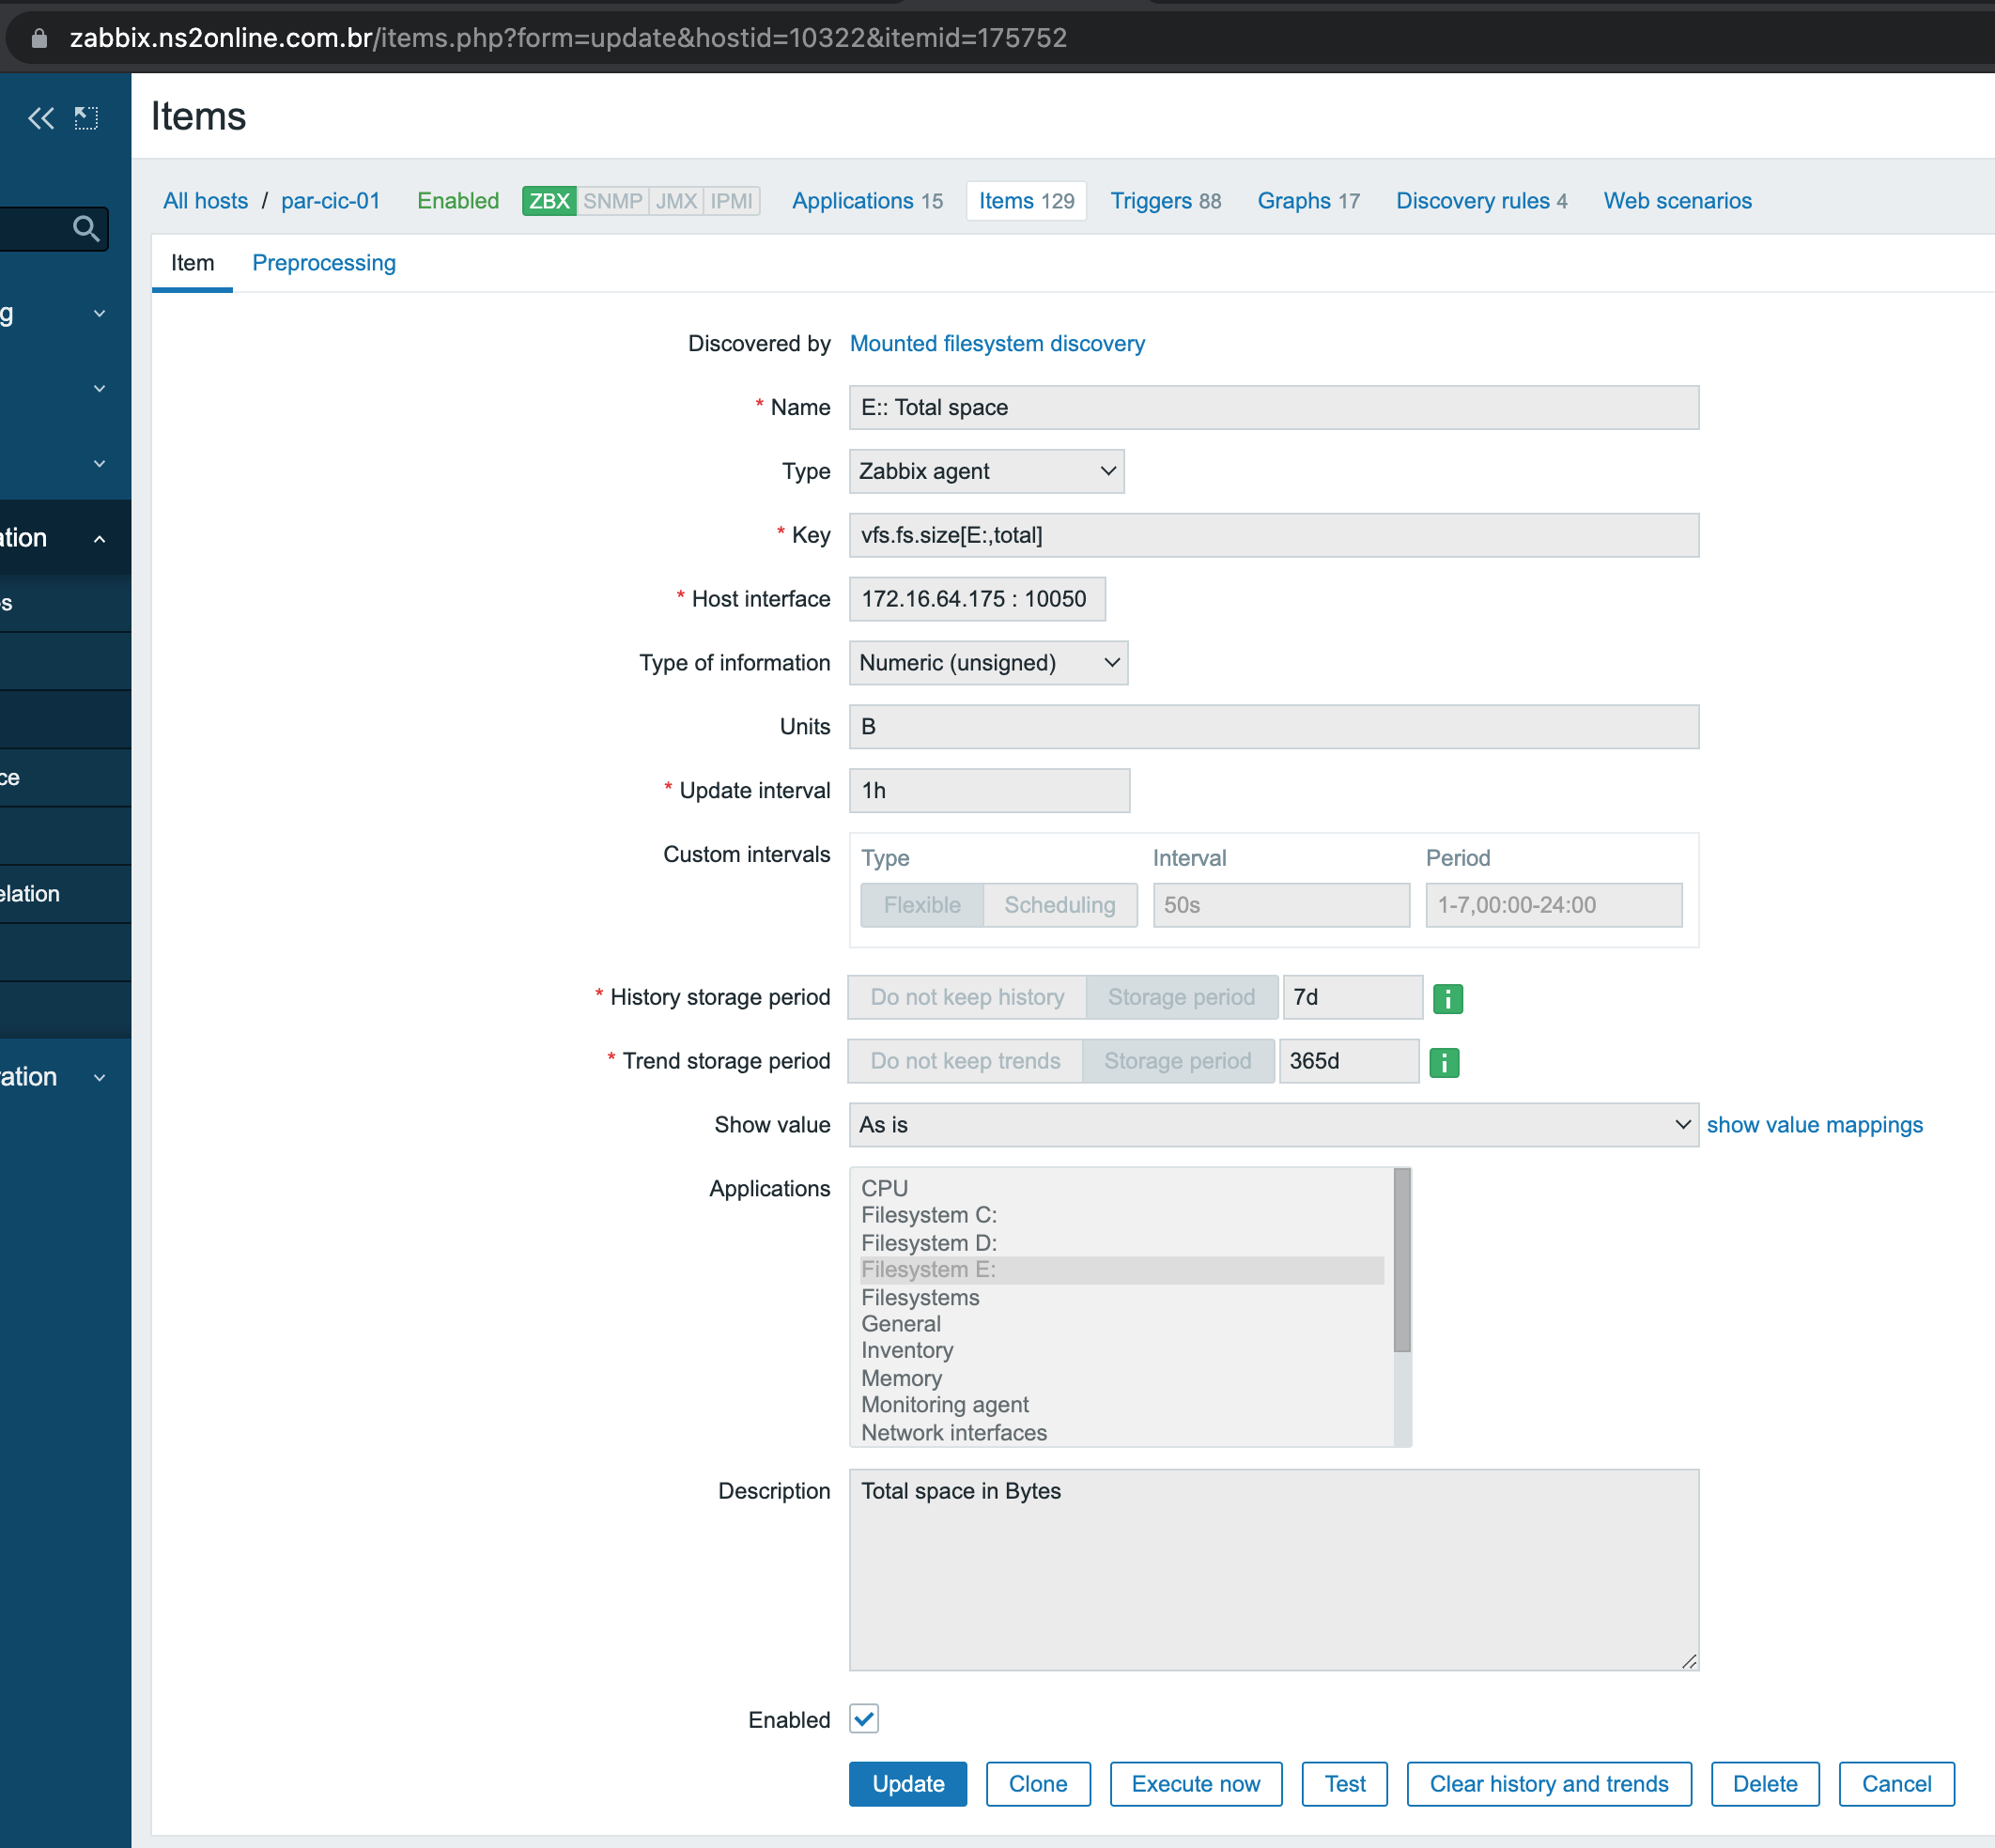
Can you please show settings for Item par-cic-01: E:: Total space? |
| Comment by Aleksey Volodin [ 2021 Jul 23 ] |
|
Also, maybe i missed something but in SQL are you sure to use correct item id?
|
| Comment by Leandro Mendes Ribeiro [ 2021 Jul 23 ] |
|
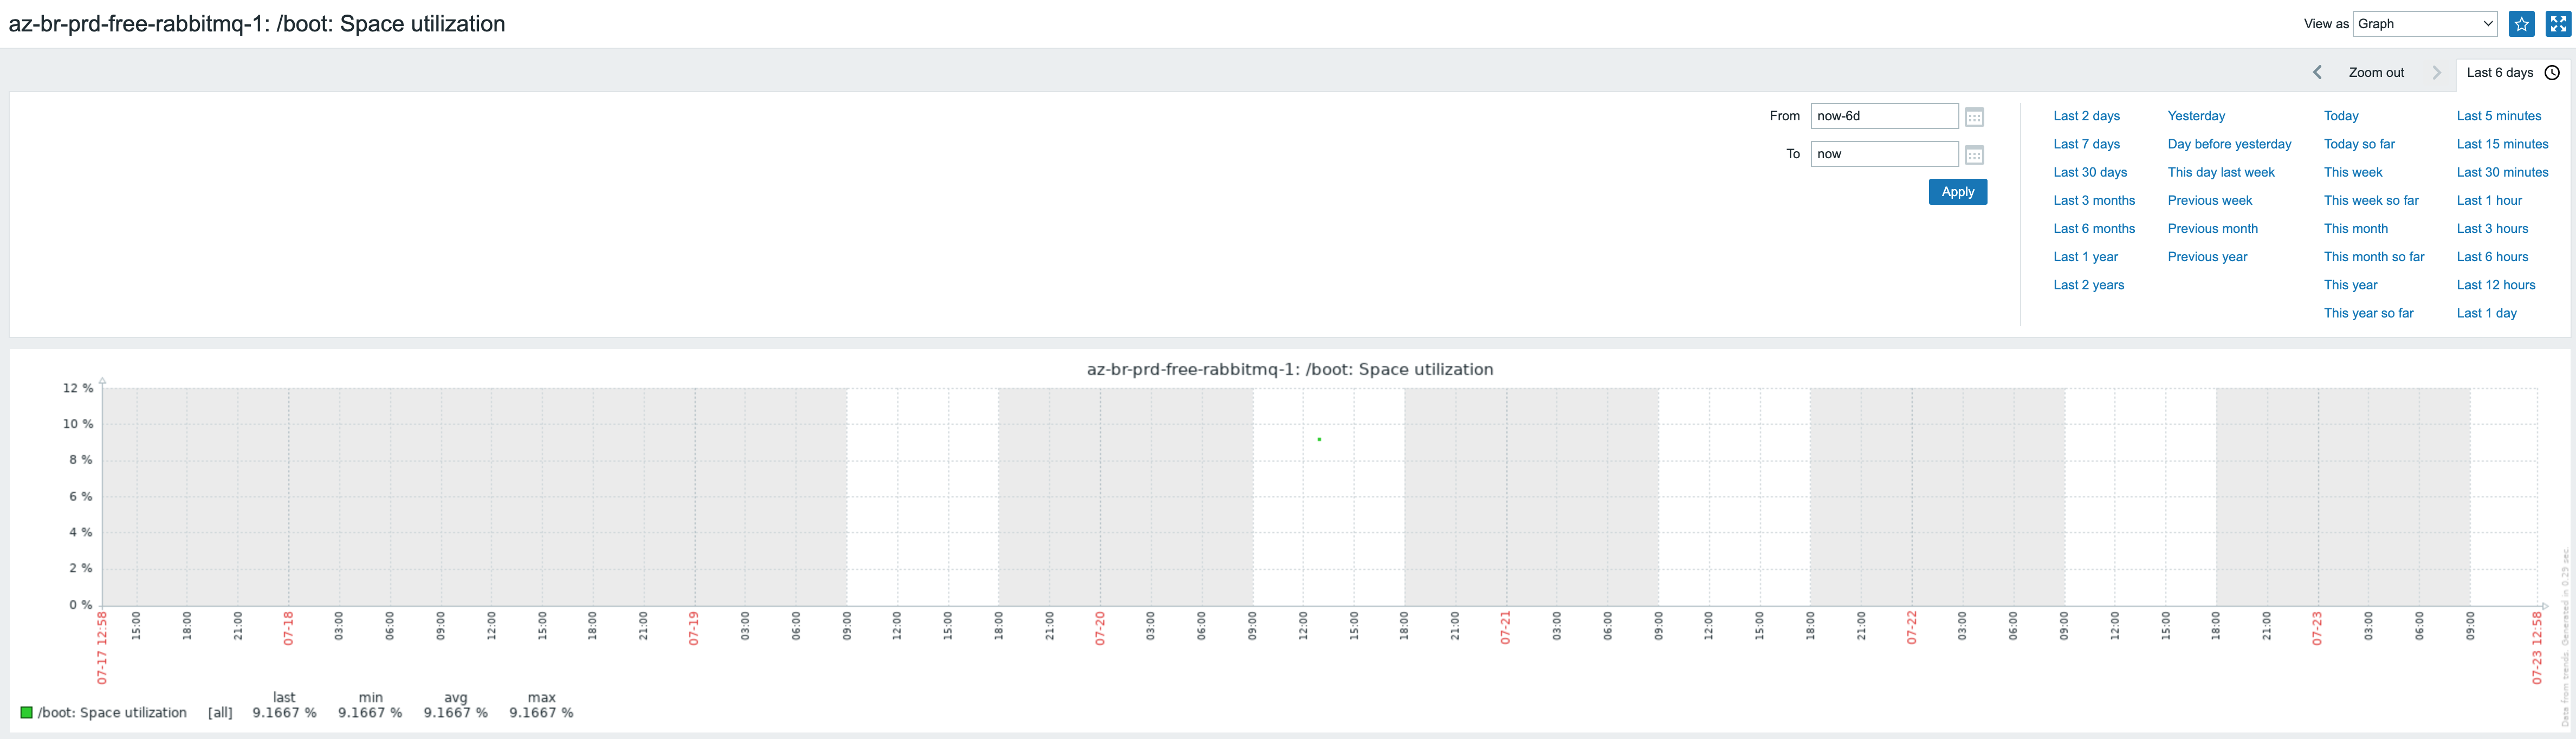
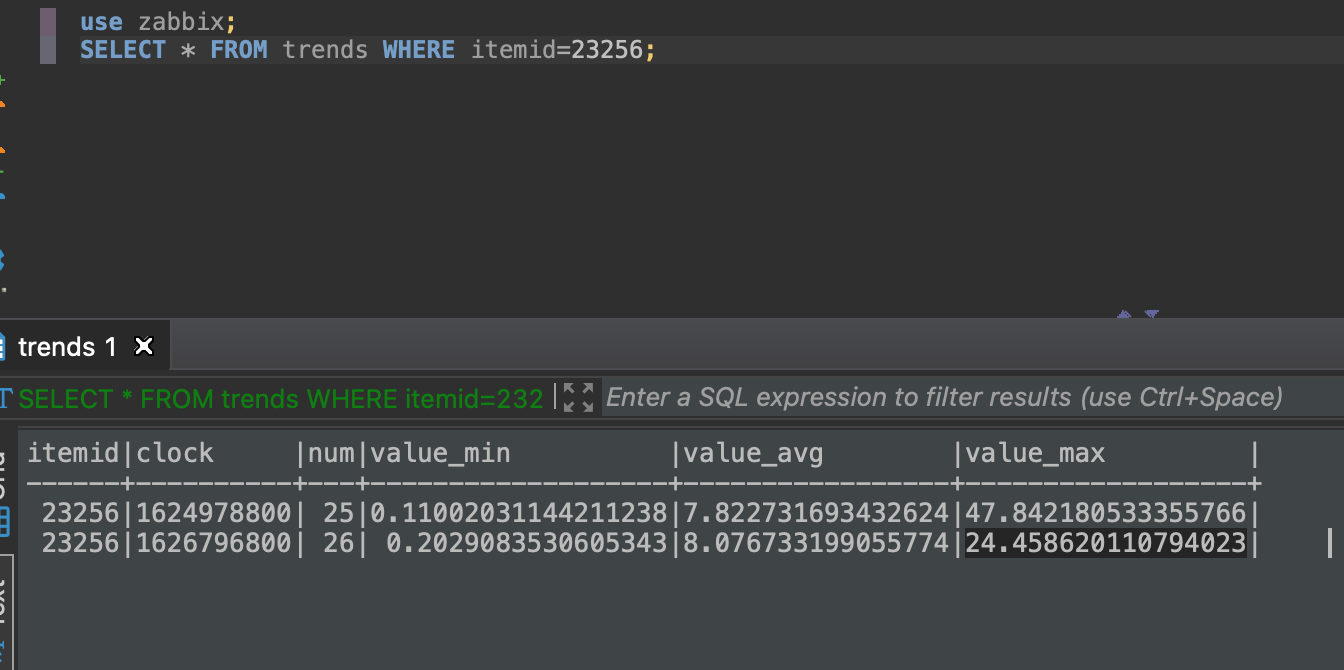
No problem, it's good to ask to be sure...I used '175752' as itemid value. Here is the configuration of the requested item: I checked some items they wrote in trends, basically there is only 1 record every X days...if I pull a graph of these examples, only one point appears on the graph (an example below). Does it seem that there is a problem with the registration in the trends table, or is it still premature to say that? |
| Comment by Leandro Mendes Ribeiro [ 2021 Jul 23 ] |
|
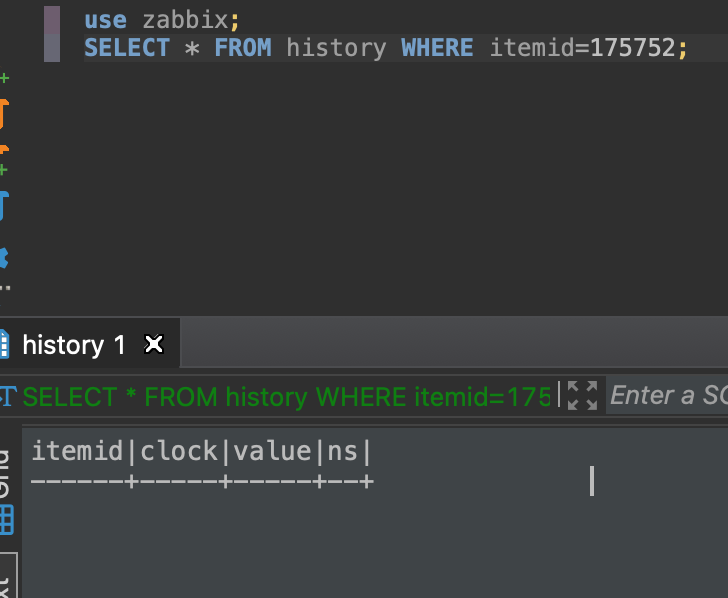
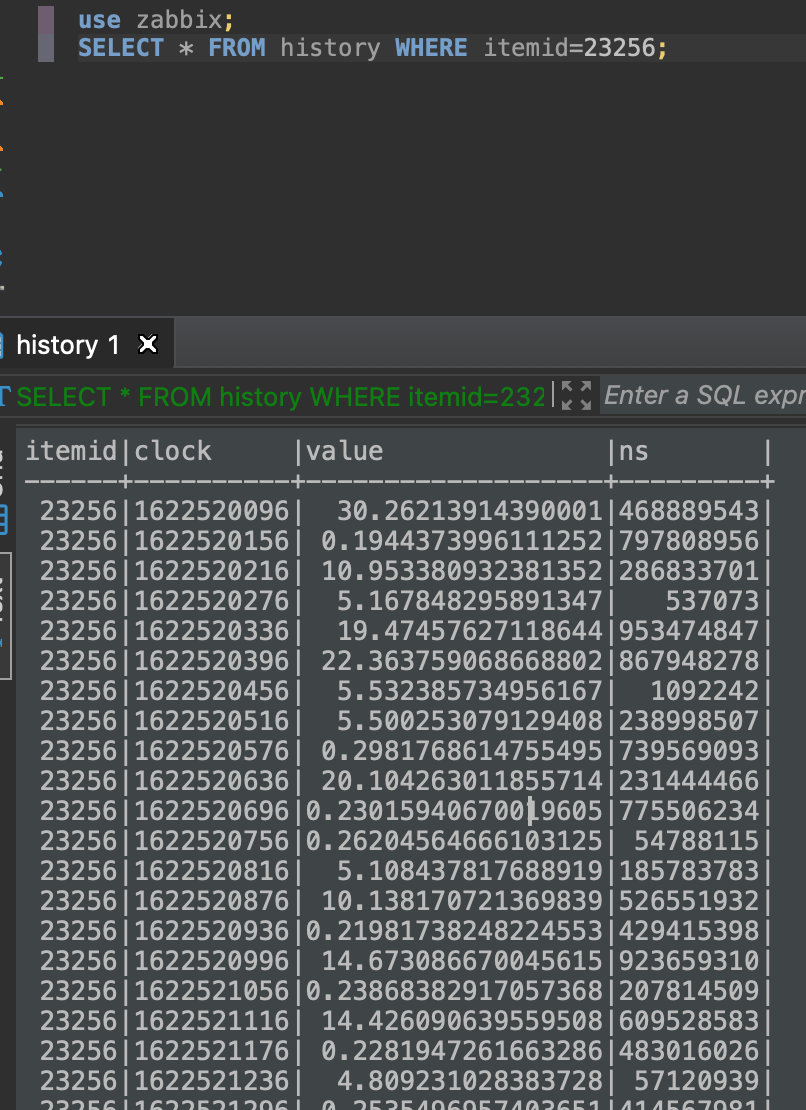
A curious fact...when I tried to make a select on the 'history' table, the itemid=175752 also didn't bring results. On the other hand, another item that has records in the 'trends' table also returned records in the history table. How can itemid 175752 be showing data in the chart if when I select tables it doesn't return any results? |
| Comment by Aleksey Volodin [ 2021 Jul 26 ] |
|
History table store the accurate information for a short period of time, but trends table store an approximate information for long period. So data can be stored in both table at the same time. Also we have cache to sore recently received data. At this point i can say it something wrong with you instance.
|
| Comment by Aleksey Volodin [ 2021 Jul 26 ] |
|
Please be advised that this section of the tracker is for bug reports only. The case you have submitted can not be qualified as one, so please reach out to [email protected] for commercial support (https://zabbix.com/support) or consultancy services. Alternatively, you can also use our IRC channel or community forum (https://www.zabbix.com/forum) for assistance. With that said, we are closing this ticket. Thank you for understanding. |