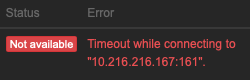
[ZBX-20133] Timeout while connecting via SNMP, but device available Created: 2021 Oct 27 Updated: 2023 Jan 10 Resolved: 2023 Jan 10 |
|
| Status: | Closed |
| Project: | ZABBIX BUGS AND ISSUES |
| Component/s: | Proxy (P), Server (S) |
| Affects Version/s: | 5.4.5 |
| Fix Version/s: | None |
| Type: | Problem report | Priority: | Trivial |
| Reporter: | Yurii Polenok | Assignee: | Igor Gorbach (Inactive) |
| Resolution: | Won't fix | Votes: | 0 |
| Labels: | interface, snmp | ||
| Remaining Estimate: | Not Specified | ||
| Time Spent: | Not Specified | ||
| Original Estimate: | Not Specified | ||
| Environment: |
CentOS Linux release 8.4.2105 |
||
| Attachments: |
|
| Description |
|
Steps to reproduce:
Result:
[root@zabbix-proxy-01 ~]# time snmpwalk -On -v 3 -r 0 -t 30 -a MD5 -l authPriv -u nnm-switches -A q1w2e3r4 -x DES -X w2e3r4t5 10.216.216.167 1.3.6.1.2.1.1.3.0
.1.3.6.1.2.1.1.3.0 = Timeticks: (60699381) 7 days, 0:36:33.81

real    0m0.032s
user    0m0.025s
sys     0m0.003s
Expected: |
| Comments |
| Comment by Igor Gorbach (Inactive) [ 2021 Oct 28 ] |
|
Hello! ZBX - is a bug tracker for identifying and fix some issues in Zabbix functionality |
| Comment by Yurii Polenok [ 2021 Oct 28 ] |
|
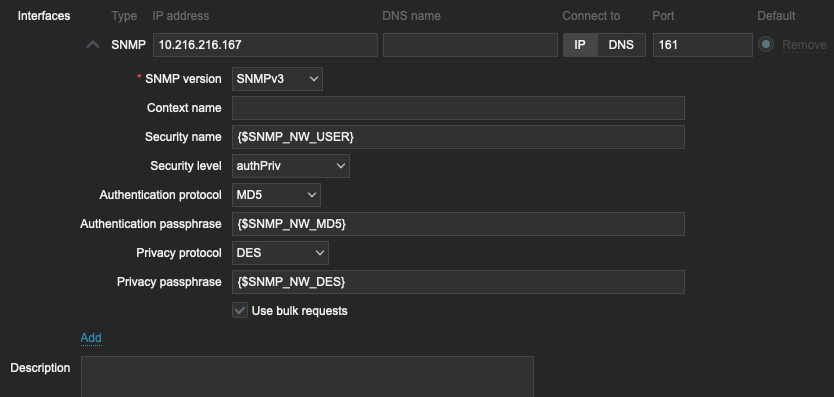
There is one SNMP interface with simple configuration.
|
| Comment by Igor Gorbach (Inactive) [ 2021 Oct 28 ] |
|
Regarding on your description Everything works from a console tool, even from Zabbix with a Test button, but does not work in the item itself. It also works for a while after reloading the snmp cache or restarting the proxy, after a few hours it fails again. It looks like a potential problem with bulk request working on device side But, let's check it more carefully, to find a possible bug Please, provide a tcpdump filtered by UDP:161 for mentioned IP for period when problem occuring (Start working and failing) Regards, Igor |
| Comment by Yurii Polenok [ 2021 Oct 28 ] |
15:53:10.311186 IP (tos 0x0, ttl 64, id 27796, offset 0, flags [DF], proto UDP (17), length 92)
    10.216.218.16.58773 > 10.216.216.167.161: [bad udp cksum 0xc8c1 -> 0x83d7!]  { SNMPv3 { F=r } { USM B=0 T=0 U="" } { ScopedPDU E= C="" { GetRequest(14) R=1480962533  } } }
15:53:10.312489 IP (tos 0x0, ttl 63, id 36380, offset 0, flags [DF], proto UDP (17), length 134)
    10.216.216.167.161 > 10.216.218.16.58773: [udp sum ok]  { SNMPv3 { F= } { USM B=1 T=698243 U="" } { ScopedPDU E=_80_00_61_d9_03_00_00_00_00_00_00 C="" { Report(32) R=1480962533  .1.3.6.1.6.3.15.1.1.4.0=19418 } } }
15:53:10.312606 IP (tos 0x0, ttl 64, id 27797, offset 0, flags [DF], proto UDP (17), length 166)
    10.216.218.16.58773 > 10.216.216.167.161: [bad udp cksum 0xc90b -> 0x602c!]  { SNMPv3 { F=apr } { USM B=1 T=5720469 U="nnm-switches" } { ScopedPDU [!scoped PDU]83_3b_7c_6c_68_a7_44_9f_73_13_d7_be_53_94_4a_93_21_c1_5e_0c_c0_dd_5c_df_ce_21_d7_a6_3b_3e_5e_b3_73_2f_98_96_35_f7_4e_c1_b9_2d_21_93_b1_f6_3c_af} }
15:53:10.313084 IP (tos 0x0, ttl 63, id 36381, offset 0, flags [DF], proto UDP (17), length 155)
    10.216.216.167.161 > 10.216.218.16.58773: [udp sum ok]  { SNMPv3 { F=a } { USM B=1 T=698243 U="nnm-switches" } { ScopedPDU E=_80_00_61_d9_03_00_00_00_00_00_00 C="" { Report(29) R=0  .1.3.6.1.6.3.15.1.1.2.0=7506 } } }
15:53:37.097891 IP (tos 0x0, ttl 64, id 41669, offset 0, flags [DF], proto UDP (17), length 92)
    10.216.218.16.11009 > 10.216.216.167.161: [bad udp cksum 0xc8c1 -> 0x85c6!]  { SNMPv3 { F=r } { USM B=0 T=0 U="" } { ScopedPDU E= C="" { GetRequest(14) R=1069165268  } } }
15:53:37.099018 IP (tos 0x0, ttl 63, id 56618, offset 0, flags [DF], proto UDP (17), length 134)
    10.216.216.167.161 > 10.216.218.16.11009: [udp sum ok]  { SNMPv3 { F= } { USM B=1 T=698270 U="" } { ScopedPDU E=_80_00_61_d9_03_00_00_00_00_00_00 C="" { Report(32) R=1069165268  .1.3.6.1.6.3.15.1.1.4.0=19419 } } }
15:53:37.099077 IP (tos 0x0, ttl 64, id 41670, offset 0, flags [DF], proto UDP (17), length 166)
    10.216.218.16.11009 > 10.216.216.167.161: [bad udp cksum 0xc90b -> 0xcefd!]  { SNMPv3 { F=apr } { USM B=1 T=5718648 U="nnm-switches" } { ScopedPDU [!scoped PDU]37_d5_f0_6c_98_57_62_5a_fa_db_f3_ac_96_45_38_38_11_a6_b3_e9_4e_9c_31_39_77_35_bd_1b_f8_ff_bf_89_2c_1a_ec_cf_58_ea_04_11_b3_b8_7c_59_13_0d_b8_7d} }
15:53:37.099583 IP (tos 0x0, ttl 63, id 56619, offset 0, flags [DF], proto UDP (17), length 155)
    10.216.216.167.161 > 10.216.218.16.11009: [udp sum ok]  { SNMPv3 { F=a } { USM B=1 T=698270 U="nnm-switches" } { ScopedPDU E=_80_00_61_d9_03_00_00_00_00_00_00 C="" { Report(29) R=0  .1.3.6.1.6.3.15.1.1.2.0=7507 } } }
15:53:40.342648 IP (tos 0x0, ttl 64, id 41862, offset 0, flags [DF], proto UDP (17), length 166)
    10.216.218.16.58773 > 10.216.216.167.161: [bad udp cksum 0xc90b -> 0x1ed6!]  { SNMPv3 { F=apr } { USM B=1 T=5720499 U="nnm-switches" } { ScopedPDU [!scoped PDU]fa_72_d2_76_7f_81_28_f4_31_6a_6f_75_03_79_9a_a8_27_17_f1_6c_b5_71_b1_6f_e6_31_9e_1d_12_b7_40_05_47_c8_32_67_7c_0d_99_24_92_4d_20_96_c4_8e_9a_78} }
15:53:40.343620 IP (tos 0x0, ttl 63, id 57769, offset 0, flags [DF], proto UDP (17), length 155)
    10.216.216.167.161 > 10.216.218.16.58773: [udp sum ok]  { SNMPv3 { F=a } { USM B=1 T=698273 U="nnm-switches" } { ScopedPDU E=_80_00_61_d9_03_00_00_00_00_00_00 C="" { Report(29) R=0  .1.3.6.1.6.3.15.1.1.2.0=7508 } } }
Found that 3 devices have the same EngineID. |
| Comment by Igor Gorbach (Inactive) [ 2023 Jan 04 ] |
|
SNMP v3 requires unique Engine Id for each device https://snmp.com/products/securityanalyzer/demo/dupengid.html Please, change the EngineID for the affected devices If the problem will be occur again after that - let us know |