[ZBX-20744] False high-bandwidth monitoring values by snmp Created: 2022 Mar 14 Updated: 2025 Nov 01 Resolved: 2025 Nov 01 |
|
| Status: | Closed |
| Project: | ZABBIX BUGS AND ISSUES |
| Component/s: | Server (S) |
| Affects Version/s: | 5.0.21 |
| Fix Version/s: | None |
| Type: | Documentation task | Priority: | Trivial |
| Reporter: | Mikko Tikkala | Assignee: | Vladislavs Sokurenko |
| Resolution: | Fixed | Votes: | 4 |
| Labels: | None | ||
| Remaining Estimate: | Not Specified | ||
| Time Spent: | 4h | ||
| Original Estimate: | Not Specified | ||
| Environment: |
Debian 10 VM |
||
| Attachments: |
|
| Sprint: | Documentation backlog |
| Story Points: | 0.125 |
| Description |
|
Issue has been discussed here:
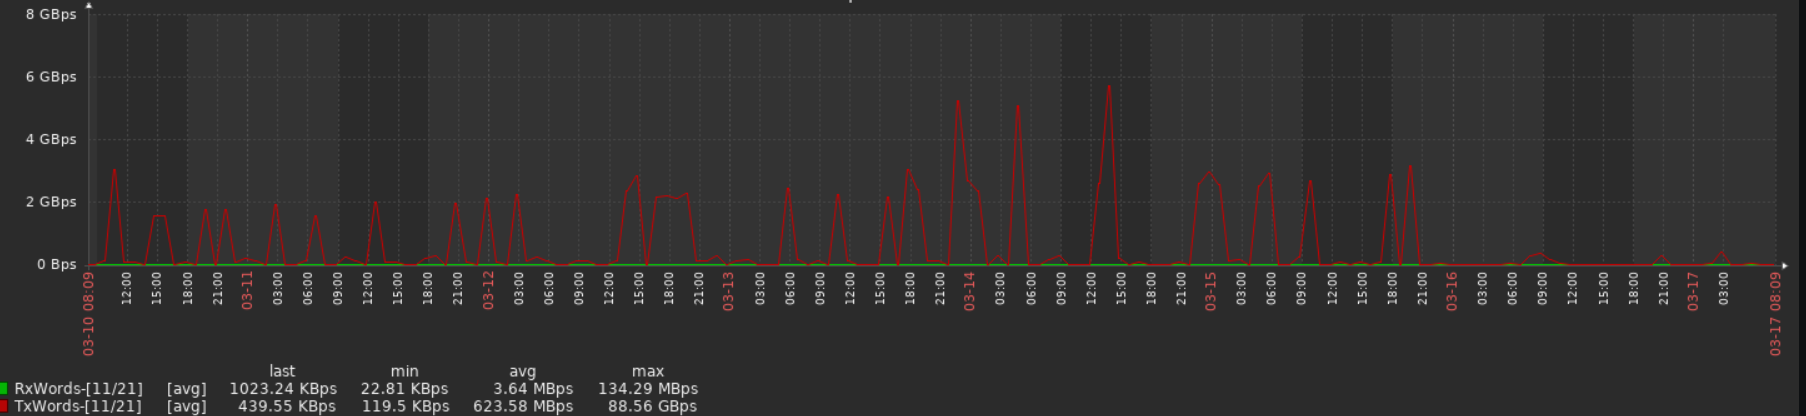
Sometimes change per second calculation produces very big values (terabits per sec on 1gigabit interface). Usually faulty values are related to outbound traffic (ifhcoutoctets, ifoutunicastpkts). Raw snmp counter values seems to grow steadily, snmpwalk shows also reasonable values.
In my case faulty values didn't show up after bulk requests was disabled. Another user says that disabling bulk requests made faulty values more rare.
Could there be some overflow etc. which could mess values with bulk requests?
In my case there is Cisco IE-5000 switch with ~700 items. Polling cycle of items is 5min. Zabbix server has less than 100 NVPS.
Problems can be seen with following Zabbix versions 4.0.16, 5.0.10, 5.0.19, 5.0.21.
|
| Comments |
| Comment by Rodrigo P [ 2022 Mar 15 ] |
|
I see this same behavior on Juniper SRX and J series. Zabbix 5.2.6. I was not able to determine the cause yet. What I can say is that it doesn't happen with others tools that collect the same data from these routers. |
| Comment by Edgars Melveris [ 2022 Mar 16 ] |
|
Could you set up another item collecting the exact same OID, but without any preprocessing? Just raw values with no change per second. |
| Comment by Dimitri Bellini [ 2022 Mar 17 ] |
|
I would like add to this threads, we discover the same on problem of one of our customer... PS: I forgot to mention that we are using Zabbix 5.0.14 version Thanks so much |
| Comment by Mikko Tikkala [ 2022 Mar 17 ] |
|
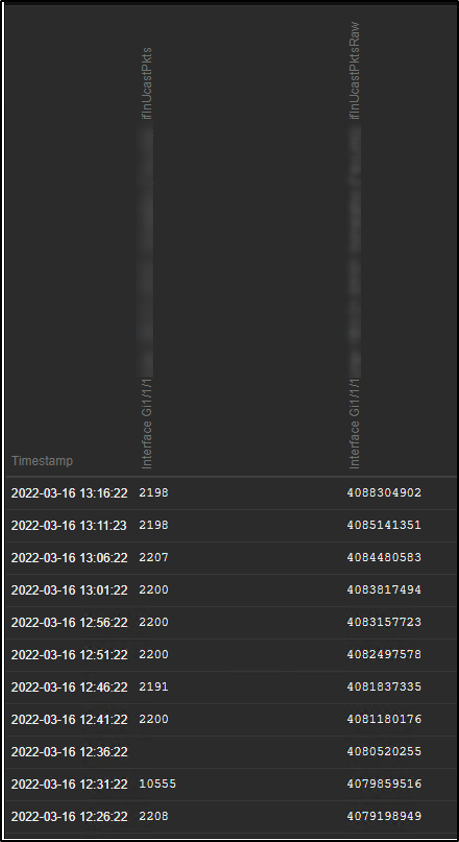
Here is data from change per second item and raw item. I wrote text below to forum thread yesterday (Zabbix 5.4.8 False High Bandwidth Monitoring - ZABBIX Forums): "Made really interesting observation today when looked pcap-data. In this case I have double items to read ifInUcastPkts OID. This set seems to be related to item with raw values. Counter values increases at constantly. "frame.time": "Mar 16, 2022 12:26:22.496782000 FLE Standard Time", "frame.time": "Mar 16, 2022 12:31:22.439778000 FLE Standard Time", "frame.time": "Mar 16, 2022 12:36:22.514265000 FLE Standard Time", "frame.time": "Mar 16, 2022 12:41:22.425662000 FLE Standard Time", This set seems to be related to pps item. "frame.time": "Mar 16, 2022 12:26:22.522068000 FLE Standard Time", "frame.time": "Mar 16, 2022 12:31:22.497455000 FLE Standard Time", "frame.time": "Mar 16, 2022 12:36:22.556665000 FLE Standard Time", "frame.time": "Mar 16, 2022 12:41:22.455305000 FLE Standard Time", Negative counter values?!?! |
| Comment by Edgars Melveris [ 2022 Mar 17 ] |
|
It's a well known fact that some devices behave "interestingly" if bulk requests are used. Just a wild guess is that it somehow mixes metrics from different indexes, then you really might see negative or huge spikes. |
| Comment by Mikko Tikkala [ 2022 Mar 17 ] |
|
At least Cisco IE-5000 seems to be ok when bulk requests are turned off. However other user said that disabling bulk requests didn't solve the problem completely. Packet capture is the final truth... So I encourage users to capture traffic and look how the switch is responding. |
| Comment by Rodrigo P [ 2022 Nov 05 ] |
|
Hi all. Has anyone made any progress on finding the root cause for this problem? Thanks. |
| Comment by Alex Le Heux [ 2023 Aug 04 ] |
|
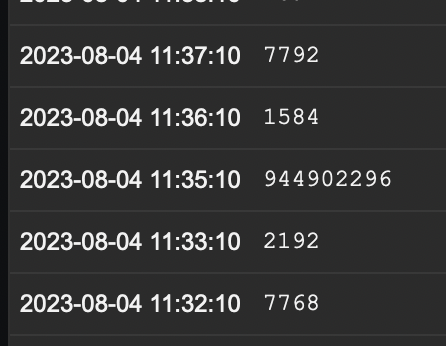
This comment is about an SNMP ifHCOutOctets item. We are experiencing the same issue and I think that in our case it's related to the fact that some devices don't always report the SNMP value when polled. These are all devices that have a tiny CPU. This results in missing values in the item's history. The next time the device is polled and the Change Per Second preprocessing is run, the following appears to happen: The Change Per Second preprocessor sees the previous missing value and takes it to be 0. The ifHCOutOctets from the device is of course the total number of bytes sent since boot and is a very large value, causing the result to be ludicrously large. Every single time this happens for us, the item's history has a missing entry, like this:
|
| Comment by Vladislavs Sokurenko [ 2023 Sep 29 ] |
|
It looks like values that are less than previous come |
| Comment by Alex Le Heux [ 2023 Sep 29 ] |
|
All the "normal" values are deltas, so relative to the previous value. |
| Comment by Vladislavs Sokurenko [ 2023 Sep 29 ] |
|
Is it possible that 0 was received ? |
| Comment by Alex Le Heux [ 2023 Sep 29 ] |
|
I checked with tcpdump, and this happens when there's no reply for some reason. But your suggestion looks very promising. I'm going to test that out right away! Thanks! |
| Comment by Vladislavs Sokurenko [ 2023 Sep 29 ] |
|
History is always updated to new value, but when newer value comes that is less than previous then result is of calculation is discarded (that's why there is missing value), however when new value arrives then it checks change with this previous value, if previously value is incorrect (for example 0) then calculation is incorrect. |
| Comment by Vladislavs Sokurenko [ 2023 Sep 29 ] |
|
Please also see |
| Comment by Alex Le Heux [ 2023 Sep 29 ] |
|
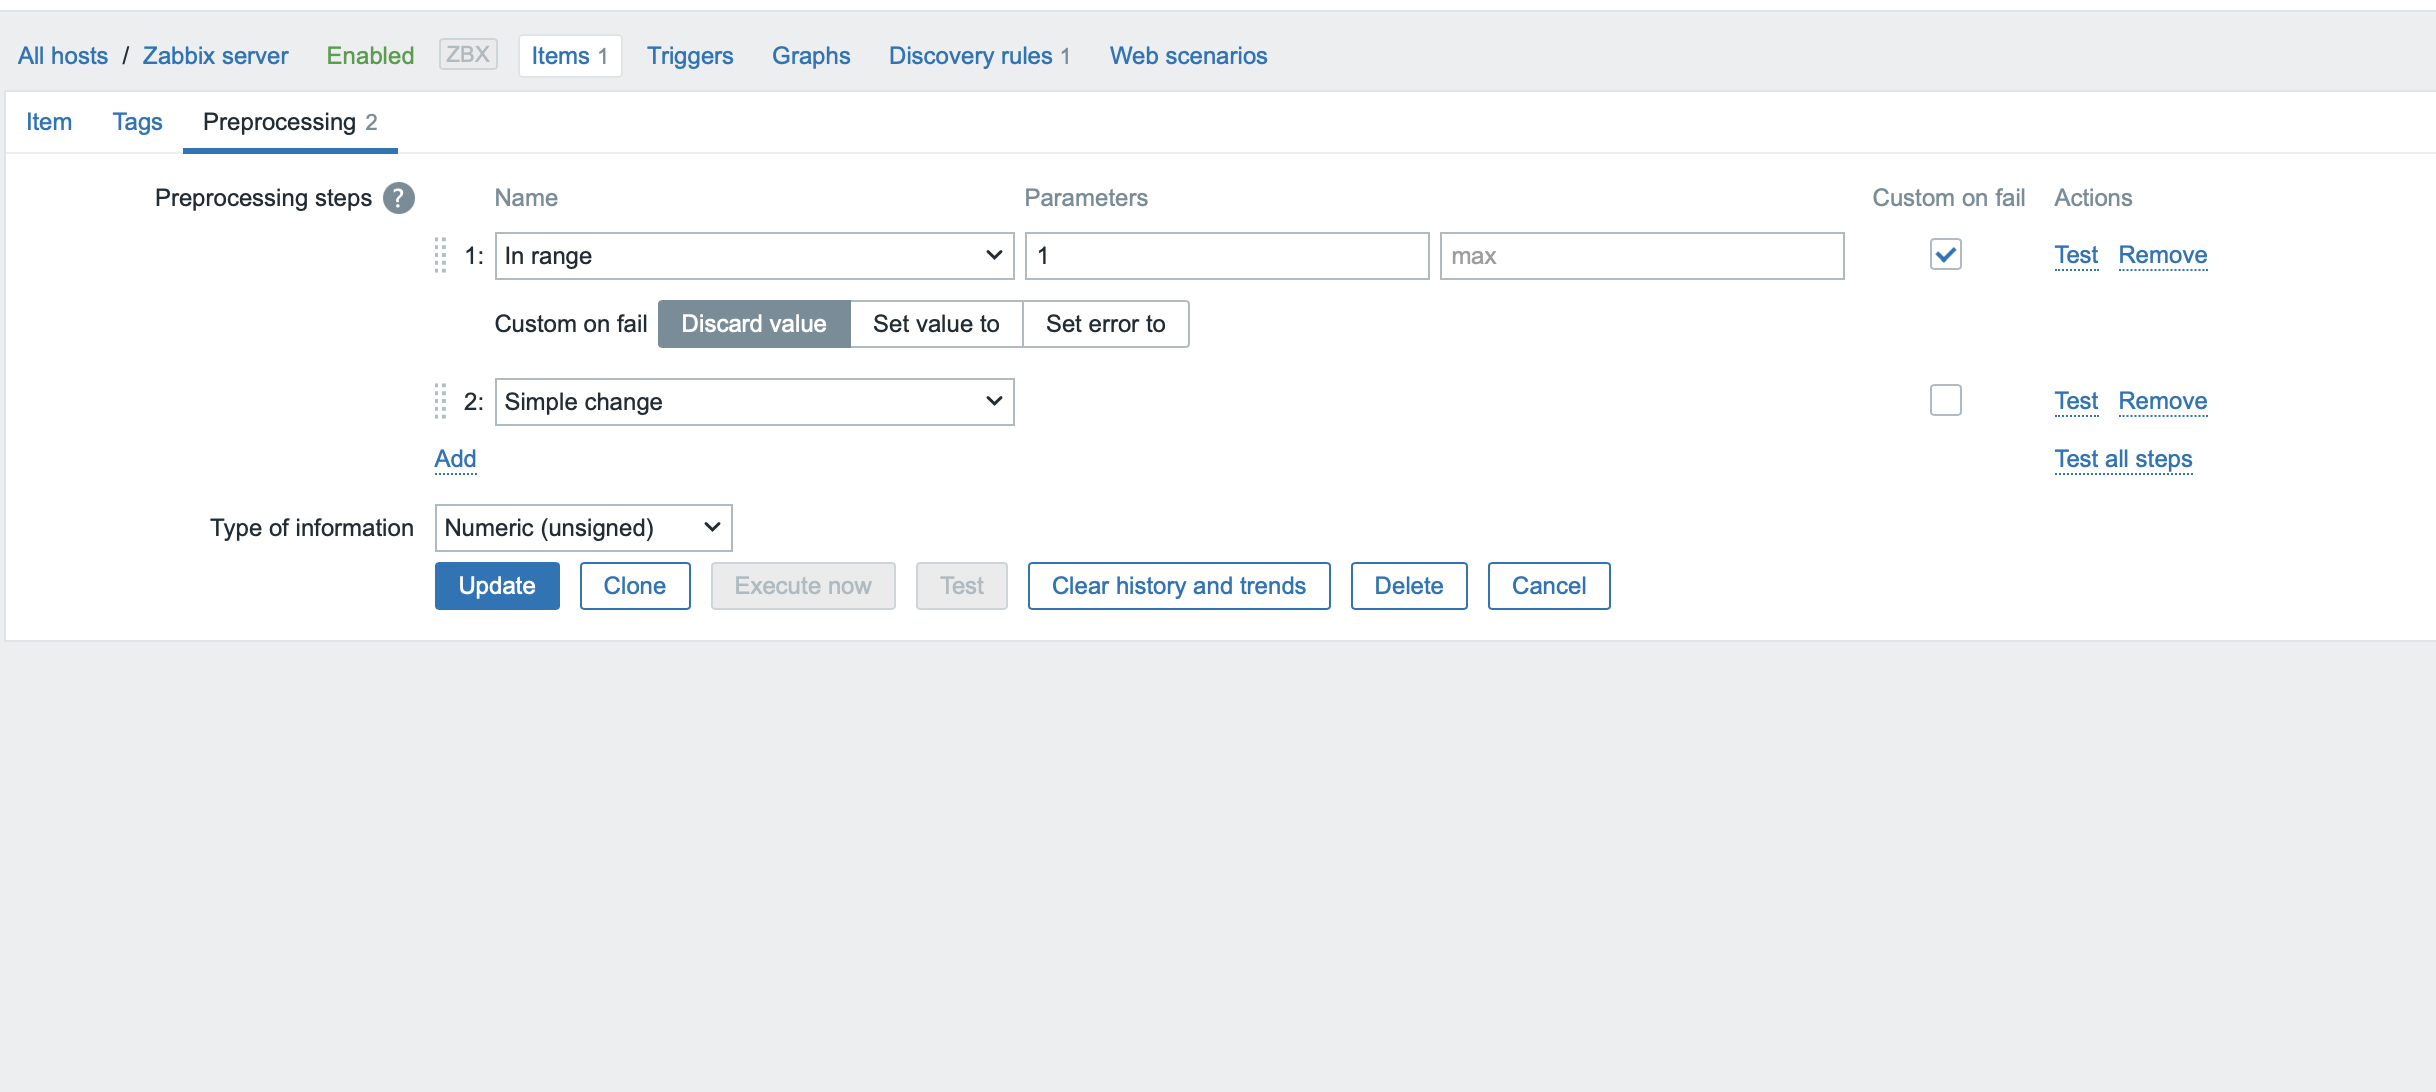
I've played around with the Custom-on-fail setting and that doesn't help. I'll try turning off bulk requests, but we have hundreds of devices, so I'm not sure what other issues that'll cause. I still think that the "change per second" function does the wrong thing by calculating the delta from 0 if there's one missing value though. That's the real issue. |
| Comment by Vladislavs Sokurenko [ 2023 Sep 29 ] |
|
If it's possible then I can provide a patch that will print this value, value is missing because some value was returned that is lower than previous, if it's frequently reproducible then you could also monitor without simple change and see please if some new values are less than previous but then suddenly too big. Lets see if disabling combined requests help, currently not 100% sure if issue is in Zabbix or simply received wrong data. |
| Comment by Alex Le Heux [ 2023 Sep 29 ] |
|
I've tcpdumped the traffic between the zabbix proxy and the device and in all cases that I checked the issue wasn't a wrong value, the issue was that no reply was sent for that OID. But I can easily add an item without simple change to monitor and double check. |
| Comment by Alex Le Heux [ 2023 Sep 29 ] |
|
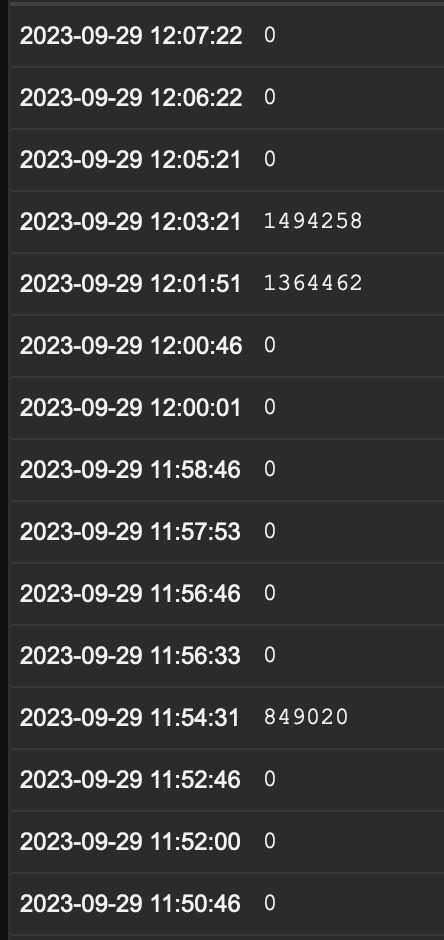
OID monitored every 60 seconds, bulk requests enabled. The OID with Change Per Second:
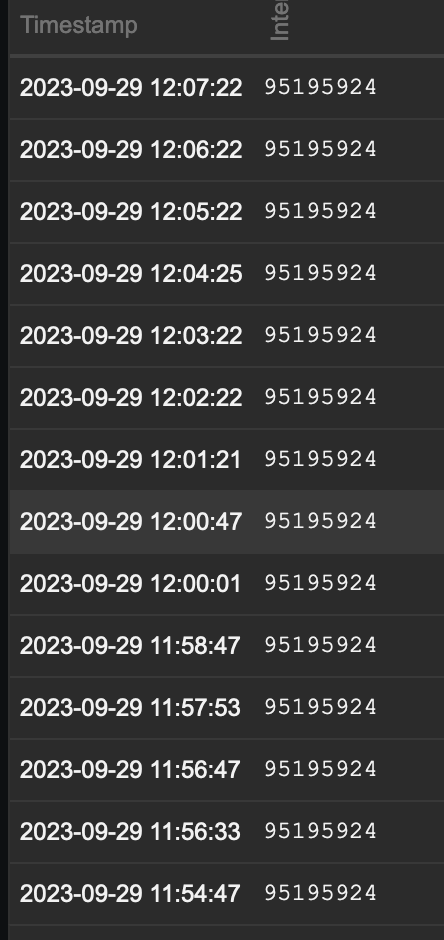
The same OID without change per second.
|
| Comment by Vladislavs Sokurenko [ 2023 Sep 29 ] |
|
What version of Zabbix server is it ? Maybe it is possible to increase log level for preprocessing worker and attach it ? That's quite unexpected that missing value affects delta calculation. Are raw results without any preprocessing ? zabbix_server -R log_level_increase="preprocessing worker" |
| Comment by Alex Le Heux [ 2023 Sep 29 ] |
|
We're on 6.0.19. The server monitors over a thousand devices via 16 proxies so I'll have to see what I can do with regards to logging |
| Comment by Alex Le Heux [ 2023 Sep 29 ] |
|
FYI: We'll run the server with extra logging on Monday. No production changes here on Friday afternoon. We like our weekends |
| Comment by Vladislavs Sokurenko [ 2023 Sep 29 ] |
|
Preprocessing and collection is done through proxy and if only one interface is affected then maybe it's possible to create another proxy with this interface and checks. Unfortunately we cannot reproduce it locally for further investigation it might be required to patch proxy with additional debug information. It could be easier to investigate the issue if it's isolated. |
| Comment by Alex Le Heux [ 2023 Sep 29 ] |
|
Ah, that's good to know. But this affects many devices, not just one, although it tends to be the devices with smaller CPUs. Either way, we'll gather the logs for you on Monday! |
| Comment by Vladislavs Sokurenko [ 2023 Sep 29 ] |
|
Thanks, if proxy is unpatched then it's better to increase log level for poller on proxy and then we can find time in log and compare it to log records for that time. |
| Comment by Alex Le Heux [ 2023 Oct 04 ] |
|
Hi,
|
| Comment by Vladislavs Sokurenko [ 2023 Oct 05 ] |
|
If you could please grep for the time where there where missing entries and perhaps messages containing "snmp_sess_synch_response" |
| Comment by Alex Le Heux [ 2023 Oct 09 ] |
|
zabbix:/home/zabbix$ grep snmp_sess_synch_response log/20231003-zabbix02-hsnc01_proxy_log-preprocessing-worker.log
Nothing. This is the log form the proxy. |
| Comment by Andrii Fediuk [ 2025 Oct 31 ] |
|
Updated documentation: |