[ZBX-20779] trigger: Zabbix agent is not available - permanent active Created: 2022 Mar 22 Updated: 2024 May 03 |
|
| Status: | Open |
| Project: | ZABBIX BUGS AND ISSUES |
| Component/s: | None |
| Affects Version/s: | 5.4.10, 6.0.2 |
| Fix Version/s: | None |
| Type: | Incident report | Priority: | Trivial |
| Reporter: | Tristis Oris | Assignee: | Victor Breda Credidio |
| Resolution: | Unresolved | Votes: | 0 |
| Labels: | agent, triggers | ||
| Remaining Estimate: | Not Specified | ||
| Time Spent: | Not Specified | ||
| Original Estimate: | Not Specified | ||
| Environment: |
ubuntu 20.04 |
||
| Attachments: |
|
| Description |
|
Steps to reproduce:
Result: at some hosts this trigger always active, already for a month+. agent restart, host reboot, etc didn't help.
Agent send all data to server as intended, even a ping status. So trigger have a info that host is up, but show it is down. at most other hosts it triggering very often for a short time. 2-5min, usually not more than trigger time (5min). With default 30min it active for 30min. I'm using only active checks.
It begins at 5.4 clean install. Same contunie at 6.0 clean install to. My older zabbix server 4.4-5.0 have no this issue. |
| Comments |
| Comment by Victor Breda Credidio [ 2022 Mar 29 ] |
|
Hello Tristis! This is really odd for sure. Best regards, |
| Comment by Tristis Oris [ 2022 Mar 29 ] |
|
no proxy, all VMs at same subnet. Default template config except some history value. |
| Comment by Victor Breda Credidio [ 2022 Mar 29 ] |
|
Thanks. Can you please check if the time of your Zabbix Server is the same for your hosts? Best regards, |
| Comment by Tristis Oris [ 2022 Mar 29 ] |
|
yes, time same. All hosts use the same local ntp server. this problem exist too with default value 30min. |
| Comment by Andrew Biba (Inactive) [ 2022 Mar 29 ] |
|
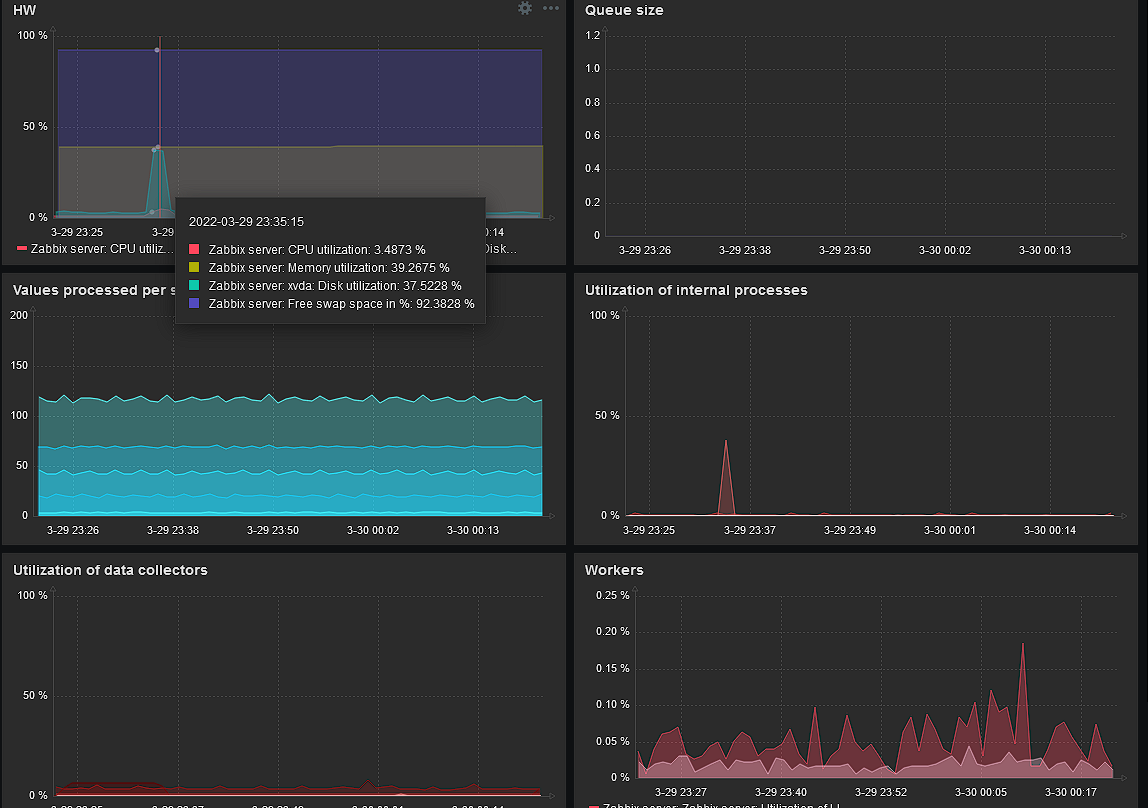
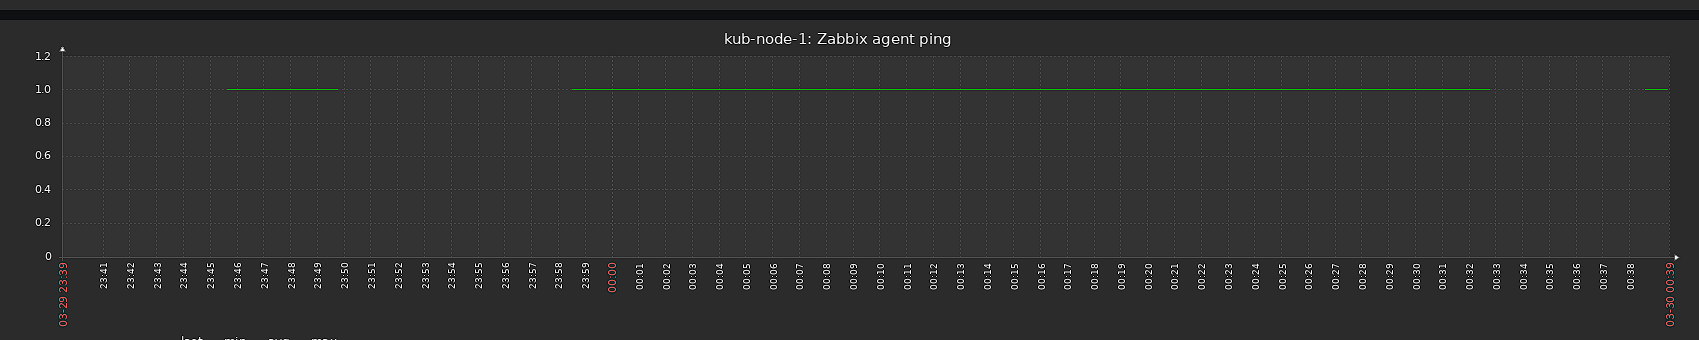
Tristis Oris this is definitely is a time issue. Can you see this data gap on graphic? that's mean all data that comes to server is in past. Means if agent sent data for example in 12:13, but server time now is 12:15, this data will be recorded as data with 12:13 timestamp and server think it was in past. So never "actual" data will be displayed. I would suggest check time of server with zabbix agent, with zabbix server and zabbix database. |
| Comment by Tristis Oris [ 2022 Mar 30 ] |
|
got another trigger active, checked time on both hosts - just ~30sec difference. with 5 or 30 min at trigger settings, 1-2 min should not be a problem. or not?
root@zabbix:~# timedatectl [root@kub-node-1 ~]# timedatectl
found one vm with wrong timezone. difference 6 hours and +2min. But it usualy fine, no triggers.
|
| Comment by Andrew Biba (Inactive) [ 2022 Mar 30 ] |
|
Tristis Oris Yeah, seems like its not an agent time issue. According to graphic gap is 7 minutes. I would suggest check zabbix databse. May be it is overloaded (not properly configured or server CPU fully utilized) and have long queue to write data. |
| Comment by Tristis Oris [ 2022 Mar 30 ] |
|
not a cpu load.
use the postgre database. i'm not sure, but probably something like this: postgres=# SELECT LOCALTIMESTAMP AT TIME ZONE 'localtime'; postgres=# SELECT NOW()::TIMESTAMP;
and to be sure SET TIMEZONE='Europe/Moscow';
time same as real local time. and correct tz at /etc/postgresql/14/main/postgresql.conf i think it should use server local time, due it no any additional ntp server settings. |
| Comment by Tristis Oris [ 2022 Mar 30 ] |
|
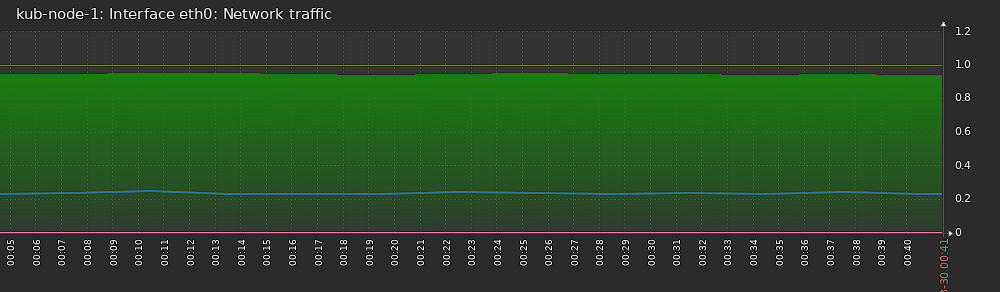
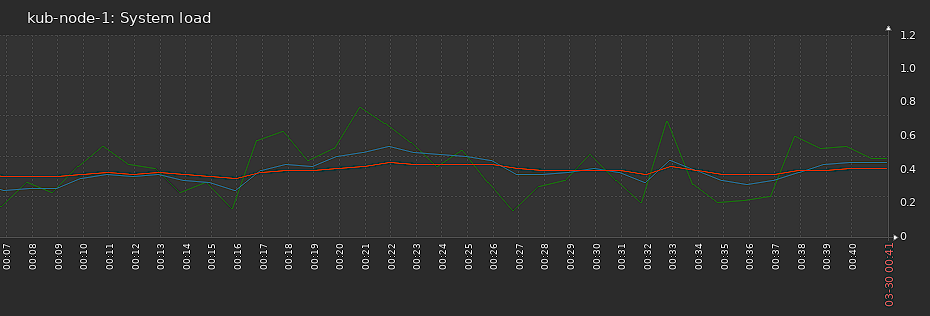
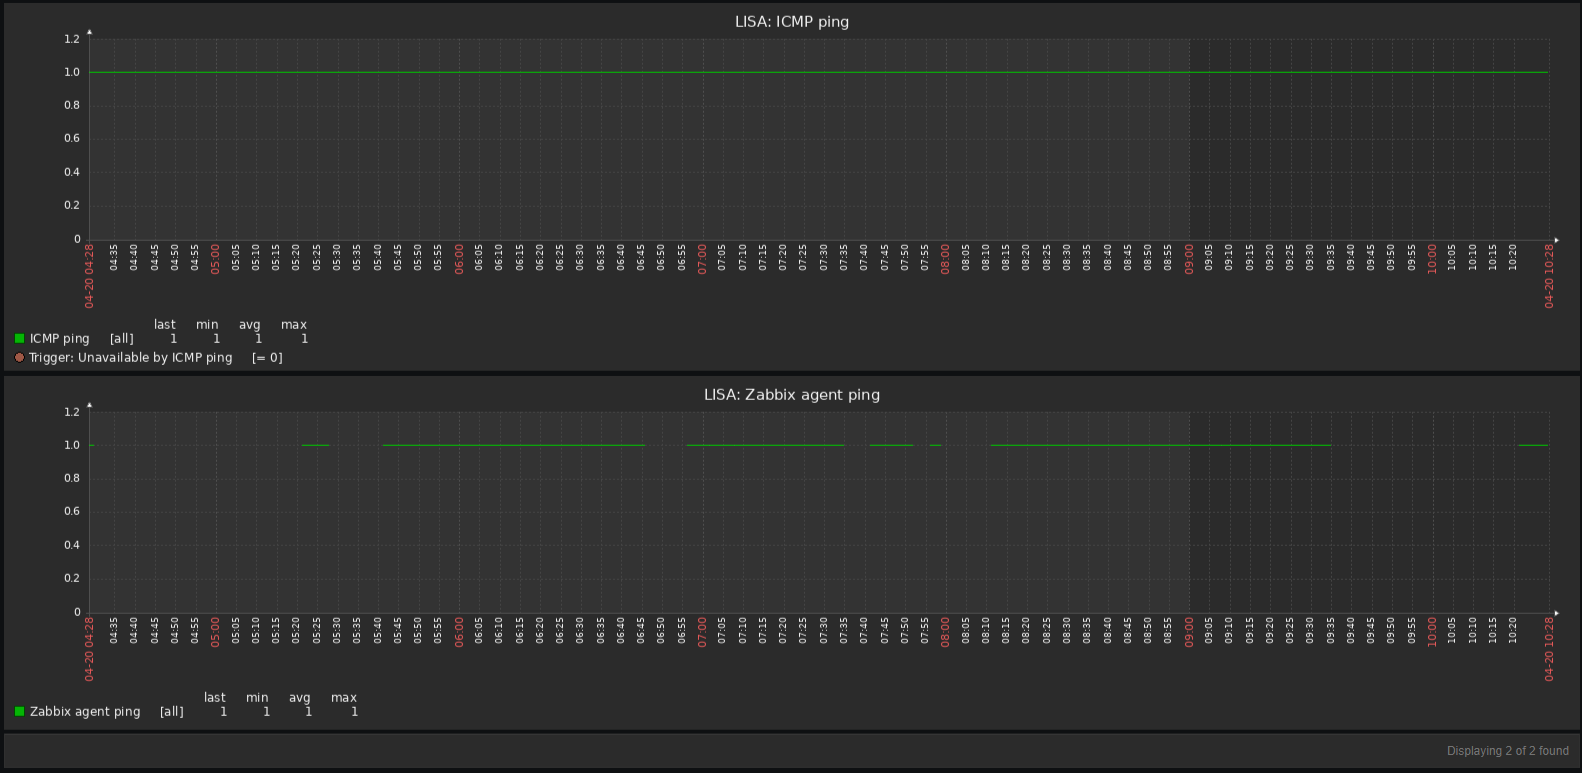
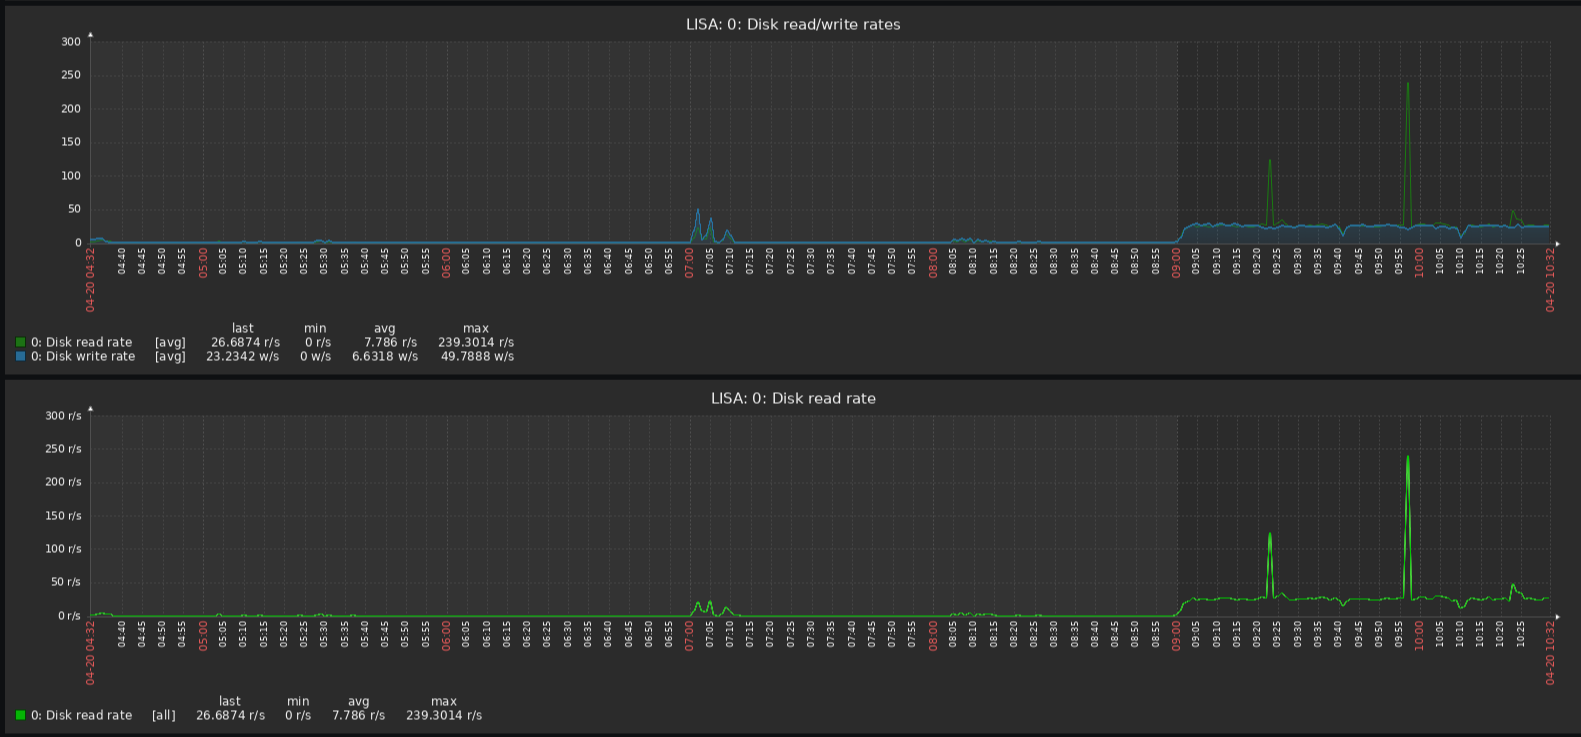
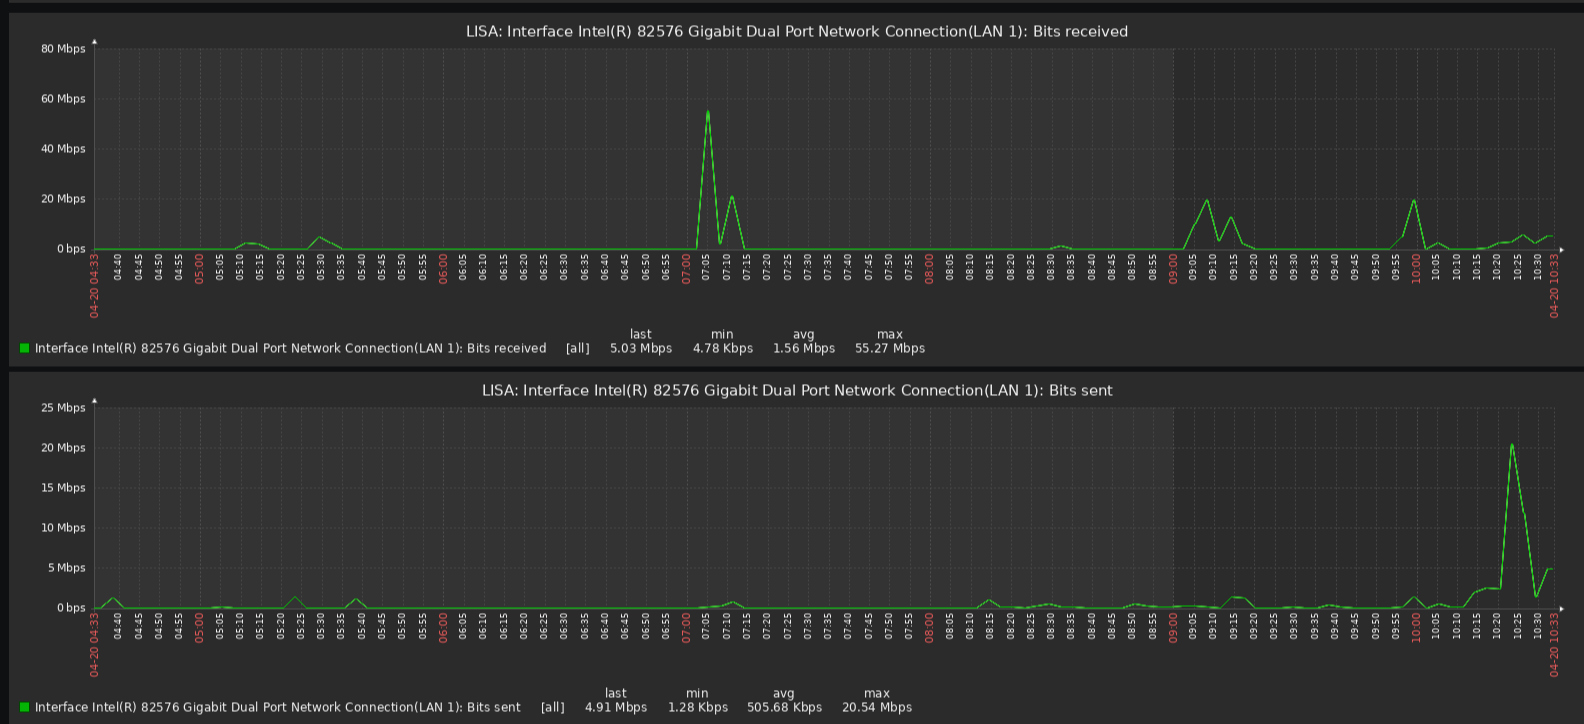
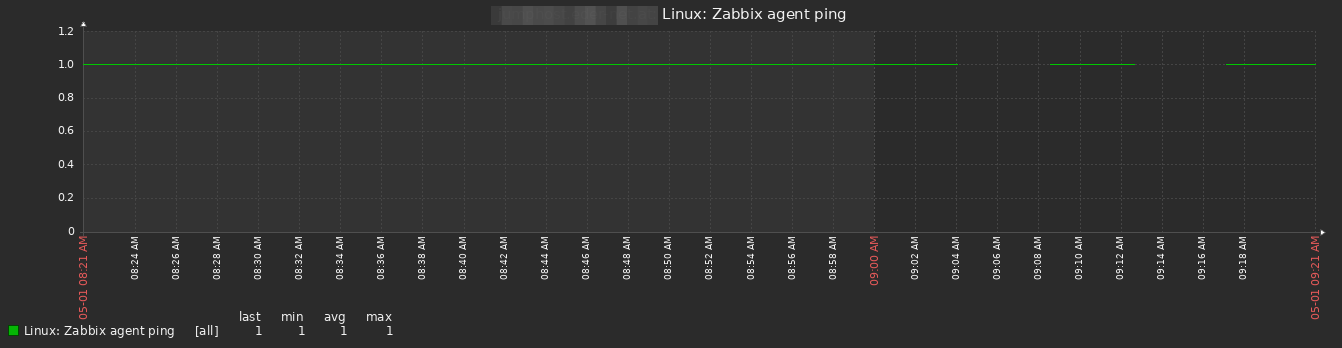
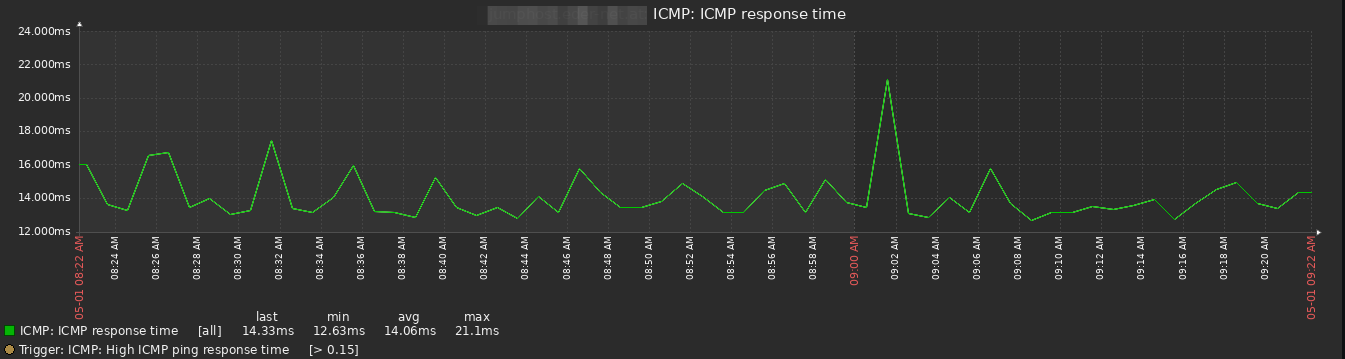
but on some hosts it show a ping loss.
but at same time any over metrics without interrution.
|
| Comment by Fernando Viñan-Cano [ 2023 Apr 20 ] |
|
Since upgrading from 6.2 to 6.4, currently on server/agents v6.4.1, running on a Raspberry Pi-4 using an SSD, I've been seeing the same thing for just one of my agents, in my case it's a Windows 2022 server. Zero issues on any other systems, Linux/Windows/OPNsense, and this server is not particularly busy - I've tried enabling debug logging on the agent but it doesn't show any problems yet I am receiving plenty of data while the agent is apparently not responding. Reinstallation of the agent and various reboots make no difference.
|
| Comment by Tristis Oris [ 2023 Apr 20 ] |
|
i evade this problem with new trigger, which appear a bit later after 6.0.
|
| Comment by Fernando Viñan-Cano [ 2023 May 31 ] |
|
@Tristis+Oris can you expand on what you mean After several agent and server updates I still have this problem, and it's still just this one server. |
| Comment by Stefan König [ 2024 May 01 ] |
|
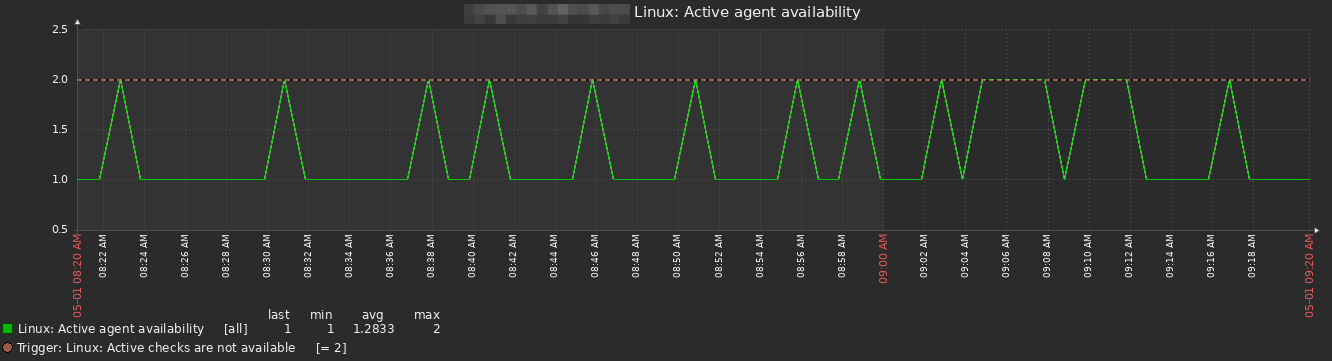
I have the same problem with one host but in 7.0beta3, which I am evaluating at the moment. All active checks are performing as expected, data is collected as it should be (e.g. ICMP ping, NIC bytes in/out, etc) without any gaps. However zabbix agent availablity shows unavailable on a regular basis and zabbix agent ping shows gaps. Time is not an issue as all servers are synched. Changing the heartbeat time in the agent config does not change the results here.... very strange!
edit:
edit 2: just after posting the edit above, the problem re-appeared. active agent availability raising to 2 again
edit 3: agent2 is working flawlessly for a day now. |