[ZBX-21129] "required performance" metric of Zabbix proxy is measuring wrong Created: 2022 May 29 Updated: 2022 May 30 Resolved: 2022 May 30 |
|
| Status: | Closed |
| Project: | ZABBIX BUGS AND ISSUES |
| Component/s: | None |
| Affects Version/s: | 6.0.3 |
| Fix Version/s: | None |
| Type: | Incident report | Priority: | Trivial |
| Reporter: | Mehmet Ali Buyukkarakas | Assignee: | Zabbix Support Team |
| Resolution: | Commercial support required | Votes: | 0 |
| Labels: | None | ||
| Remaining Estimate: | Not Specified | ||
| Time Spent: | Not Specified | ||
| Original Estimate: | Not Specified | ||
| Environment: |
oracle linux 8.5 zabbix server 6.3 |
||
| Attachments: |
|
| Description |
|
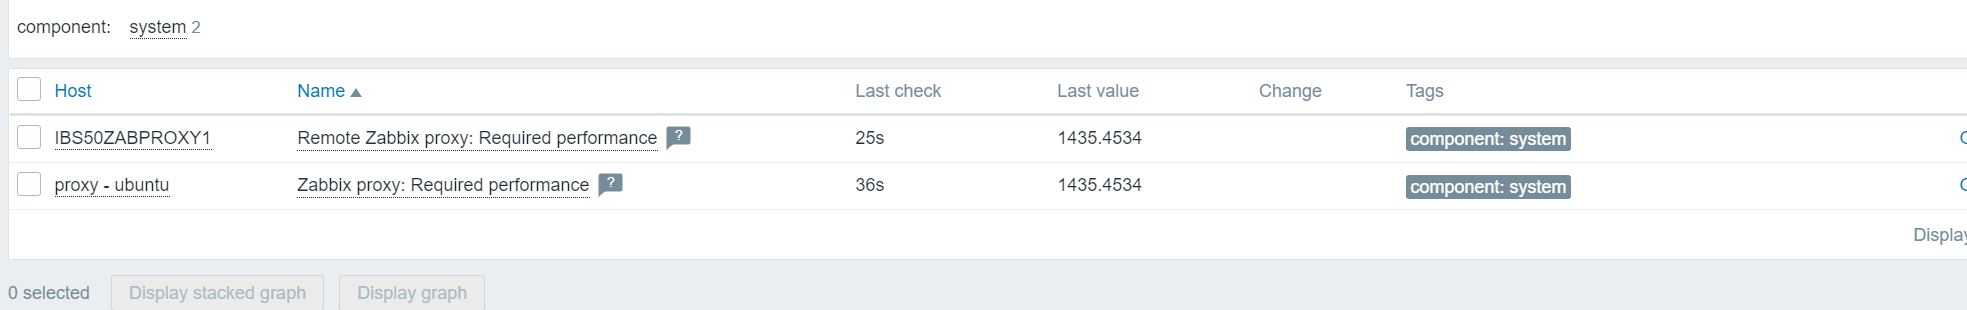
I have 2 different proxies (v6.0) and 'Im monitoring them all with template "zabbix proxy health. Both of them are showing the same value for metric "requiered performance" , which is not possible. Both of servers have different loads, different number of servers. This value (1435) is my zabbix server's total nvps value, not nvps of any proxy server. By the way, cheking the description of this metric tells me "Required performance of Zabbix proxy, in new values per second expected." I believe something is wrong here. Regards.
|
| Comments |
| Comment by Dmitrijs Lamberts [ 2022 May 30 ] |
|
Please be advised that this section of the tracker is for bug reports only. The case you have submitted can not be qualified as one, so please reach out to [email protected] for commercial support (https://zabbix.com/support) or consultancy services. Alternatively, you can also use our IRC channel or community forum (https://www.zabbix.com/forum) for assistance. With that said, we are closing this ticket. Thank you for understanding. |