[ZBX-21156] 500 (Internal Server Error) appears filtering Graphs Created: 2022 Jun 02  Updated: 2022 Jun 21

Status: Reopened
Project: ZABBIX BUGS AND ISSUES
Component/s: Frontend (F)
Affects Version/s: 6.0.5, 6.0.6rc1, 6.2.0rc1
Fix Version/s: None

Type: Problem report Priority: Trivial
Reporter: Sergejs Maklakovs Assignee: Zabbix Development Team
Resolution: Unresolved Votes: 0
Labels: console, error, graph, graphs
Remaining Estimate: Not Specified
Time Spent: Not Specified
Original Estimate: Not Specified

Attachments: PNG File Selection_999(1658).png    

 Description   

Steps to reproduce:
1) Navigate to monitoring->Hosts->Graphs. (Host - Zabbix server)
2) Reset the filter  **  
3) In the filters Hosts field add - Zabbix server (or any other Host that has graphs).
4) Apply filter
5) Press F12 and check console.

Result:
Console error - 500 (Internal Server Error).

Expected:
No console error.


 Comments   
Comment by Vladimir Stepanov (Inactive) [ 2022 Jun 03 ]

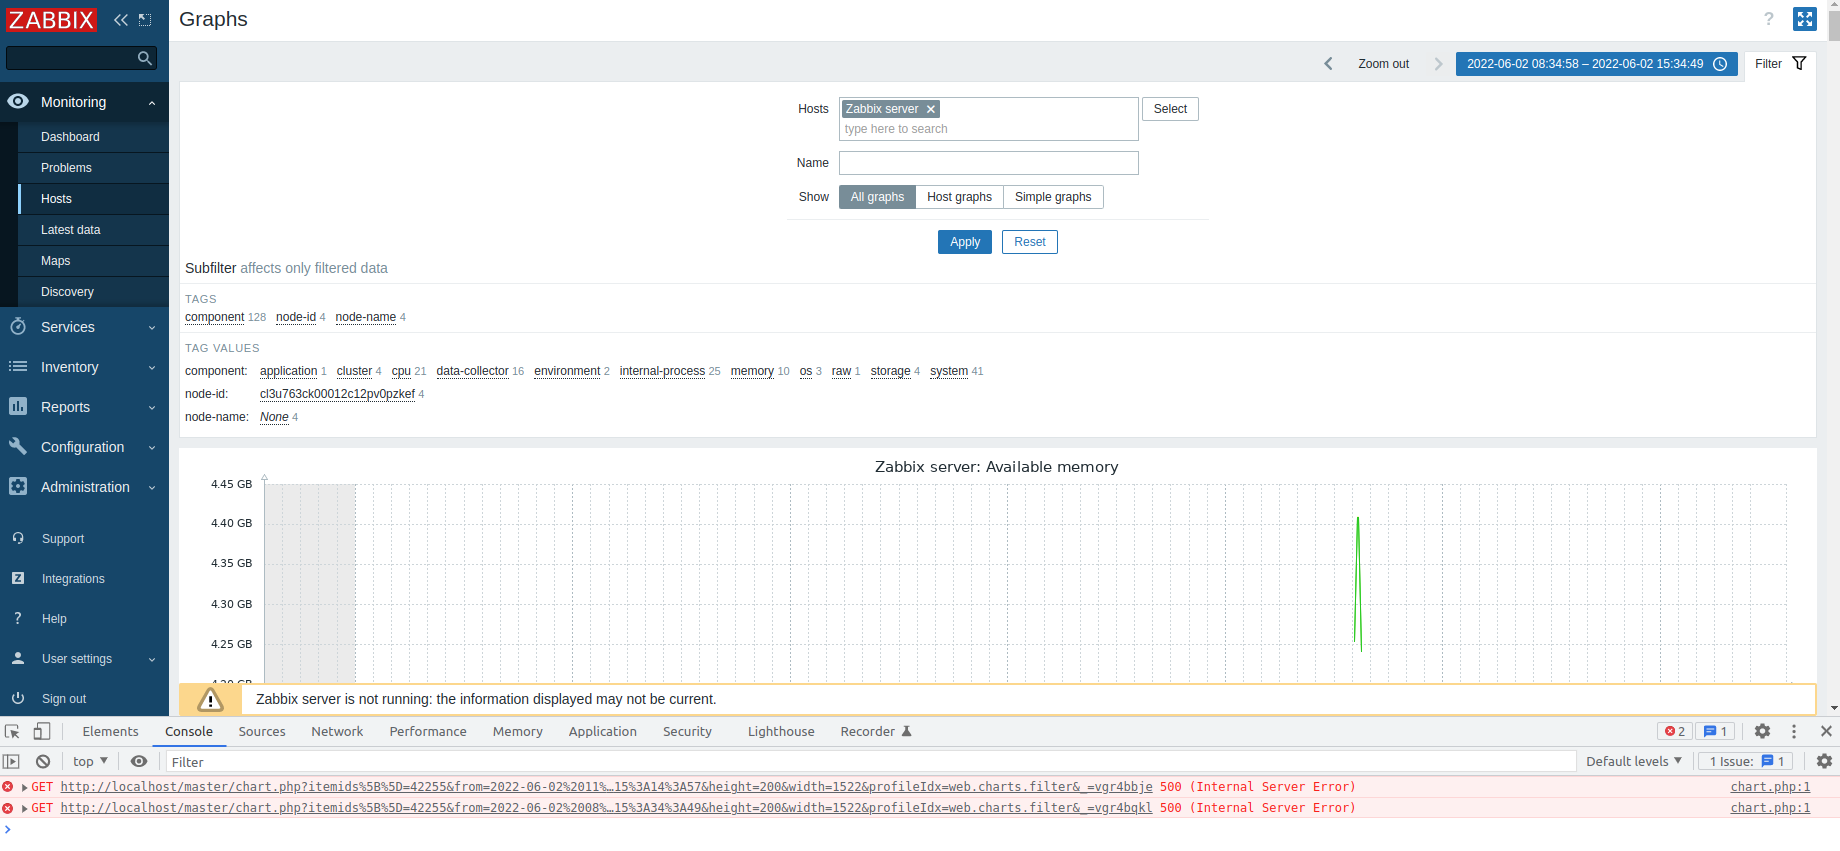
Please pay attention that you have message Zabbix server is not running. Check your System information to fix the error:
Reports -> System information.
Please be advised that this section of the tracker is for bug reports only. The case you have submitted can not be qualified as one, so please reach out to [email protected] for commercial support (https://zabbix.com/support) or consultancy services. Alternatively, you can also use our IRC channel or community forum (https://www.zabbix.com/forum) for assistance. With that said, we are closing this ticket. Thank you for understanding.

Generated at Fri Apr 11 23:19:23 EEST 2025 using Jira 9.12.4#9120004-sha1:625303b708afdb767e17cb2838290c41888e9ff0.