[ZBX-21705] History write cache leak Created: 2022 Sep 28 Updated: 2022 Oct 14 |
|
| Status: | Confirmed |
| Project: | ZABBIX BUGS AND ISSUES |
| Component/s: | Server (S) |
| Affects Version/s: | 6.2.3 |
| Fix Version/s: | None |
| Type: | Problem report | Priority: | Trivial |
| Reporter: | Evgeny Molchanov | Assignee: | Zabbix Development Team |
| Resolution: | Unresolved | Votes: | 0 |
| Labels: | None | ||
| Remaining Estimate: | Not Specified | ||
| Time Spent: | Not Specified | ||
| Original Estimate: | Not Specified | ||
| Environment: |
Ubuntu 20.04 |
||
| Attachments: |
|
| Description |
|
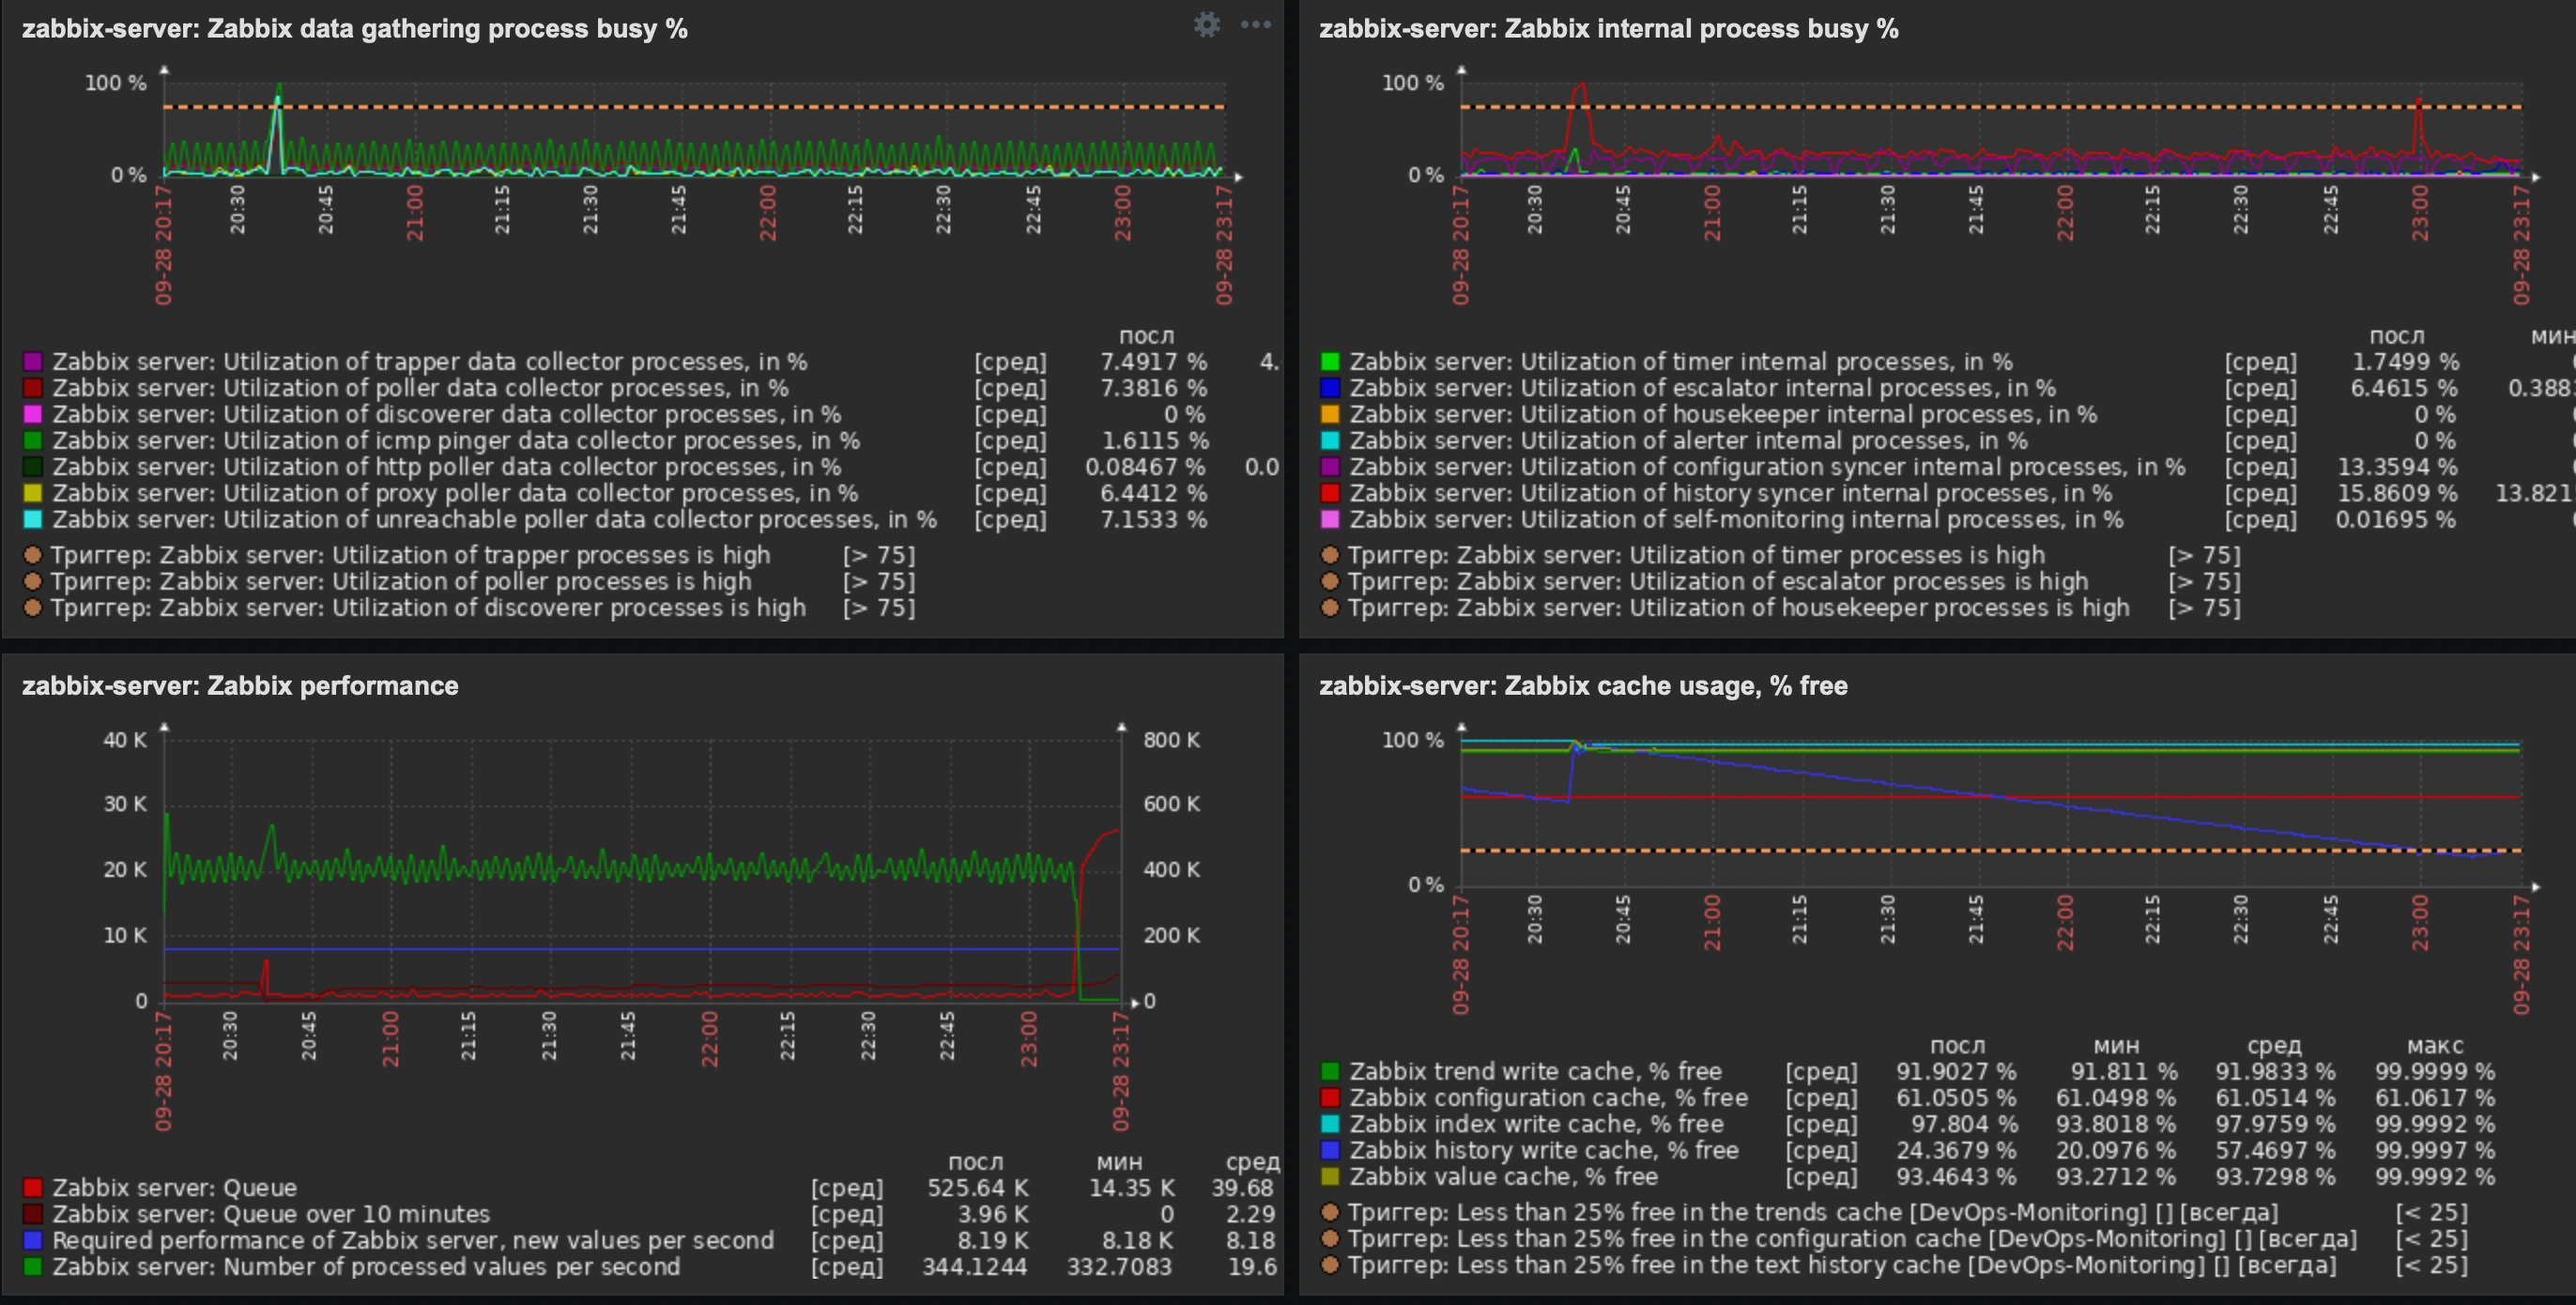
Steps to reproduce: Upgrade from 5.0.27 to 6.2.3 Result: Leak history write cache
zabbix_server -R diaginfo=historycache Expected: No leak history write cache |
| Comments |
| Comment by Evgeny Molchanov [ 2022 Sep 29 ] |
|
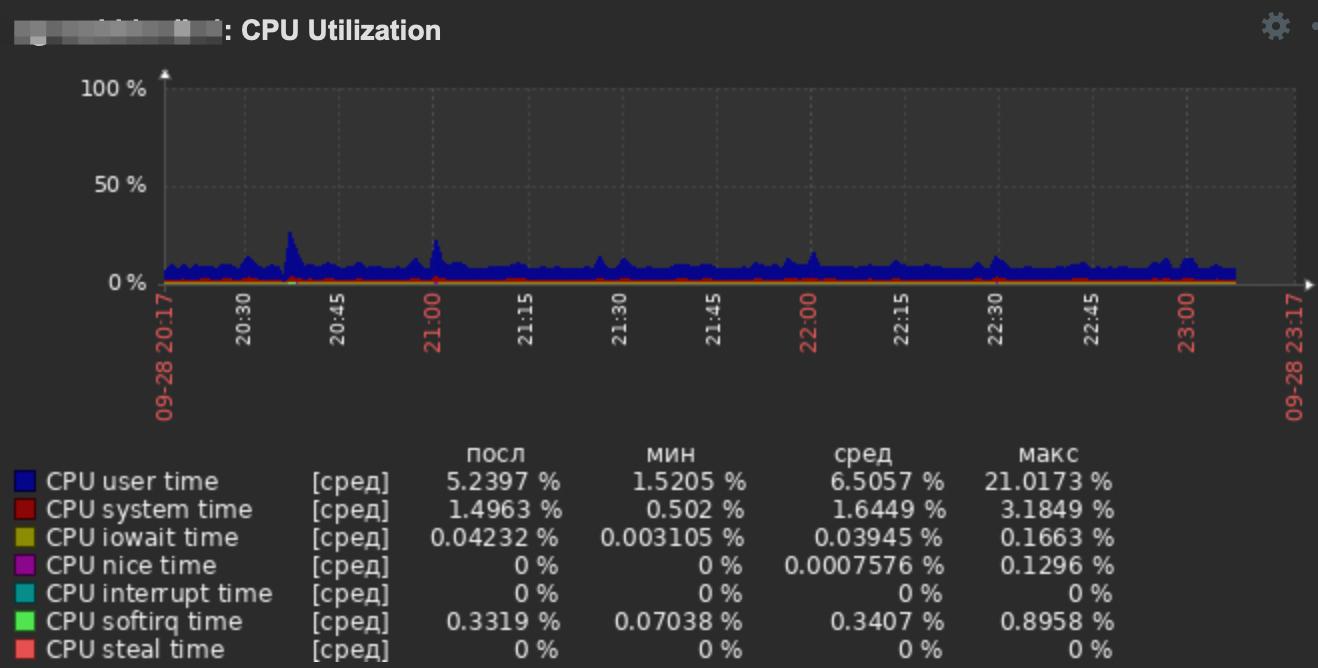
I tried to update to 6.0.6, 6.0.7, 6.0.8, 6.0.9, version and I also see the same problem. Used as a database PostgreSQL 14.5-1 + TimescaleDB 2.7.2 Server and database performance metrics show no problem (10-15% load) as of version 5.0.27. The data in the interface does not lag behind, there are also no queues. The server does not process any data itself - it receives all data from about 10 proxies. Server config: ListenPort=10051 LogFile=/var/log/zabbix/zabbix_server.log LogFileSize=0 PidFile=/var/run/zabbix/zabbix_server.pid SocketDir=/var/run/zabbix DBHost=127.0.0.1 DBName=zabbix_server DBUser=zabbix DBPassword=secret DBPort=5432 StartPollers=30 StartPollersUnreachable=10 StartPreprocessors=5 StartHistoryPollers=30 StartTrappers=30 StartDiscoverers=8 StartTimers=4 CacheSize=8G StartDBSyncers=10 StartLLDProcessors=8 HistoryCacheSize=2G HistoryIndexCacheSize=2G TrendCacheSize=2G ValueCacheSize=2G Timeout=20 AlertScriptsPath=/opt/zabbix/alertscripts ExternalScripts=/opt/zabbix/externalscripts FpingLocation=/usr/bin/fping Fping6Location=/usr/bin/fping6 LogSlowQueries=3000 StatsAllowedIP=127.0.0.1 |
| Comment by Evgeny Molchanov [ 2022 Sep 29 ] |
|
the only slow query longer than 3 seconds in the database: 2022-09-29 22:59:22.590 MSK [14018] zabbix@zabbix_server LOG: duration: 12997.090 ms statement: select i.itemid,i.hostid,i.status,i.type,i.value_type,i.key_,i.snmp_oid,i.ipmi_sensor,i.delay,i.trapper_hosts,i.logtimefmt,i.params,ir.state,i.authtype,i.username,i.password,i.publickey,i.privatekey,i.flags,i.interfaceid,ir.lastlogsize,ir.mtime,i.history,i.trends,i.inventory_link,i.valuemapid,i.units,ir.error,i.jmx_endpoint,i.master_itemid,i.timeout,i.url,i.query_fields,i.posts,i.status_codes,i.follow_redirects,i.post_type,i.http_proxy,i.headers,i.retrieve_mode,i.request_method,i.output_format,i.ssl_cert_file,i.ssl_key_file,i.ssl_key_password,i.verify_peer,i.verify_host,i.allow_traps,i.templateid,null from items i inner join hosts h on i.hostid=h.hostid join item_rtdata ir on i.itemid=ir.itemid where h.status in (0,1) and i.flags<>2 |
| Comment by Vladislavs Sokurenko [ 2022 Sep 30 ] |
|
Please provide more information about items that accumulate, what kind of values do they have ? |
| Comment by Evgeny Molchanov [ 2022 Sep 30 ] |
|
Items found in cache: Top.values: itemid:9858563 values:298566 itemid:10690270 values:242934 itemid:9829034 values:239930 itemid:9829055 values:236880 itemid:9829051 values:235248 They have an update interval 0 second and period 1-5,00:00-24:00 in db:
 -[ RECORD 1 ]----+---------------------------------
itemid           | 9858563
type             | 7
snmp_oid         |
hostid           | 15873
name             | Validation Status
key_             | oracle[val_status,{$ORACLE_SID}]
delay            | 3m;0/1-5,00:00-24:00
history          | 30d
trends           | 365d
status           | 1
value_type       | 3
After disabling these elements, the growth of the cache stopped, after turning it back on, the growth of cache usage resumed, and the problem was localized. After removing the update period - the problem also no longer reproduces.
1109639:20220929:192028.228 item "my-server-1:oracle[val_status,{$ORACLE_SID}]" became not supported: Incorrect update interval.
Items have an unsupported status: "Value of type "string" is not suitable for value type "Numeric (unsigned)" |
| Comment by Vladislavs Sokurenko [ 2022 Sep 30 ] |
|
Sounds similar to |
| Comment by Evgeny Molchanov [ 2022 Sep 30 ] |
|
The agent logs are clean, no errors. In the web interface, I see the value (string) that comes when the script is executed. |
| Comment by Vladislavs Sokurenko [ 2022 Sep 30 ] |
|
If you could please provide Zabbix server, Zabbix proxy and Zabbix agent version then we could try reproducing the issue if it still persists with latest versions |
| Comment by Evgeny Molchanov [ 2022 Sep 30 ] |
|
Zabbix-server: 6.0.9 Zabbix-proxy: 6.0.9 Zabbix-agent: 2.4.5 |
| Comment by Vladislavs Sokurenko [ 2022 Sep 30 ] |
|
Reproduced. Steps:
'{"request":"agent data","data":[{"host":"Zabbix server","key":"agent.ping","value":"1","clock":1664545981,"ns":664106223},{"host":"Zabbix server","key":"agent.ping","value":"1","clock":1664545981,"ns":664107848},{"host":"Zabbix server","key":"agent.ping","value":"1","clock":1664545981,"ns":664108557},{"host":"Zabbix server","key":"agent.ping","value":"1","clock":1664545981,"ns":664109098},{"host":"Zabbix server","key":"agent.ping","value":"1","clock":1664545981,"ns":664109682},{"host":"Zabbix server","key":"agent.ping","value":"1","clock":1664545981,"ns":664110265},{"host":"Zabbix server","key":"agent.ping","value":"1","clock":1664545981,"ns":664110848},{"host":"Zabbix server","key":"agent.ping","value":"1","clock":1664545981,"ns":664111390},{"host":"Zabbix server","key":"agent.ping","value":"1","clo
It is doing so because it treats 0 update interval as no interval
79589:20220930:165804.632 send_list_of_active_checks_json() sending [{"response":"success","data":[{"key":"agent.ping","delay":0,"lastlogsize":0,"mtime":0}]}]
Workaround is not to use flexible update interval as it is not supported by older agent anyway.
|