[ZBX-21716] Agent 2 throws ‘first network error’ on a regular basis Created: 2022 Sep 30  Updated: 2022 Nov 08

Status: Reopened
Project: ZABBIX BUGS AND ISSUES
Component/s: Agent (G)
Affects Version/s: 6.0.9, 6.2.2, 6.2.3
Fix Version/s: None

Type: Problem report Priority: Trivial
Reporter: Jeffrey Descan Assignee: Victor Breda Credidio
Resolution: Unresolved Votes: 3
Labels: None
Remaining Estimate: Not Specified
Time Spent: Not Specified
Original Estimate: Not Specified
Environment:

Zabbix Agent2 (v6.0.x, v6.2.x) on Linux (Debian) and Windows
Zabbix Server: 6.2.3
Zabbix Proxy: 6.2.3


Attachments: PNG File Screenshot 2022-10-04 at 09.28.34.png     File Zabbix Network Error - web012.ctr.csv     PNG File image-2022-10-04-09-39-05-943.png     Text File web012-ctr.zabbix_agent2.log     Text File windows-zabbix_agent2.log     File zabbix-agent2_6.2.4-0.ZBX21716+debian11_amd64.deb     File zabbix-agent2_6.2.4-0.ZBX21716F+debian11_amd64.deb     File zabbix-proxy-mysql_6.2.4-0.ZBX21716+debian11_amd64.deb    

 Description   

Description


In our queues we’ve noticed regular Zabbix Agent 2 being ‘stuck’ or taking too much time for basic items. Through our centralized logging we’ve found out that on all our 20 proxies that they are all behaving in the same exact way.


Our proxy logs are containing the following errors:


Zabbix agent item "perf_counter_en["\Memory\Cache Bytes"]" on host "A" failed: first network error, wait for 45 seconds
Zabbix agent item "system.cpu.util[,user]" on host "B" failed: first network error, wait for 45 seconds
Zabbix agent item "system.uptime" on host "C" failed: first network error, wait for 45 seconds
Zabbix agent item "perf_counter_en["\PhysicalDisk(2 E:)\% Disk Time",60]" on host "D" failed: first network error, wait for 45 seconds


In our complete infrastructure we’re seeing this kind of log line 150 000 times over a period of 48 hours. It looks quite severe that agents are being marked as unreachable for a period of time, resulting in data being pushed too late and/or data points are not collected as we’re expecting.

containing the exact same error. For this case we’ll be focusing on a host we refer to as ‘web012.ctr’.

Let’s focus on where we’ve spotted the issue, the Zabbix Proxy logs, we’re seeing:

Sep-30     2022 @ 13:23:53.159  | proxy001 | Zabbix agent item "agent.ping" on host "web012.ctr" failed: first network error, wait for 45 seconds
Sep-30     2022 @ 13:24:38.030  | proxy001 | resuming Zabbix agent checks on host "web012.ctr": connection restored


At the same time in the Zabbix Agent 2 logs we’re noticing this kind of behavior:

2022/09/30 13:23:53.133253 sending passive check response: '1.103264' to '172.29.63.48'
2022/09/30 13:23:54.001301 plugin VFSDev: executing collector task
2022/09/30 13:23:54.001361 plugin Cpu: executing collector task
2022/09/30 13:23:55.000957 plugin Cpu: executing collector task
2022/09/30 13:23:55.001051 plugin VFSDev: executing collector task
2022/09/30 13:23:56.000710 plugin Cpu: executing collector task
2022/09/30 13:23:56.000751 plugin VFSDev: executing collector task
2022/09/30 13:23:57.001005 plugin Cpu: executing collector task
2022/09/30 13:23:57.001178 plugin VFSDev: executing collector task
2022/09/30 13:23:58.000827 plugin Cpu: executing collector task
2022/09/30 13:23:58.000870 plugin VFSDev: executing collector task
2022/09/30 13:23:59.000445 plugin Cpu: executing collector task
2022/09/30 13:23:59.000499 plugin VFSDev: executing collector task
2022/09/30 13:24:00.000967 plugin Cpu: executing collector task
2022/09/30 13:24:00.001038 plugin VFSDev: executing collector task
2022/09/30 13:24:01.001068 plugin Cpu: executing collector task
2022/09/30 13:24:01.001106 plugin VFSDev: executing collector task
2022/09/30 13:24:02.000587 plugin Cpu: executing collector task
2022/09/30 13:24:02.000623 plugin VFSDev: executing collector task
2022/09/30 13:24:03.000666 plugin VFSDev: executing collector task
2022/09/30 13:24:03.000716 plugin Cpu: executing collector task
2022/09/30 13:24:04.000261 plugin Cpu: executing collector task
2022/09/30 13:24:04.000303 plugin VFSDev: executing collector task
2022/09/30 13:24:05.000771 plugin Cpu: executing collector task
2022/09/30 13:24:05.000812 plugin VFSDev: executing collector task
2022/09/30 13:24:06.000598 plugin Cpu: executing collector task
2022/09/30 13:24:06.000685 plugin VFSDev: executing collector task
2022/09/30 13:24:07.001228 plugin Cpu: executing collector task
2022/09/30 13:24:07.001270 plugin VFSDev: executing collector task
2022/09/30 13:24:08.001232 plugin VFSDev: executing collector task
2022/09/30 13:24:08.001297 plugin Cpu: executing collector task
2022/09/30 13:24:09.000968 plugin Cpu: executing collector task
2022/09/30 13:24:09.001038 plugin VFSDev: executing collector task
2022/09/30 13:24:10.000774 plugin Cpu: executing collector task
2022/09/30 13:24:10.000812 plugin VFSDev: executing collector task
2022/09/30 13:24:11.000514 plugin Cpu: executing collector task
2022/09/30 13:24:11.000574 plugin VFSDev: executing collector task
2022/09/30 13:24:12.001208 plugin Cpu: executing collector task
2022/09/30 13:24:12.001316 plugin VFSDev: executing collector task
2022/09/30 13:24:13.000881 plugin Cpu: executing collector task
2022/09/30 13:24:13.000927 plugin VFSDev: executing collector task
2022/09/30 13:24:14.000942 plugin VFSDev: executing collector task
2022/09/30 13:24:14.000985 plugin Cpu: executing collector task
2022/09/30 13:24:15.000575 plugin Cpu: executing collector task
2022/09/30 13:24:15.000625 plugin VFSDev: executing collector task
2022/09/30 13:24:16.001249 plugin Cpu: executing collector task
2022/09/30 13:24:16.001300 plugin VFSDev: executing collector task
2022/09/30 13:24:17.001183 plugin Cpu: executing collector task
2022/09/30 13:24:17.001218 plugin VFSDev: executing collector task
2022/09/30 13:24:18.000855 plugin Cpu: executing collector task
2022/09/30 13:24:18.000947 plugin VFSDev: executing collector task
2022/09/30 13:24:19.001913 plugin VFSDev: executing collector task
2022/09/30 13:24:19.001984 plugin Cpu: executing collector task
2022/09/30 13:24:20.000563 plugin Cpu: executing collector task
2022/09/30 13:24:20.000609 plugin VFSDev: executing collector task
2022/09/30 13:24:21.000999 plugin Cpu: executing collector task
2022/09/30 13:24:21.001080 plugin VFSDev: executing collector task
2022/09/30 13:24:22.000667 plugin Cpu: executing collector task
2022/09/30 13:24:22.000705 plugin VFSDev: executing collector task
2022/09/30 13:24:23.001334 plugin Cpu: executing collector task
2022/09/30 13:24:23.001375 plugin VFSDev: executing collector task
2022/09/30 13:24:24.000793 plugin Cpu: executing collector task
2022/09/30 13:24:24.000843 plugin VFSDev: executing collector task
2022/09/30 13:24:25.000415 plugin Cpu: executing collector task
2022/09/30 13:24:25.000456 plugin VFSDev: executing collector task
2022/09/30 13:24:26.001071 plugin Cpu: executing collector task
2022/09/30 13:24:26.001136 plugin VFSDev: executing collector task
2022/09/30 13:24:27.000613 plugin Cpu: executing collector task
2022/09/30 13:24:27.000667 plugin VFSDev: executing collector task
2022/09/30 13:24:28.001065 plugin VFSDev: executing collector task
2022/09/30 13:24:28.001113 plugin Cpu: executing collector task
2022/09/30 13:24:29.000598 plugin Cpu: executing collector task
2022/09/30 13:24:29.000639 plugin VFSDev: executing collector task
2022/09/30 13:24:30.001597 plugin Cpu: executing collector task
2022/09/30 13:24:30.001637 plugin VFSDev: executing collector task
2022/09/30 13:24:31.001027 plugin Cpu: executing collector task
2022/09/30 13:24:31.001076 plugin VFSDev: executing collector task
2022/09/30 13:24:32.000936 plugin VFSDev: executing collector task
2022/09/30 13:24:32.000971 plugin Cpu: executing collector task
2022/09/30 13:24:32.983762 [101] In sendHeartbeatMsg() from [172.29.63.48:10051]
2022/09/30 13:24:32.983803 connecting to [172.29.63.48:10051] [timeout:30s, connection timeout:30s]
2022/09/30 13:24:32.986035 connection established using TLSv1.3 TLS_CHACHA20_POLY1305_SHA256
2022/09/30 13:24:32.986057 sending [{"request":"active check heartbeat","host":"web012.ctr","heartbeat_freq":60}] to [172.29.63.48:10051]
2022/09/30 13:24:32.987670 receiving data from [172.29.63.48:10051]
2022/09/30 13:24:32.989000 received [] from [172.29.63.48:10051]
2022/09/30 13:24:32.989240 [101] End of sendHeartBeatMsg() from [172.29.63.48:10051]
2022/09/30 13:24:33.000398 plugin Cpu: executing collector task
2022/09/30 13:24:33.000431 plugin VFSDev: executing collector task
2022/09/30 13:24:34.001057 plugin Cpu: executing collector task
2022/09/30 13:24:34.001117 plugin VFSDev: executing collector task
2022/09/30 13:24:35.000720 plugin Cpu: executing collector task
2022/09/30 13:24:35.000766 plugin VFSDev: executing collector task
2022/09/30 13:24:36.000281 plugin Cpu: executing collector task
2022/09/30 13:24:36.000321 plugin VFSDev: executing collector task
2022/09/30 13:24:37.000570 plugin Cpu: executing collector task
2022/09/30 13:24:37.000626 plugin VFSDev: executing collector task
2022/09/30 13:24:38.001350 plugin Cpu: executing collector task
2022/09/30 13:24:38.001382 plugin VFSDev: executing collector task
2022/09/30 13:24:38.003885 connection established using TLSv1.3 TLS_CHACHA20_POLY1305_SHA256
2022/09/30 13:24:38.004298 received passive check request: 'system.localtime' from '172.29.63.48'


I am seeing tons of collector tasks for Cpu and VFSDev being started at the same moment we’re actually seeing these ‘first network error, wait for 45 seconds’ errors on the proxy.

Normally they’re passing by 5 or 10 times max, without any issues. However when they’re passing by in these kind of numbers (see the snippet above) we're seeing the issue every time on the proxy.

On all timestamps attached in the CSV we’re seeing this kind of behavior, the agent reconnects again immediately after the last ‘executing collector task’.

All our hosts are using TLS PSK encryption out of the box. We’ve also disabled this and the issue is still occurring with unencrypted traffic.

No patterns in timestamps or Agent Items are being found at all, it seems all random and linked to the start and stop times of these bulk collector tasks (at this point). We’re seeing this on all our items linked on the host.

This is also seen on Windows hosts but with plugin Cpu & plugin WindowsPerfMon (instead of VFSDev). A log snippet of this issue is also attached.

Our infrastructure is fairly new:

  • 3000 hosts running Zabbix Agent2 (v6.0.x, v6.2.x) on Linux (Debian) and Windows, mainly consisting of Passive checks (only a very, very small number of active checks are used).
  • HA Zabbix Server 6.2.3 (Linux)
  • 20x Zabbix Proxy 6.2.3 (Linux, Debian 11) with MySQL backend


Expectations

No matter the amount of collections the Zabbix Agent2 is executing, it should never be marked ‘unreachable’ or have a ‘first network error, wait for 45 seconds’ on the collector tasks running.


The agent is still reachable & the host is still working (not in heavy CPU / memory load at all), and we’re expecting all the data flowing in nicely just as these collector tasks are not running at all.

Reproducing

  • Install Zabbix Agent 2 v6.0.x or v6.2.3 (tested)
  • Apply the Zabbix 6.2 templates on these host: Linux by Zabbix agent (Linux) or Windows by Zabbix Agent (Windows)
  • Assign a Zabbix Proxy 6.2.3 (running on Linux, Debian 11) to this host
  • Wait for errors on the proxy side

Attachments

  • CSV of the Zabbix Proxy logs focusing on host ‘web012.ctr’
  • Log file of Zabbix Host ‘web012.ctr’ with DebugLevel 5 enabled and LogFileSize=10.
  • Log file of a Windows Zabbix Host with DebugLevel 5.


 Comments   
Comment by Dmitrijs Lamberts [ 2022 Oct 03 ]

Please be advised that this section of the tracker is for bug reports only. The case you have submitted can not be qualified as one (more looks like a network issue), so please reach out to [email protected] for commercial support (https://zabbix.com/support) or consultancy services. Alternatively, you can also use our IRC channel or community forum (https://www.zabbix.com/forum) for assistance. With that said, we are closing this ticket. Thank you for understanding.

Comment by Jeffrey Descan [ 2022 Oct 03 ]

This is not an actual network error, we've verified all firewalls in between. They are not causing any network timeouts.

A high level network verification is done in multiple steps to prove this.


Passive connection from proxy to host

root@proxy001:~# telnet web012.ctr 20050
Trying x.x.x.43...
Connected to web012.ctr.
Escape character is '^]'.
^]q
telnet> q
Connection closed.


SSH + Active connection from host to proxy

root@proxy001:~# ssh x.x.x.43
Debian GNU/Linux comes with ABSOLUTELY NO WARRANTY, to the extent
permitted by applicable law.
Last login: Mon Oct  3 08:03:20 2022 from 172.29.63.48
[email protected]:~# telnet 172.29.63.48 10051
Trying 172.29.63.48...
Connected to 172.29.63.48.
Escape character is '^]'.
^]q
telnet> q
Connection closed. 


Zabbix Get executions:

root@proxy001:~# date && zabbix_get -s x.x.x.43 -p 20050 --tls-connect psk --tls-psk-identity <PSK> --tls-psk-file <PSK-FILE> -k 'agent.version';
Mon 03 Oct 2022 08:06:49 AM CEST
6.2.3root@proxy001:~# date && zabbix_get -s x.x.x.43 -p 20050 --tls-connect psk --tls-psk-identity <PSK> --tls-psk-file <PSK-FILE> -k 'agent.version';
Mon 03 Oct 2022 08:06:50 AM CEST
6.2.3
root@proxy001:~# date && zabbix_get -s x.x.x.43 -p 20050 --tls-connect psk --tls-psk-identity <PSK> --tls-psk-file <PSK-FILE> -k 'agent.version';
Mon 03 Oct 2022 08:06:51 AM CEST
6.2.3root@proxy001:~# date && zabbix_get -s x.x.x.43 -p 20050 --tls-connect psk --tls-psk-identity <PSK> --tls-psk-file <PSK-FILE> -k 'agent.version';
Mon 03 Oct 2022 08:06:52 AM CEST
6.2.3root@proxy001:~# date && zabbix_get -s x.x.x.43 -p 20050 --tls-connect psk --tls-psk-identity <PSK> --tls-psk-file <PSK-FILE> -k 'agent.version';
Mon 03 Oct 2022 08:06:57 AM CEST
6.2.3root@proxy001:~# date && zabbix_get -s x.x.x.43 -p 20050 --tls-connect psk --tls-psk-identity <PSK> --tls-psk-file <PSK-FILE> -k 'agent.version';
Mon 03 Oct 2022 08:09:10 AM CEST
6.2.3root@proxy001:~# date && zabbix_get -s x.x.x.43 -p 20050 --tls-connect psk --tls-psk-identity <PSK> --tls-psk-file <PSK-FILE> -k 'agent.version';
Mon 03 Oct 2022 08:10:46 AM CEST
6.2.3 


Intermittent zabbix_get (multiple times per second):

root@proxy001:~# while true; do date && zabbix_get -s x.x.x.43 -p 20050 --tls-connect psk --tls-psk-identity <PSK> --tls-psk-file <PSK-FILE> -k 'agent.version'; sleep 0.3; done
Mon 03 Oct 2022 08:11:13 AM CEST
6.2.3
Mon 03 Oct 2022 08:11:13 AM CEST
6.2.3
Mon 03 Oct 2022 08:11:13 AM CEST
6.2.3
Mon 03 Oct 2022 08:11:14 AM CEST
6.2.3
Mon 03 Oct 2022 08:11:14 AM CEST
6.2.3
Mon 03 Oct 2022 08:11:14 AM CEST
6.2.3
Mon 03 Oct 2022 08:11:15 AM CEST
6.2.3
Mon 03 Oct 2022 08:11:15 AM CEST
6.2.3
Mon 03 Oct 2022 08:11:15 AM CEST
6.2.3
Mon 03 Oct 2022 08:11:16 AM CEST
6.2.3
Mon 03 Oct 2022 08:11:16 AM CEST
6.2.3
Mon 03 Oct 2022 08:11:16 AM CEST
6.2.3
Mon 03 Oct 2022 08:11:17 AM CEST
6.2.3
Mon 03 Oct 2022 08:11:17 AM CEST
6.2.3
Mon 03 Oct 2022 08:11:17 AM CEST
6.2.3
Mon 03 Oct 2022 08:11:17 AM CEST
6.2.3
Mon 03 Oct 2022 08:11:18 AM CEST
6.2.3
Mon 03 Oct 2022 08:11:18 AM CEST
6.2.3
Mon 03 Oct 2022 08:11:18 AM CEST
6.2.3
Mon 03 Oct 2022 08:11:19 AM CEST
6.2.3
Mon 03 Oct 2022 08:11:19 AM CEST
6.2.3
Mon 03 Oct 2022 08:11:19 AM CEST
6.2.3
Mon 03 Oct 2022 08:11:20 AM CEST
6.2.3
Mon 03 Oct 2022 08:11:20 AM CEST
6.2.3
Mon 03 Oct 2022 08:11:20 AM CEST
6.2.3
Mon 03 Oct 2022 08:11:21 AM CEST
6.2.3
Mon 03 Oct 2022 08:11:21 AM CEST
6.2.3
^C 


This is not a fluke, nor a network timeout on our end, as we're always seeing this with the massive collectors being started and stopped at that point. We have this on more than 1000 hosts in our environment, all running Agent2 and passing different network flows (they've been checked as we speak).


We hope you can look into this, as this is a big show stopper.


In case we need to provide any other data, or run some tests, please let me know.

Comment by Victor Breda Credidio [ 2022 Oct 04 ]
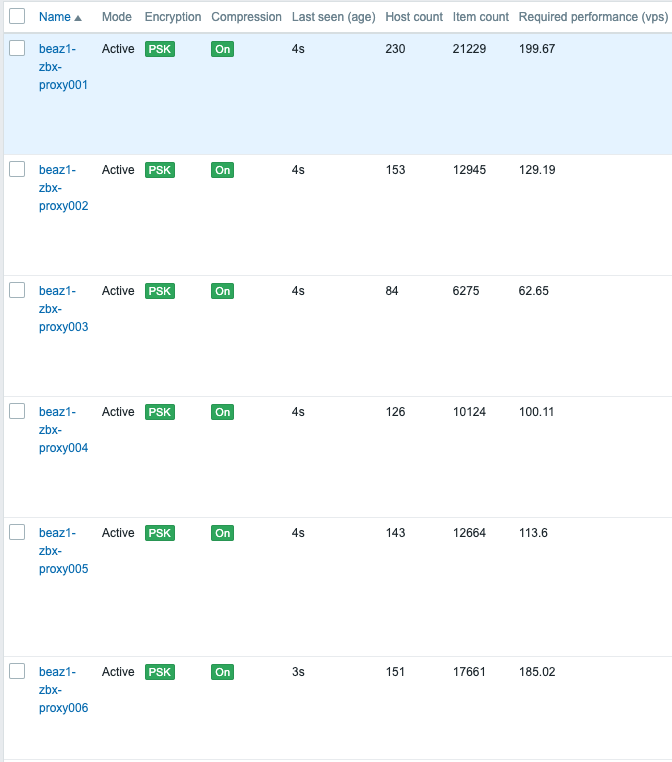
Hi Jeffrey!
Thanks for the info.
I'll be setting a new instance and trying to replicate the case, but it may take a while to reproduce this in a assertive way.

Can you confirm if this is happening only with one Proxy, what is the resources running on it (memory, CPU, type of disk) and what is the VPS it's working with (you can check that on Administration -> Proxies)?
Do you have another Proxy near to this one? If yes, can you check if its behaving like that as well? 

Comment by Jeffrey Descan [ 2022 Oct 04 ]

Hey Victor

Thanks for reproducing this. We're seeing this behaviour with all our proxies, we have 20 proxies running at this point.

All proxies have the same hardware requirements:

  • CPU: 8 cores
  • Memory: 8GB ram
  • Disk: 100GB (on /var) running on SSD SANs

The Zabbix proxy config:

LogFile=/var/log/zabbix/zabbix_proxy.log
LogSlowQueries=3000
LogRemoteCommands=1
TLSConnect=psk
ProxyLocalBuffer=24
ProxyOfflineBuffer=24
StartPollers=700
StartIPMIPollers=1
StartPollersUnreachable=350
StartPingers=100
StartHTTPPollers=30
StartSNMPTrapper=1
CacheSize=8G
HistoryIndexCacheSize=2G
EnableRemoteCommands=1
ConfigFrequency=60
PidFile=/run/zabbix/zabbix_proxy.pid
SocketDir=/run/zabbix
SNMPTrapperFile=/var/log/snmptrap/snmptrap.log
FpingLocation=/usr/bin/fping
Fping6Location=/usr/bin/fping6
SSHKeyLocation=/etc/zabbix/.ssh
Timeout=30
DBHost=localhost
DBName=zabbix
DBUser=zabbix
StartPreprocessors=40
StartDiscoverers=5
StartTrappers=10
StartDBSyncers=16
UnreachableDelay=45
UnavailableDelay=180
HistoryCacheSize=2G
DBSocket=/run/mysqld/mysqld.sock 

All running on 6.2.3:

[email protected]:~# dpkg -l | grep -i zabbix
ii  zabbix-agent2                        1:6.2.3-1+debian11             amd64        Zabbix network monitoring solution - agent
ii  zabbix-get                           1:6.2.3-1+debian11             amd64        Zabbix network monitoring solution - get
ii  zabbix-proxy-mysql                   1:6.2.3-1+debian11             amd64        Zabbix network monitoring solution - proxy (MySQL)
ii  zabbix-release                       1:6.2-2+debian11               all          Zabbix official repository configuration
ii  zabbix-sql-scripts                   1:6.2.3-1+debian11             all          Zabbix network monitoring solution - sql-scripts 


Our MySQL backend configuration:

port=3306
admin_address=127.0.0.1
admin_port=33062
create_admin_listener_thread=OFF
log_output=file
slow_query_log=OFF
long_query_time=5
log_slow_rate_limit=100
log_slow_rate_type=query
log_slow_verbosity=full
log_slow_admin_statements=ON
log_slow_slave_statements=ON
slow_query_log_always_write_time=1
slow_query_log_use_global_control=all
performance_schema=OFF
innodb_monitor_enable=all
userstat=1
skip_name_resolve=1
server_id=2887597872
log_slave_updates
gtid_mode=ON
enforce_gtid_consistency=ON
binlog_expire_logs_seconds=7200
default_authentication_plugin=mysql_native_password
skip_log_bin
innodb_buffer_pool_instances=8
innodb_buffer_pool_size=1536M
innodb_log_file_size=192M
key_buffer_size=0
thread_cache_size=15 


Some screenshots attached:

  • System information (see Jira attachments)
  • Proxy overview as requested


Please let me know if you need any other information.


Kind regards
Jeffrey

Comment by Jeffrey Descan [ 2022 Oct 13 ]

Hi Victor

Do you please have an update so far?

Jeffrey

Comment by Victor Breda Credidio [ 2022 Oct 26 ]

Hi Jeffrey!

Really sorry for the late response.
Unfortunately, I was not able to reproduce your problem. 

On my lab environment everything is working accordingly, so I imagine that this could perhaps be related to your infrastructure.
I've seen similar cases where the root cause was related to the ISP. Everything seemed to be working perfectly network wise, but when changing ISP, the problem was gone, and only the ISP could determine what was the issue.

Even though my environment is really small compared to yours, all the Zabbix components are working as expected. 

Best regards,
Victor.

Generated at Tue Apr 29 08:46:44 EEST 2025 using Jira 9.12.4#9120004-sha1:625303b708afdb767e17cb2838290c41888e9ff0.