[ZBX-22298] Kubernetes: Get state metrics - SCRIPT type TEXT limitation Created: 2023 Feb 03 Updated: 2024 Apr 10 Resolved: 2023 Mar 16 |
|
| Status: | Closed |
| Project: | ZABBIX BUGS AND ISSUES |
| Component/s: | Templates (T) |
| Affects Version/s: | 6.2.6 |
| Fix Version/s: | 6.0.15rc1, 6.4.1rc1, 7.0.0alpha1, 7.0 (plan) |
| Type: | Problem report | Priority: | Trivial |
| Reporter: | Benjamin Lutz | Assignee: | Denis Rasikhov |
| Resolution: | Fixed | Votes: | 2 |
| Labels: | items, templates, triggers | ||
| Remaining Estimate: | Not Specified | ||
| Time Spent: | Not Specified | ||
| Original Estimate: | Not Specified | ||
| Environment: |
production |
||
| Attachments: |
|
| Epic Link: | Zabbix 7.0 |
| Team: | |
| Sprint: | Sprint 97 (Feb 2023), Sprint 98 (Mar 2023) |
| Story Points: | 1 |
| Description |
|
Steps to reproduce:
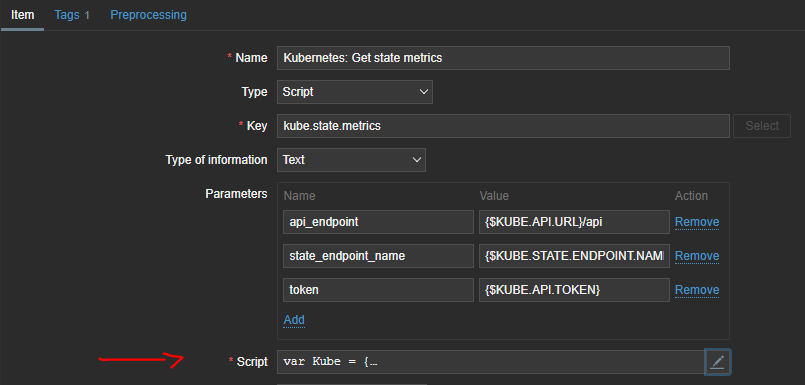
name: 'Kubernetes: Get state metrics'
type: SCRIPT
key: kube.state.metrics
value_type: TEXT
Result: Check Text data limits as per documentation https://www.zabbix.com/documentation/current/en/manual/config/items/item So out of10480 lines (checked by port-forward svc/zabbix-agent-kube-state-metrics and getting the metrics) zabbix is ingesting only 643 lines of my metrics. Resulting in data missing for a lot of items. Saw this issue while testing/forcing a pending pvc. The trigger 'PVC discovery ... PVC is pending' was not issuing/provoking a problem as it had no data in its item. Expected: |
| Comments |
| Comment by Wytze Aalbers [ 2023 Feb 03 ] |
|
This also applies for : Veeam by HTTP Browse Zabbix / Zabbix - ZABBIX GIT |
| Comment by Denis Rasikhov [ 2023 Feb 16 ] |
|
Hello! Actually, if you don't store the master item data in the DB (history is set to 0, which is the default for master items used for raw data), the only limitation you have here is the size of history cache, which is 16 MB by default. So this 65535 characters limit only applies for data that you actually store, and it's not the reason of your problem in that case. Here's more info about preprocessing: First of all, you could test the "Get state metrics" item manually and see if there is actually any data about existing persistent volume claims in the output. If there is not, but you have these claims set up, probably there's something with kube-state-metrics addon which doesn't give any data about them for some reason. Also could be some preprocessing issues. Share us a file with the actual Prometheus data from that item. |
| Comment by Benjamin Lutz [ 2023 Feb 16 ] |
|
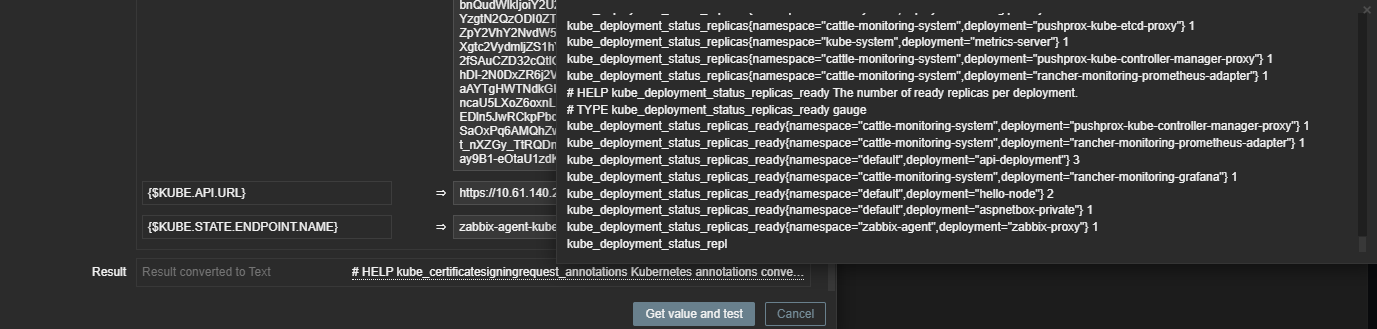
Hello, The test on "Get state metrics" item was already present in previous screenshot but I'll retrace my steps :
I have created a pvc called "www-broken-web-0" on one of my clusters. Searching for that pattern in the result of the "Get state metrics" item is unfruitful (text extracted from the "Get value and test" from the "Get state metrics" into a file named extract_from_zabbix) :
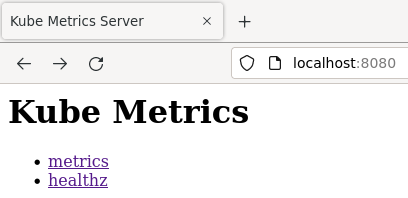
No results. The prometheus extract as I said previously is the result of : kubectl port-forward svc/zabbix-agent-kube-state-metrics -n zabbix-agent 8080
and extract of metrics into a file named extract_from_prometheus. In the prometheus extract from state metrics I do see the metrics/values :
So we do see the data in prometheus but not in the "Get state metrics" item. Further more when I go to check the latest data here is what I can see, so no values but weirdly enough the entries are there :
Maybe I haven't understood what you mean by "First of all, you could test the "Get state metrics" item manually and see if there is actually any data about existing persistent volume claims in the output."
Am at a loss, maybe I'm missing something... Hope this helps. |
| Comment by Benjamin Lutz [ 2023 Feb 16 ] |
|
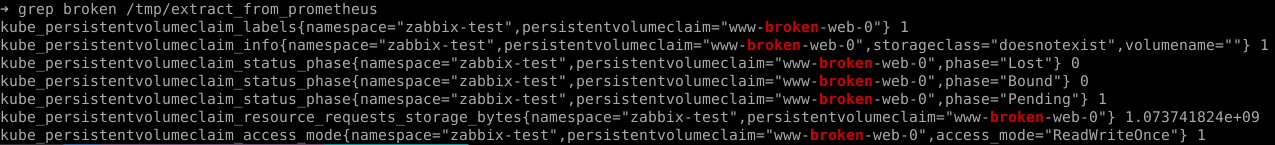
The screenshots were reduced visibly, sorry. Here is the data for that pvc :
➜ grep broken /tmp/extract_from_prometheus
kube_persistentvolumeclaim_labels{namespace="zabbix-test",persistentvolumeclaim="www-broken-web-0"} 1
kube_persistentvolumeclaim_info{namespace="zabbix-test",persistentvolumeclaim="www-broken-web-0",storageclass="doesnotexist",volumename=""} 1
kube_persistentvolumeclaim_status_phase{namespace="zabbix-test",persistentvolumeclaim="www-broken-web-0",phase="Lost"} 0
kube_persistentvolumeclaim_status_phase{namespace="zabbix-test",persistentvolumeclaim="www-broken-web-0",phase="Bound"} 0
kube_persistentvolumeclaim_status_phase{namespace="zabbix-test",persistentvolumeclaim="www-broken-web-0",phase="Pending"} 1
kube_persistentvolumeclaim_resource_requests_storage_bytes{namespace="zabbix-test",persistentvolumeclaim="www-broken-web-0"} 1.073741824e+09
kube_persistentvolumeclaim_access_mode{namespace="zabbix-test",persistentvolumeclaim="www-broken-web-0",access_mode="ReadWriteOnce"} 1
|
| Comment by Denis Rasikhov [ 2023 Feb 17 ] |
Yes, you've done it right with "Get value and test" (that also works just fine for testing items collected by active proxies).
Not sure if the frontend might limit the actual output, you can try to copy it directly from webpage source code: In my case on my testing cluster the overall Prometheus data length received by Zabbix was 209 425 characters which is the same as I would get from the actual Prom endpoint myself.
In that case you'll get truncated master item with length of 65535 characters, but dependent items will actually see the whole master item data without any truncation. So, I've checked everything and the reason is the mistake in the label on metrics preprocessing:
kube_persistentvolumeclaim_status_phase{namespace="{#NAMESPACE}", name="{#NAME}", phase="Pending"}
This should be:
kube_persistentvolumeclaim_status_phase{namespace="{#NAMESPACE}", persistentvolumeclaim="{#NAME}", phase="Pending"}
Also metrics for the phase "Available" should be removed as there is no such status for PVC (kube_persistentvolumeclaim_status_phase) according to the kube-state-metric documentation: |
| Comment by Denis Rasikhov [ 2023 Mar 13 ] |
|
Fixed in:
|
| Comment by Benjamin Lutz [ 2023 Mar 28 ] |
|
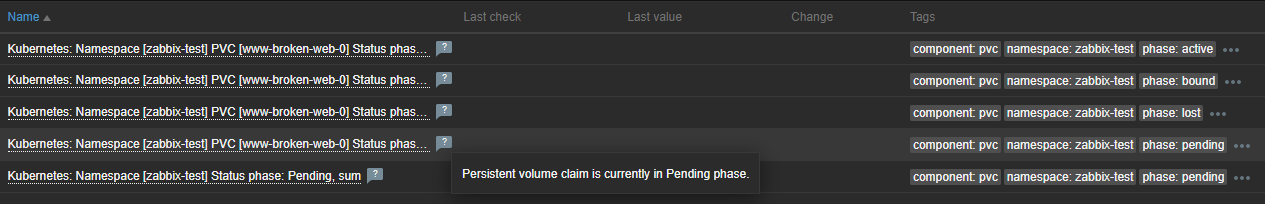
Imported the new template and eureka :
Thank you so much for your promptness and solution. |