[ZBX-22955] Simple graph generation with trends instead of history Created: 2023 Jun 12 Updated: 2023 Jun 30 Resolved: 2023 Jun 30 |
|
| Status: | Closed |
| Project: | ZABBIX BUGS AND ISSUES |
| Component/s: | Frontend (F) |
| Affects Version/s: | 6.4.3 |
| Fix Version/s: | None |
| Type: | Problem report | Priority: | Trivial |
| Reporter: | Rodrigo Alexandre Menegaldo | Assignee: | Tomass Janis Bross |
| Resolution: | Won't fix | Votes: | 0 |
| Labels: | None | ||
| Remaining Estimate: | Not Specified | ||
| Time Spent: | Not Specified | ||
| Original Estimate: | Not Specified | ||
| Attachments: |
|
| Description |
|
After updating to version 6.4.3 I changed the Data storage period housekeeping history from 3 days to 7 days. Before the change when selecting 3 days the graph was generated by history (graph 3 days history.jpg) After changing the history retention period to 7 days and waiting for the retention period the charts are being generated as trends. When I select a shorter period within the 7 days ex. 06/05/2023 the data is generated by history(graph 1 day history.jpg) Analyzing the database table we can see that we have records with 7 days (registry database.jpg) date conversion(convertion date.jpg) |
| Comments |
| Comment by Rodrigo Alexandre Menegaldo [ 2023 Jun 16 ] |
|
Hello Tomass Janis Bross, Could you help me with this problem, Best Regards |
| Comment by Tomass Janis Bross [ 2023 Jun 20 ] |
|
Hello Rodrigo! This, to me, seems like it is not an issue, but is working as expected. If you have configured to keep 7 days of history, then if you try to show data older than 7 days in the graph, it will show trends. Cheers, |
| Comment by Rodrigo Alexandre Menegaldo [ 2023 Jun 20 ] |
|
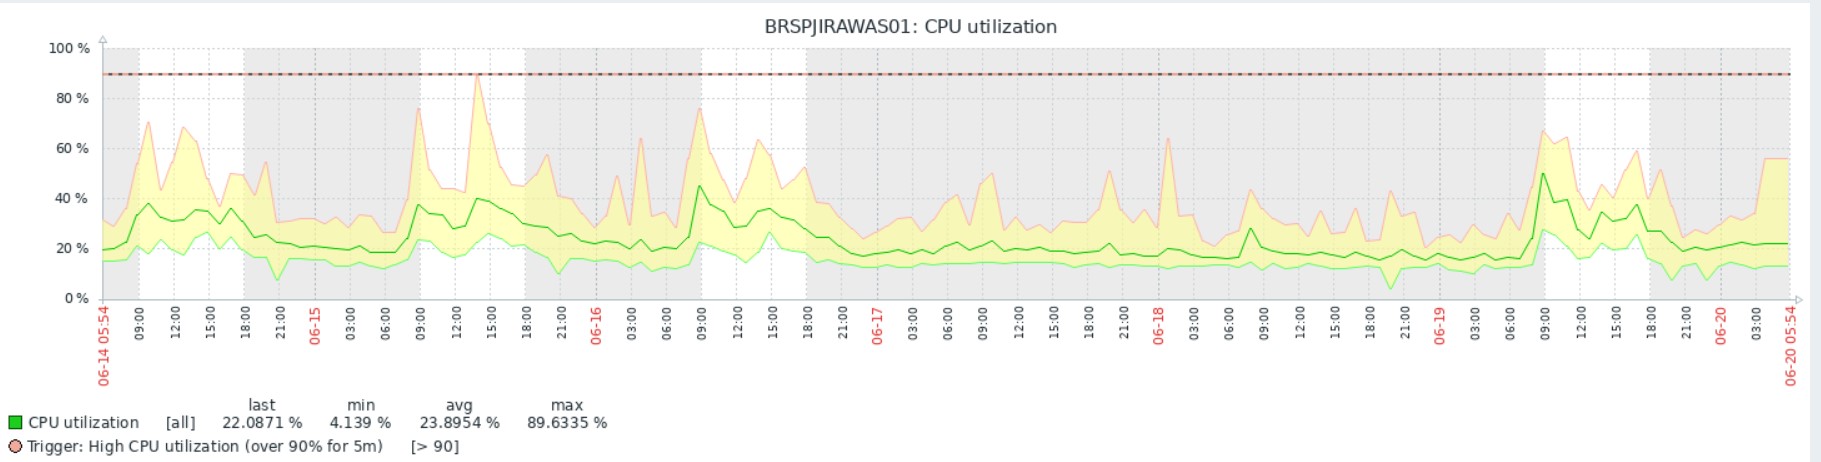
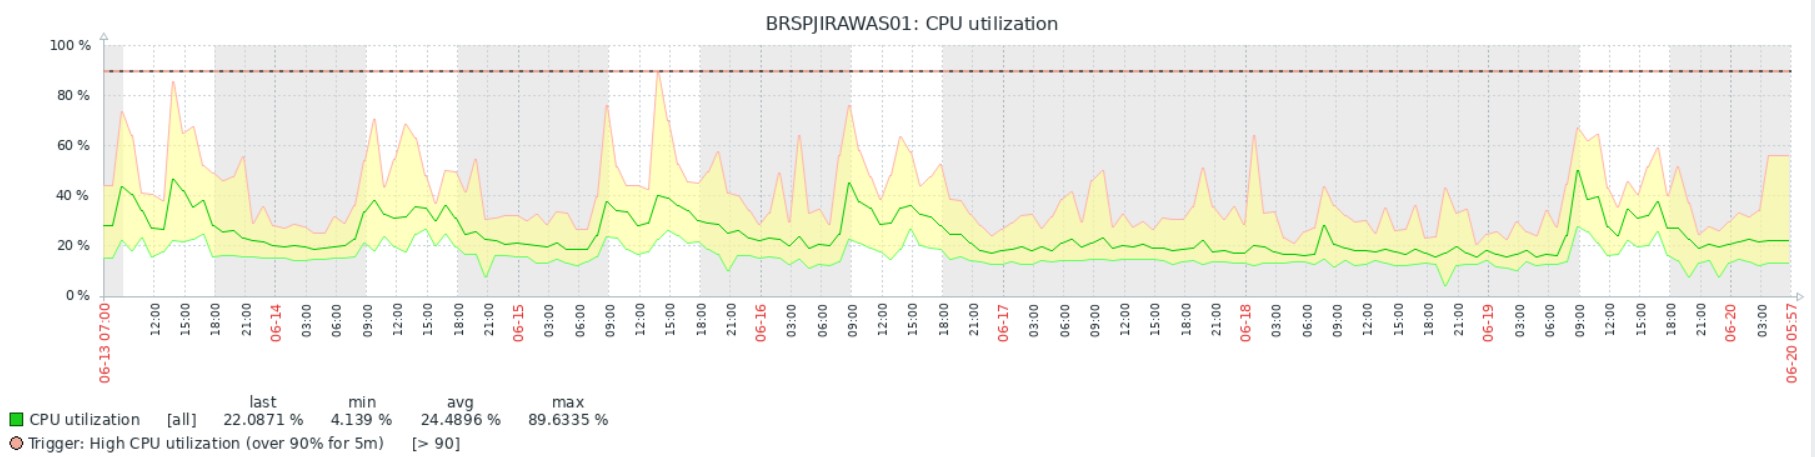
Hello Dear Tom, Thanks for the reply, I am sending you the 6 day and 6 day and 23 hour charts the chart is generated as trends. As previously informed, if I select a period close to 7 days ago and the graph is generated as history, see the image (graph 3 days history.jpg). below graphs: 6 days
6 dias and 23 horas
|
| Comment by Rodrigo Alexandre Menegaldo [ 2023 Jun 27 ] |
|
Hello Dear Tom, Please managed to analyze the charts, see the chart with 6 days is like trends. Can you help me? Best Regards |
| Comment by Tomass Janis Bross [ 2023 Jun 30 ] |
|
Hello Rodrigo! I've been talking with our developer team and we have come to a conclusion that this is not a bug, it is working as intended.This code is responsible for determining whether the graph is going to use trend data or history data. The logic of the code is as follows:
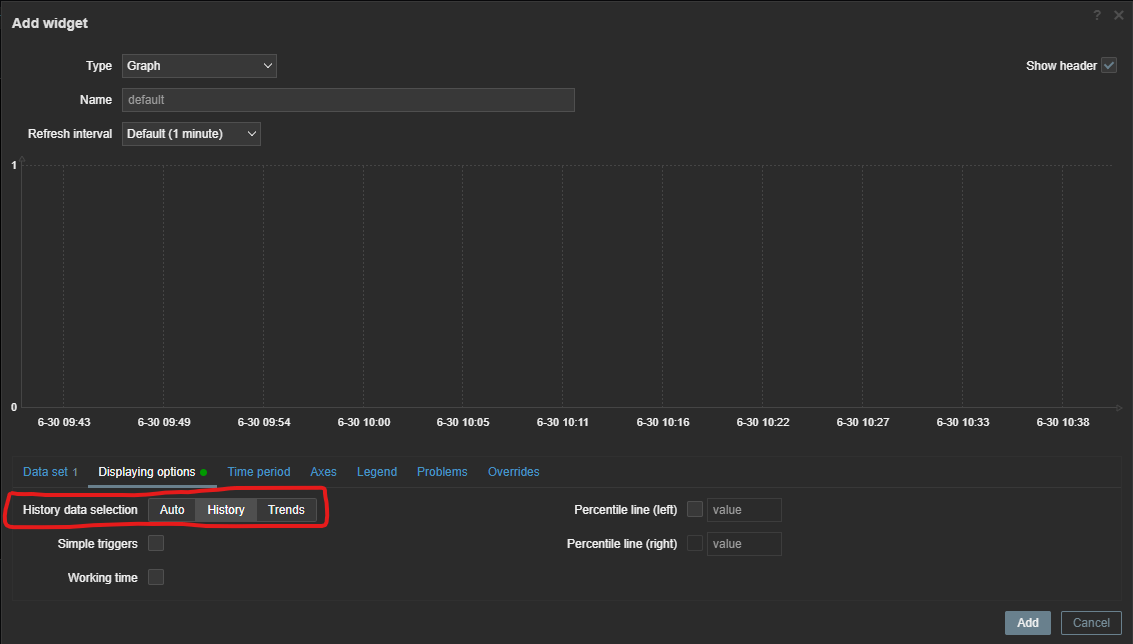
Essentially it chooses trend data after 2 days because of the pixel amount on your screen. If you wish to look at longer periods of history data, you can do that by creating a widget "Graph" on your dashboard, and under the section "Displaying options" setting the parameter "History data selection" to "history".
Closing this issue. |