|
Sub-task |
|||
| part of |
|
Please fix variable "uplinks" in mera... | Closed |

[ZBX-23164] Template Zabbix API Meraki - returns only the last vpnStats endpoint object. Created: 2023 Jul 26 Updated: 2024 Apr 10 Resolved: 2023 Oct 05 |
|
| Status: | Closed |
| Project: | ZABBIX BUGS AND ISSUES |
| Component/s: | Templates (T) |
| Affects Version/s: | 6.0.18 |
| Fix Version/s: | 6.0.23rc1, 6.4.8rc1, 7.0.0alpha6, 7.0 (plan) |
| Type: | Problem report | Priority: | Major |
| Reporter: | Dierlys | Assignee: | Evgenii Gordymov |
| Resolution: | Fixed | Votes: | 1 |
| Labels: | Meraki, templates | ||
| Remaining Estimate: | Not Specified | ||
| Time Spent: | Not Specified | ||
| Original Estimate: | Not Specified | ||
| Attachments: |
|
||||||||
| Issue Links: |
|
||||||||
| Team: | |
||||||||
| Sprint: | Sprint 104 (Sep 2023), Sprint 105 (Oct 2023) | ||||||||
| Story Points: | 1 | ||||||||
| Description |
|
I don't know if this is the correct channel, but I'm using the zabbix template to collect metrics from the Meraki Dashboard API, to monitor my organization's devices. I'm having problems with the Meraki item: Get list of the vpn stats from the Cisco Meraki organization by HTTP template. This javascript makes a request on the /appliance/vpn/stats endpoint and performs a loop to retrieve the object for each of the "devices". However, the way the loop is implemented and its return, it always brings the last object found in the request. For example, I have more than 50 devices in my organization, the item Meraki: Get list of the networks correctly searches each device and its parameters. The item mentioned above, on the other hand, returns only a single device, which is the last object of the request's json return. Is it possible to analyze this problem and apply a fix? Below is the code I mentioned that has the bug. Link template: https://www.zabbix.com/br/integrations/meraki var params = JSON.parse(value); var request = new HttpRequest(); request.addHeader('X-Cisco-Meraki-API-Key:' + params.token); request.addHeader('User-Agent: ZabbixServer/1.0 Zabbix'); var response, error_msg = '', vpnStats = [], result = []; function getHttpData(url) { response = request.get(url); Zabbix.log(4, '[ Meraki API ] [ ' + url + ' ] Received response with status code ' + request.getStatus() + ': ' + response); if (response !== null) { try { response = JSON.parse(response); } catch (error) { throw 'Failed to parse response received from Meraki API. Check debug log for more information.'; } } if (request.getStatus() !== 200) { if (response.errors) { throw response.errors.join(', '); } else { throw 'Failed to receive data: invalid response status code.'; } } if (typeof (response) !== 'object' || response === null) { throw 'Cannot process response data: received data is not an object.'; } return response; }; try { if (params.token === '\{' + '$MERAKI.TOKEN}') { throw 'Please change \{' + '$MERAKI.TOKEN} macro with the proper value.'; } if (params.url.indexOf('http://') === -1 && params.url.indexOf('https://') === -1) { params.url = 'https://' + params.url; } if (!params.url.endsWith('/')) { params.url += '/'; } if (typeof params.httpproxy !== 'undefined' && params.httpproxy !== '') { request.setProxy(params.httpproxy); } vpnStats = getHttpData(params.url + 'organizations/' + encodeURIComponent(params.organizationId) + '/appliance/vpn/stats'); for (i in vpnStats) { if (typeof vpnStats[i].merakiVpnPeers !== 'undefined' && Array.isArray(vpnStats[i].merakiVpnPeers)) { for (u in vpnStats[i].merakiVpnPeers) { if (typeof vpnStats[i].merakiVpnPeers[u].latencySummaries !== 'undefined' && Array.isArray(vpnStats[i].merakiVpnPeers[u].latencySummaries)) { for (l in vpnStats[i].merakiVpnPeers[u].latencySummaries) { result = vpnStats[i].merakiVpnPeers[u].latencySummaries.map(function (x) { lps = vpnStats[i].merakiVpnPeers[u].lossPercentageSummaries.filter(function (y) \{ return y.senderUplink == x.senderUplink && y.receiverUplink == x.receiverUplink; }); js = vpnStats[i].merakiVpnPeers[u].jitterSummaries.filter(function (y) \{ return y.senderUplink == x.senderUplink && y.receiverUplink == x.receiverUplink; }); ms = vpnStats[i].merakiVpnPeers[u].mosSummaries.filter(function (y) \{ return y.senderUplink == x.senderUplink && y.receiverUplink == x.receiverUplink; }); Object.assign(x, lps[0], js[0], ms[0]); if ('networkId' in vpnStats[i]) { x.networkId = vpnStats[i].networkId; } if ('networkName' in vpnStats[i]) { x.networkName = vpnStats[i].networkName; } if ('networkId' in vpnStats[i].merakiVpnPeers[u]) { x.peerNetworkId = vpnStats[i].merakiVpnPeers[u].networkId; } if ('networkName' in vpnStats[i].merakiVpnPeers[u]) { x.peerNetworkName = vpnStats[i].merakiVpnPeers[u].networkName; } return x; }); } } } } } } catch (error) { error_msg = error; }; return JSON.stringify({ 'vpnStats': result, 'error': error_msg.toString() }); |
| Comments |
| Comment by Evgenii Gordymov [ 2023 Sep 12 ] |
|
Fixed in:
|
| Comment by Dierlys [ 2023 Sep 14 ] |
|
First I would like to thank you regarding issue I would like to leave some suggestions and request an improvement. I don't know if I should comment here or if I should create a new Issue, forgive me if I'm doing it wrong. If necessary, I can open a new Isse. Improvement: I checked by collecting the metrics from the Cisco Meraki organization by HTTP template and the item Meraki: Get list of the VPN stats and composing them with the metrics from the Cisco Meraki Dashboard, I realized that the values collected through the javascript script refer to the last 24 hours (last day). However, it would be very important to get the most recent data possible, and as verified in the official Meraki API doc, I saw that it is possible to use a timespan in sec as a parameter in the request. I made a request via Postman and validated the use of the timespan, on the vpnstats endpoint I would like you to add the timespan parameter to the script and item Meraki: Get list of the VPN stats and meraki.get.networks, in order to collect the most recent data available on the dasboard/API. Suggestions: 1st - Add in the Template Readme that it is necessary to register the Macro {$ID} with the value of the organization's ID in the Host or template, for data collection to work correctly. 2nd - I verified that the item prototypes VPN [ {#NETWORK.NAME}|#NETWORK.NAME}] [ {#SENDER.UPLINK}|#SENDER.UPLINK}]=>{#PEER.NETWORK.NAME} {#RECEIVER.UPLINK}: jitter avg and VPN [ {#NETWORK.NAME}][{#SENDER.UPLINK}|#SENDER.UPLINK}]=>[ {#PEER.NETWORK.NAME}|#PEER.NETWORK.NAME}] [ {#RECEIVER.UPLINK}|#RECEIVER.UPLINK}]: loss avg, % were with the Type of information as Numeric (unsigned ). This was generating a collection error, since the values are decimal. To fix it, I went to the template and changed the Type of information to Numeric (float). It would be interesting to correct this detail in a next update. 3rd - Add a trigger to validate the VPN status, in VPN stats discovery. I created a trigger that validates if vpn.stat.loss.avg is >= 90%, in network terms when this metric reaches this percentage it is a sign that the VPN is unavailable. I used the following expression: last(/Cisco Meraki organization by HTTP/meraki.vpn.stat.loss.avg[ {#NETWORK.ID}, {#SENDER.UPLINK}, {#PEER.NETWORK.ID}, {#RECEIVER.UPLINK}|#NETWORK.ID}, {#SENDER.UPLINK}, {#PEER.NETWORK.ID}, {#RECEIVER.UPLINK}]) >=90.0 However, for this trigger to work more accurately, it is necessary to collect the most recent data possible for this metric, hence the improvement of the timespan in the request, as by default it is taking the last day. If necessary, I can send some images to better illustrate. Thanks in advance. |
| Comment by Evgenii Gordymov [ 2023 Sep 15 ] |
|
Hi direlys, thanks for your suggestions and request improvement, it's very good to have feedback from real Cisco Meraki templates users, btw in item 'Meraki: Get device data' in JavaSript we used timespan parameter '/devices/uplinksLossAndLatency?timespan=60', If it's deemed really useful, we will add this to the request for VPN stats. If it's not difficult for you, could you attach the information mentioned above to this task? |
| Comment by Dierlys [ 2023 Sep 18 ] |
|
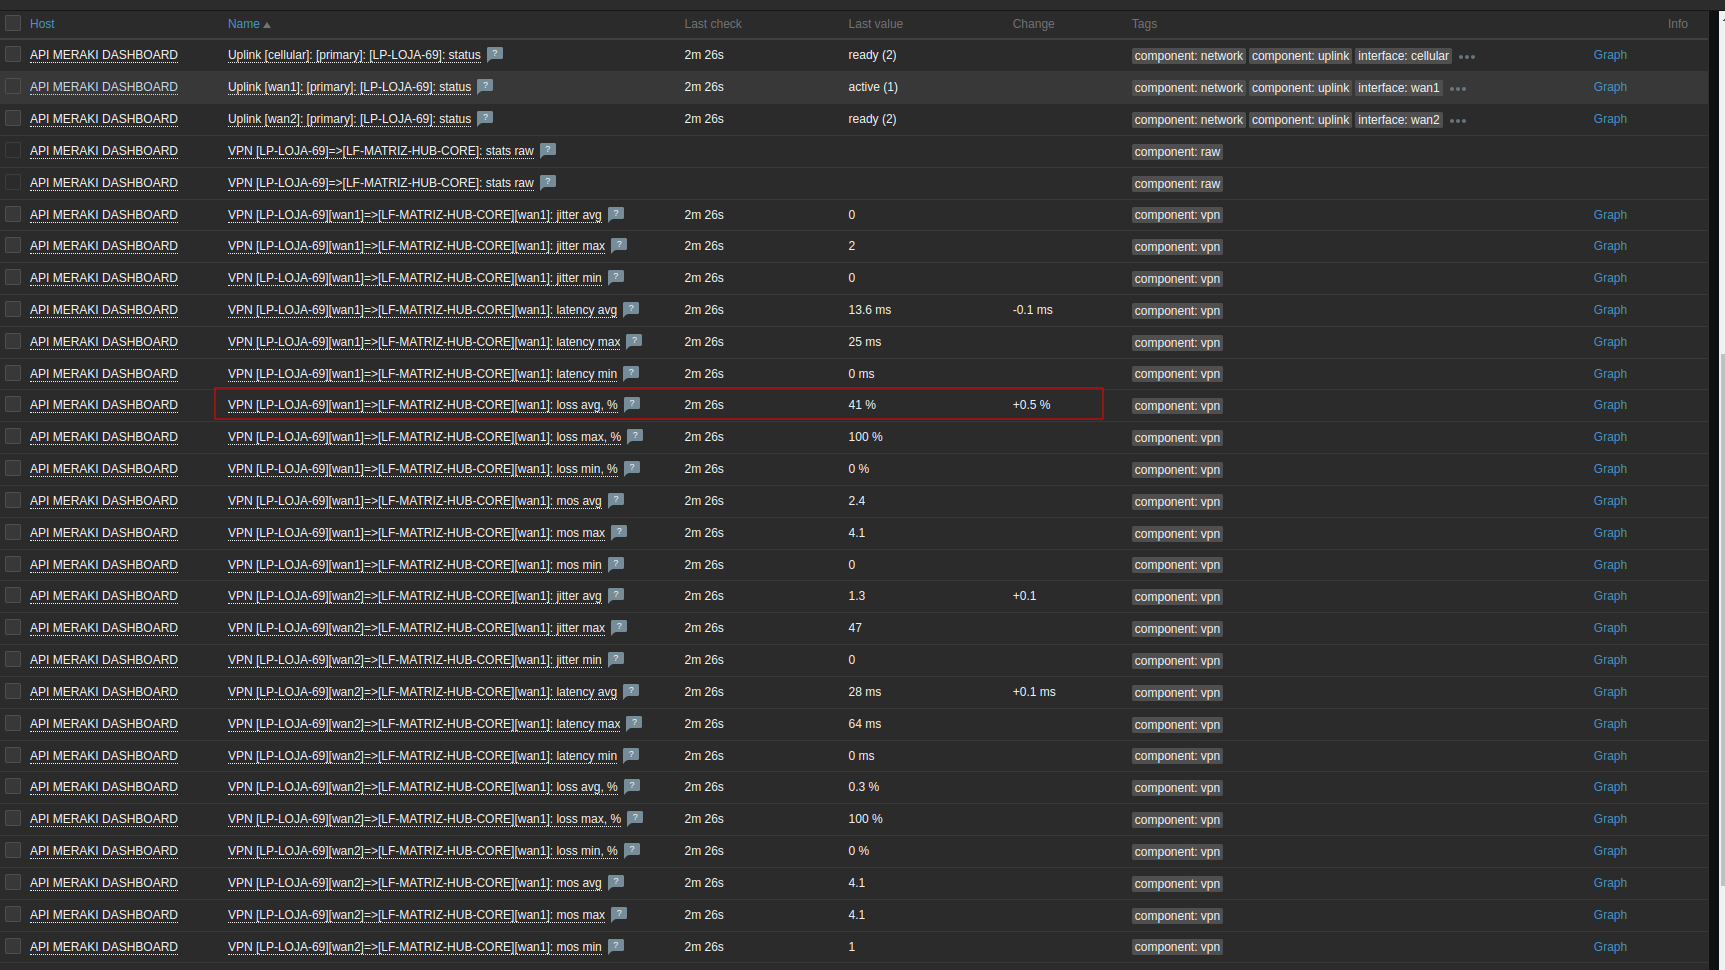
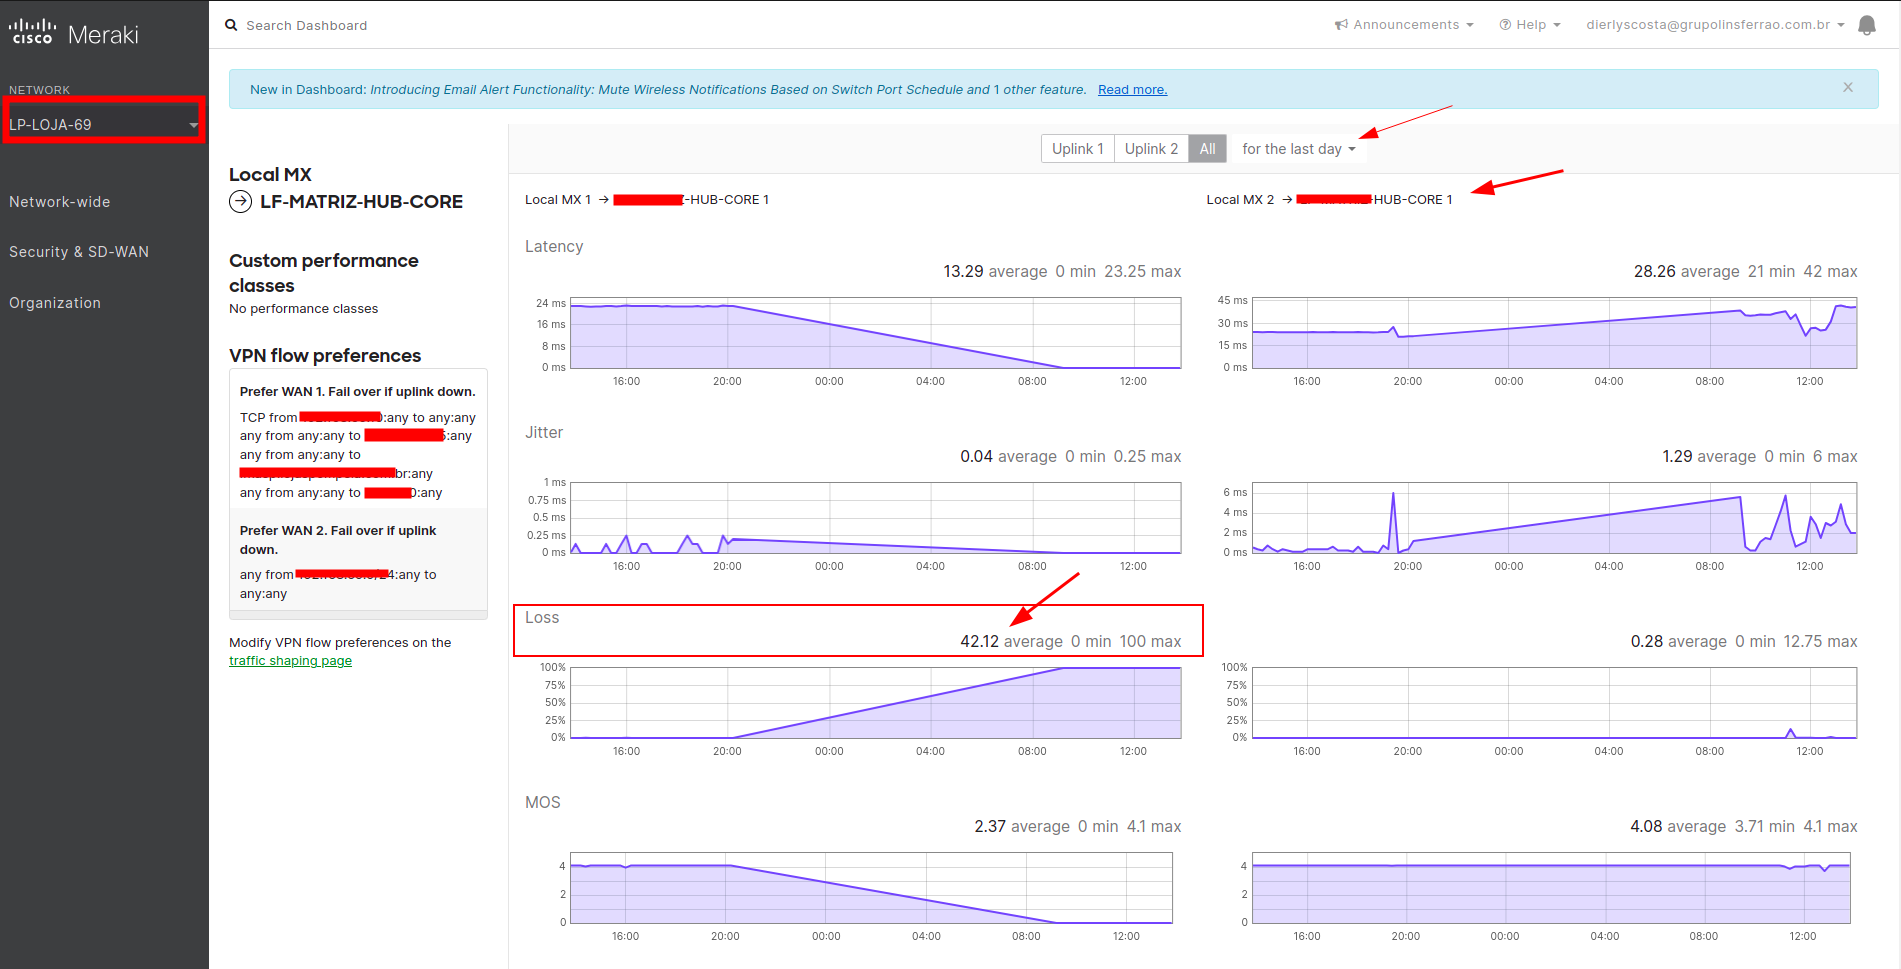
Hello good afternoon, Firstly, thank you for your feedback. Yes, it would be very important to add the timespan parameter to the VPN metrics. Because it is based on the avgloss percentage item, in which I created a trigger, to validate whether the VPN is operational or not. Below are the tests I did, as an example. In zabbix, the item by default collects the timespan referring to the last day, as can be seen in the image avg_loss_l69.png Meraki Dashboard with filter last day dash_meraki_l69.png Because AVG is the average, and considering the average of an entire day, the value in this example is close to 40%. However, I need the most recent value possible. So I tested the request via Postman image 1, setting the timespan as 3600s = 1h, where the avgloss percentage is equal to 100%. postman_l69.png In the other image, without defining the timespan parameter, by default the metric collects referring to the last day, being close to 40% postman_l69_2.png |
| Comment by Evgenii Gordymov [ 2023 Oct 03 ] |
|
Fixed in:
|