[ZBX-23394] Azure monitoring for MS SQL doesn't work Created: 2023 Sep 11 Updated: 2025 Oct 16 Resolved: 2025 Oct 16 |
|
| Status: | Closed |
| Project: | ZABBIX BUGS AND ISSUES |
| Component/s: | Templates (T) |
| Affects Version/s: | 6.0.21 |
| Fix Version/s: | None |
| Type: | Incident report | Priority: | Trivial |
| Reporter: | Anton N. | Assignee: | Aleksejs Abrosimovs |
| Resolution: | Fixed | Votes: | 6 |
| Labels: | templates | ||
| Remaining Estimate: | Not Specified | ||
| Time Spent: | Not Specified | ||
| Original Estimate: | Not Specified | ||
| Attachments: |
|
| Team: | |
| Description |
|
Steps to reproduce:
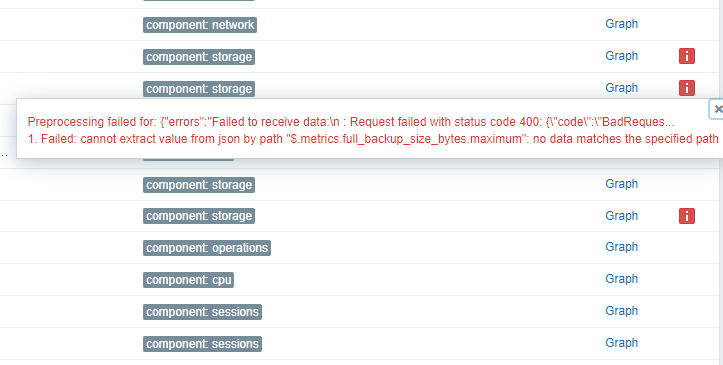
Result: If you change JS script (exclude some of the metrics, for example) it will solve the problem (at least, part of them)
Expected: \"},{\"type\":\"string\",\"info\":\"ExceptionType=Microsoft.Online.Metrics.MetricsMP.Utilities.RPRequestFormatException\"}],\"code\":\"BadRequest\",\"message\":\"Failed to find metric configuration for provider: Microsoft.Sql, resource Type: servers/databases, metric: cpu_limit, Valid metrics: cpu_percent,physical_data_read_percent,log_write_percent,dtu_consumption_percent,storage,connection_successful,connection_failed,connection_failed_user_error,blocked_by_firewall,deadlock,storage_percent,xtp_storage_percent,workers_percent,sessions_percent,sessions_count,dtu_limit,dtu_used,sqlserver_process_core_percent,sqlserver_process_memory_percent,sql_instance_cpu_percent,sql_instance_memory_percent,tempdb_data_size,tempdb_log_size,tempdb_log_used_percent,allocated_data_storage,ledger_digest_upload_success,ledger_digest_upload_failed\"}}\nfull_backup_size_bytes,diff_backup_size_bytes,log_backup_size_bytes : Request failed with status code 400: {\"error\":{\"additionalInfo\":[{\"type\":\"string\",\"info\":\"TraceId= {a4d44fb2-b52a-4e9c-a555-9605bc6c4b2a}\"},{\"type\":\"string\",\"info\":\"ExceptionType=Microsoft.Online.Metrics.MetricsMP.Utilities.RPRequestFormatException\"}],\"code\":\"BadRequest\",\"message\":\"Failed to find metric configuration for provider: Microsoft.Sql, resource Type: servers/databases, metric: full_backup_size_bytes, Valid metrics: cpu_percent,physical_data_read_percent,log_write_percent,dtu_consumption_percent,storage,connection_successful,connection_failed,connection_failed_user_error,blocked_by_firewall,deadlock,storage_percent,xtp_storage_percent,workers_percent,sessions_percent,sessions_count,dtu_limit,dtu_used,sqlserver_process_core_percent,sqlserver_process_memory_percent,sql_instance_cpu_percent,sql_instance_memory_percent,tempdb_data_size,tempdb_log_size,tempdb_log_used_percent,allocated_data_storage,ledger_digest_upload_success,ledger_digest_upload_failed\"}}","metrics":{"allocated_data_storage":{"timeStamp":"2023-09-11T11:14:00Z","average":50331648}},"health":{"availabilityState":"Available","title":"Available","summary":"There aren't any known Azure platform problems affecting this SQL database or SQL data warehouse.","reasonType":"","category":"Not Applicable","context":"Not Applicable","occuredTime":"2023-08-12T00:00:00Z","reasonChronicity":"Persistent","reportedTime":"2023-09-11T11:15:02.6321282Z"}}
|
| Comments |
| Comment by Bartosz Mickiewicz (Inactive) [ 2023 Nov 16 ] | ||||
|
Thanks for reporting that, but unfortunately I don't think that's a bug.
According to Microsoft, those metrics are available, just not returned in your case. | ||||
| Comment by Victor Andres Siña Sotomayor [ 2024 Feb 15 ] | ||||
|
Hi all Im new in Zabbix and I have the same configuration issue for Azure SQL database monitoring. As I read here, I know that the issue appears due cpu_limit and full_backup_size_bytes metrics that are not compatible for the kind of database that is deployed. But, How to remove this two metrics.? I try, disabling the Azure Microsoft SQL: Get data: Azure Microsoft SQL: CPU limit in the template section without success. Any clue I will appreciate it.
Regards Victor | ||||
| Comment by Anton N. [ 2024 Jun 12 ] | ||||
|
Its still exits for all new released templates Is it something to fix?
Only one workaround is available for now - exclude metrics from template by commenting related sections | ||||
| Comment by Victor Andres Siña Sotomayor [ 2024 Jun 14 ] | ||||
|
Thanks | ||||
| Comment by Steve Dixon [ 2024 Nov 20 ] | ||||
|
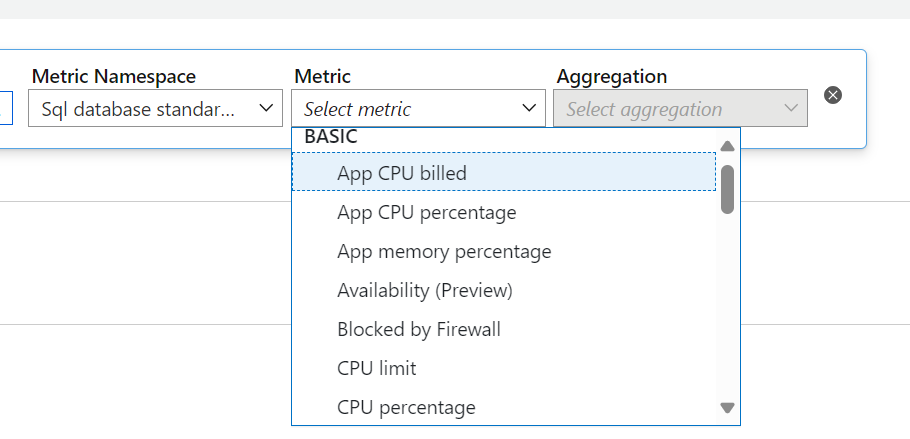
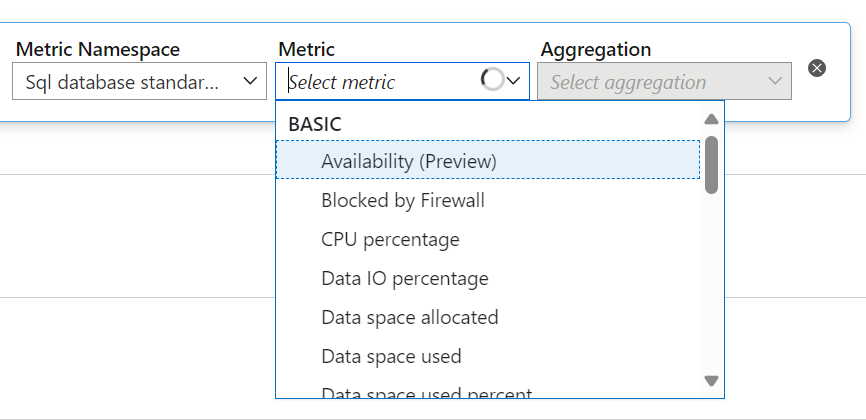
Hi all There appears to be 2 types of Azure SQL Databases based on their Pricing Tier Serverless has a set of metrics which include CPU Limit
And Standard has a different Set of Metrics which does not include CPU Limit
Can the template be updated to automatically detect the version of SQL Database Deployed and adjust the metric capture accordingly? | ||||
| Comment by Łukasz [ 2025 Feb 19 ] | ||||
|
That's the thing, the same API calls are provided for supported and non-supported resources. Either the template should be automatically using calls appropriate to given DB/Server type (ideally) or there should be different templates for each subtype. | ||||
| Comment by Łukasz [ 2025 Feb 20 ] | ||||
|
Looks like it will be fixed here | ||||
| Comment by Aleksejs Abrosimovs [ 2025 Oct 16 ] | ||||
|
Confirm. From 7.0.11rc1, 7.2.5rc1, 7.4.0beta1 versions, such databases are discovered as DTU-based MSSQL hosts and separate corresponding template is assigned. |