[ZBX-23722] Drastically higher memory usage for Script items on 6.4 Created: 2023 Nov 17  Updated: 2024 Jul 31  Resolved: 2024 Jan 23

Status: Closed
Project: ZABBIX BUGS AND ISSUES
Component/s: Proxy (P), Server (S)
Affects Version/s: None
Fix Version/s: 6.0.26rc1, 6.4.11rc1, 7.0.0beta1, 7.0 (plan)

Type: Problem report Priority: Major
Reporter: Tomass Janis Bross Assignee: Andrejs Sitals (Inactive)
Resolution: Fixed Votes: 1
Labels: None
Remaining Estimate: Not Specified
Time Spent: Not Specified
Original Estimate: Not Specified

Attachments: PNG File image-2023-11-17-17-59-38-905.png     PNG File image-2023-11-17-18-02-54-532.png     PNG File image-2024-07-31-11-20-12-546.png    
Issue Links:
Causes
caused by ZBX-22805 JavaScript engine exception "Error: a... Closed
Duplicate
is duplicated by ZBX-24113 zabbix_server: preprocessing manager ... Closed
Team: Team A
Sprint: S2401-1
Story Points: 3

 Description   

We had a report from a customer that after upgrading from 6.2 to 6.4 they saw that their memory usage had increased drastically, from ~8GB to ~16GB. During troubleshooting we noticed that after disabling the Cisco Meraki template, which has quite a bit of Script items, the memory usage decreased to the previous 8GB.

At first the customer was using 6.2 Cisco Meraki template on a 6.4 installation, and it seemed like there was a memory leak, as the available memory continued to decrease.
Available memory after enabling Cisco Meraki template on the night of 25th:

After upgrading the template to 6.4, the memory usage was still drastically high, but it seems to have stopped growing, leading us to believe there is not a memory leak but simply the memory usage is much higher.
Available memory after enabling updated 6.4 Cisco Meraki template, memory usage stabilises but still is much higher than previous version of Zabbix:

If the Cisco Meraki template is disabled, the memory usage drops by ~8GB.


 Comments   
Comment by Andrejs Sitals (Inactive) [ 2024 Jan 03 ]

ZBX_ES_MEMORY_LIMIT controls the amount of memory that can be allocated by scripts on each poller. It looks like it used to be 10MB, but was increased to 64MB in ZBXNEXT-6386 and to 512MB in ZBX-22805. Currently Zabbix 6.2 has 64MB limit, 6.0, 6.4 and master - 512MB.

To test how this affects memory consumption, only one poller process was started, 110 memory-intensive script items were created, then "Execute now" was used for all items. Here's the script that was used:

function randInt(min, max)
{
    return min + Math.floor(Math.random() * (max - min + 1));
}

var len = randInt(1000000, 2000000);
var sum = 0;
var arr = new Array(len);

for (var i = 0; i < len; i++)
{
    arr[i] = i;
}
for (var i = 0; i < len; i++)
{
    sum += arr[i] & 0xFFFFFFFF;
}

return sum & 0x0FFFFFFF;

Lowering memory limit to 64MB and adding some logging in es_malloc() reveals that it often returns NULL (i.e., script engine has already used all "available" memory) - almost every call to get_value_script() results in "out of memory". Though script items are executed successfully. Memory consumption of dev virtual machine variesĀ  between 2.21GB and 2.28GB during the test.

Rising memory limit back to 512MB gives considerably larger memory consumption and much smaller number of "failed" calls to es_malloc() which seem to be "periodic" - once per ~20 calls to get_value_script(). Memory consumption of dev vm is between 2.31GB and 2.72GB during the test.

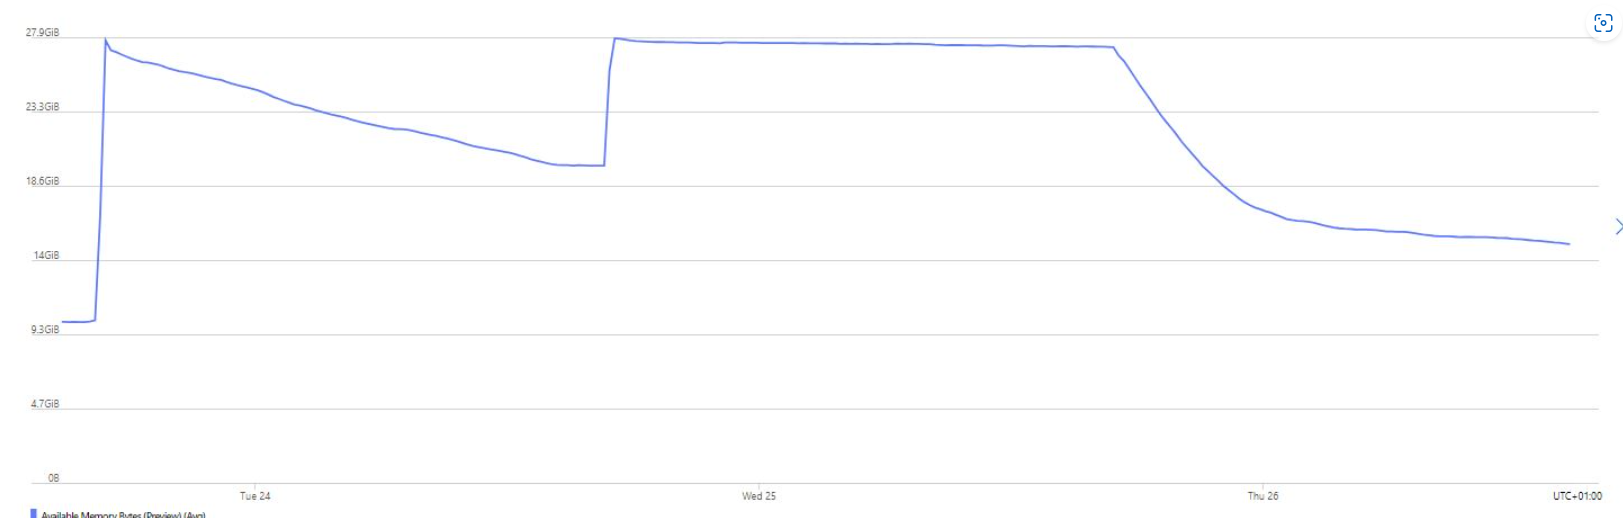
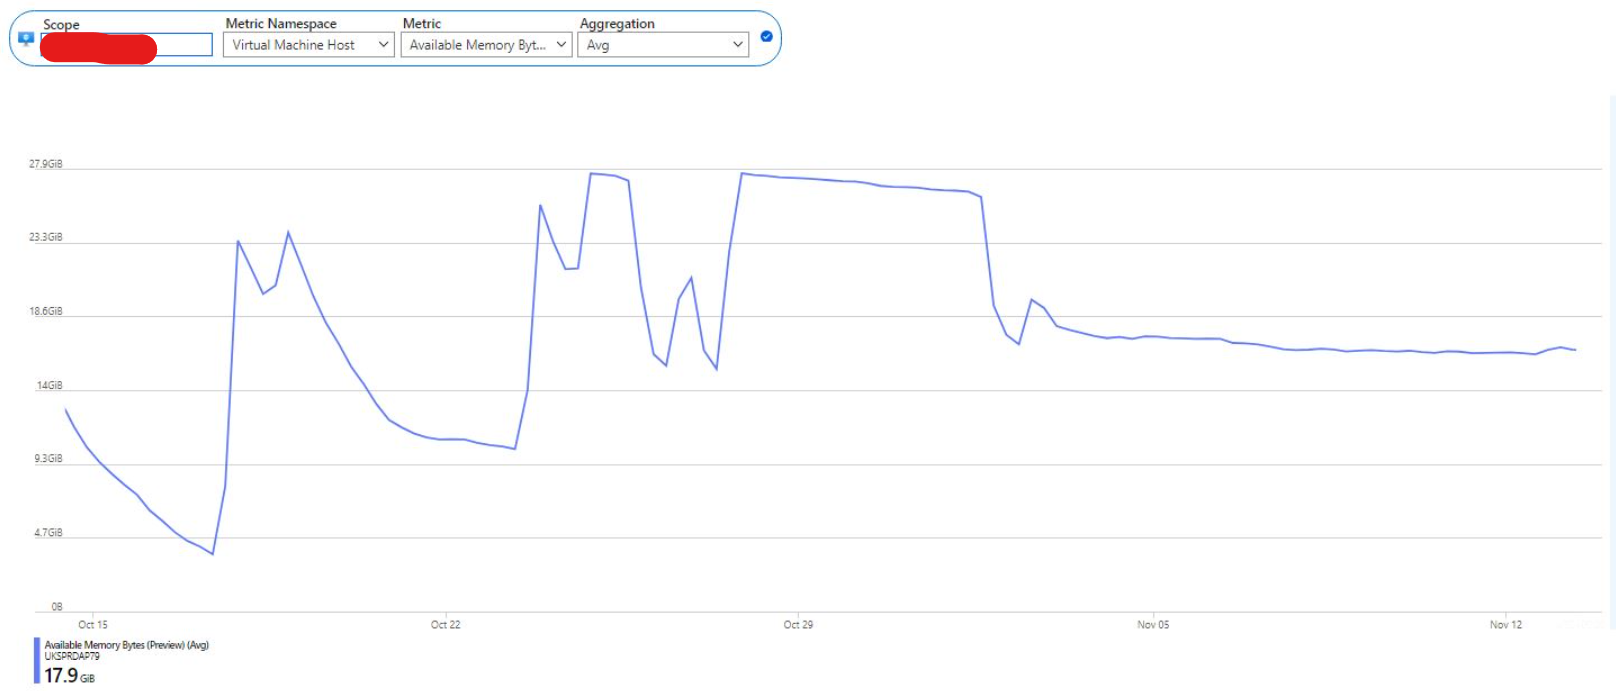
When memory limit is increased to 2048MB, calls to es_malloc() don't result in "out of memory" anymore with the mentioned test items, though the memory consumption gets very high until all "Execute now" tasks are finished. When they're done, most of the memory gets released, though memory consumption during idle periods still remains higher than with lower ZBX_ES_MEMORY_LIMIT values.

From the tests it looks like script engine is optimizing memory management either by reusing allocated memory or by delaying releasing the memory. When ZBX_ES_MEMORY_LIMIT is high, this can result in high memory usage.

To fix the issue, either ZBX_ES_MEMORY_LIMIT has to be lowered (we might want to make it configurable), or script engine has to release memory more agressively.

This might apply to JavaScript preprocessing and other places where script engine is used.

Comment by Andrejs Sitals (Inactive) [ 2024 Jan 04 ]

It looks like calling duk_gc(ctx, flags) after executing the script solves the issue - memory consumption remains low and stable, and there are no "failed" calls to es_malloc() after adding duk_gc(). Documentation states that it's worth calling duk_gc() twice.

Comment by Andrejs Sitals (Inactive) [ 2024 Jan 04 ]

In 6.0, affected processes are:

  • poller ("Script" items)
  • preprocessing worker ("JavaScript" preprocessing steps)
  • trapper (when pressing "Test" button for "Script" item; not sure about other use cases)
  • alerter
Comment by Andrejs Sitals (Inactive) [ 2024 Jan 12 ]

Available in versions:

Comment by Shane Arnold [ 2024 Jul 31 ]

Hi Team, checking to see if this made it into 7.0 LTS release and minors .1 and .2?

I have seen this behaviour since 7.0.0, currently on 7.0.1, with the preprocessing manager using large amounts of memory (including virtual).

Generated at Fri Jun 06 12:13:14 EEST 2025 using Jira 9.12.4#9120004-sha1:625303b708afdb767e17cb2838290c41888e9ff0.