[ZBX-24549] Zabbix server 6.4.12 probably bug or unefficient value cache Created: 2024 May 27  Updated: 2025 Mar 18  Resolved: 2025 Mar 03

Status: Closed
Project: ZABBIX BUGS AND ISSUES
Component/s: Server (S)
Affects Version/s: None
Fix Version/s: 7.0.9rc1, 7.2.3rc1, 7.4.0alpha1

Type: Problem report Priority: Trivial
Reporter: Artem Assignee: Vladislavs Sokurenko
Resolution: Fixed Votes: 1
Labels: None
Remaining Estimate: Not Specified
Time Spent: Not Specified
Original Estimate: Not Specified

Attachments: PNG File 1.png     PNG File 2.png     PNG File 3.png     PNG File 4.png     PNG File 5.png     PNG File 6.png     PNG File 7.png     PNG File 8.png     File ZBX-24549-7.0-final.diff     PNG File image-2024-06-06-11-01-29-977.png     PNG File image-2024-06-18-15-50-10-485.png    
Issue Links:
Duplicate
is duplicated by ZBXNEXT-5937 Date math support for elasticsearch q... Closed
Related
related to ZBX-15008 Zabbix server stops processing data Reopened
Sub-task
depends on ZBX-25777 Reduce startup load due to trigger ev... Closed
depends on ZBX-21481 Zabbix 6.0 problems with Elasticsear... Confirmed
part of ZBXNEXT-6487 Elastic product support is still expe... Open
part of ZBXNEXT-714 need scalable alternative for the his... Open
Team: Team A
Sprint: S24-W50/51/52/1, S25-W2/3, DOC S25-W2/3
Story Points: 2

 Description   

Hi. I use zabbix server 6.4.12 with HA cluster (3 nodes) with Postgresql 13.7 and Elasticsearch 7.10.2 as a history storage.  

My server config is(perfomance options)

StartDBSyncers=100
StartPollers=200
StartPreprocessors=200
StartPollersUnreachable=100
StartHistoryPollers=100
StartTrappers=500
StartPingers=100
StartDiscoverers=20
StartHTTPPollers=5
StartTimers=20
StartEscalators=70
StartAlerters=30
SNMPTrapperFile=/var/log/snmptrap/snmptrap.log
StartSNMPTrapper=1
HousekeepingFrequency=1
MaxHousekeeperDelete=10000
CacheSize=4G
HistoryCacheSize=128M
HistoryIndexCacheSize=128M
TrendCacheSize=96M
TrendFunctionCacheSize=64M
ValueCacheSize=3G


Main data server gathers from active proxies.

Server instances HW config:

58 CPU 32G RAM

Postgresql: 48 CPU 32G RAM 1.5T NVME

Elasticsearch: 48 CPU 64G RAM 1T SSD each node in 20 nodes cluster


This setup works fine until active HA node restarts. The active node changes and zabbix server starts. After that it seems like zabbix server  starts fill value cache from history storage. I check cache by runtime command diaginfo=valuecache and see that cache filling with too big amount of data for items. As far as this process going all items has a growing lag of last execution time. This occurs switching to problem state for a lot of triggers, because of nodata in items. After history loading finished, all delays are quickly released and triggers switched to recovery too. This process takes about 40-60 minutes, it's critically long time. 


About HW resources usage: I see only elasticsearch have hi usage of HW resources during this process.

For example I see in valuecache top something like this:


== value cache diagnostic information ==
Items:1656883 values:29262184 mode:0 time:0.616933
Memory:
  size: free:2132556224 used:941124992
  chunks: free:337247 used:8884246 min:24 max:2021103920
    buckets:
      24:1085
      32:67598
      40:2665
      48:32936
      56:329
      64:54257
      72:236
      80:64970
      88:232
      96:6
      112:254
      120:8
      128:22
      144:241
      152:1
      160:75
      168:4
      176:4
      192:3312
      200:9
      208:931
      216:10
      224:904
      232:20
      240:802
      248:4
      256+:106332
Top.values:
  itemid:2484077 values:14082 request.values:1
  itemid:2484074 values:14075 request.values:3
  itemid:2484067 values:14074 request.values:3
  itemid:1855764 values:14065 request.values:3
  itemid:1855767 values:14065 request.values:1
  itemid:1855757 values:14057 request.values:3
  itemid:1224231 values:11038 request.values:2
  itemid:1709840 values:11026 request.values:2
  itemid:3774916 values:10006 request.values:3
  itemid:1249227 values:9404 request.values:3
  itemid:1249220 values:9400 request.values:3
  itemid:1249230 values:9400 request.values:1
  itemid:914472 values:7388 request.values:2
  itemid:3774763 values:7358 request.values:2
  itemid:2690617 values:6737 request.values:5
  itemid:323702 values:4880 request.values:3
  itemid:3774762 values:4416 request.values:6
  itemid:1249154 values:4415 request.values:3
  itemid:1249155 values:4415 request.values:3
  itemid:2374951 values:4414 request.values:3
  itemid:3629937 values:4414 request.values:3
  itemid:2104685 values:4413 request.values:3
  itemid:2975960 values:4409 request.values:2
  itemid:1249211 values:4383 request.values:1
  itemid:2376807 values:4109 request.values:2
Top.request.values:
  itemid:2142673 values:267 request.values:241
  itemid:2142639 values:159 request.values:145
  itemid:2517005 values:103 request.values:73
  itemid:2516394 values:103 request.values:73
  itemid:2343903 values:103 request.values:73
  itemid:2517004 values:102 request.values:73
  itemid:2516393 values:102 request.values:73
  itemid:2343902 values:102 request.values:73
  itemid:318651 values:102 request.values:73
  itemid:2343262 values:100 request.values:73
  itemid:2333068 values:100 request.values:73
  itemid:318736 values:99 request.values:73
  itemid:318650 values:99 request.values:73
  itemid:354746 values:99 request.values:73
  itemid:3629366 values:98 request.values:73
  itemid:318735 values:98 request.values:73
  itemid:354745 values:98 request.values:73
  itemid:354918 values:98 request.values:73
  itemid:3629365 values:97 request.values:73
  itemid:354831 values:97 request.values:73
  itemid:2343261 values:97 request.values:73
  itemid:354917 values:97 request.values:73
  itemid:318821 values:97 request.values:73
  itemid:379123 values:97 request.values:73
  itemid:354832 values:97 request.values:73
==

Let's see this items from Top.values - (see screenshot 1)

and item and trigger config(screenshots 2-4).

Trigger requires just last 3 values, so i expected that for each item like this cache keeps 3 values, but it really it try keep 14082.

All values in Top.values have the same issue.

For example let's see one more:

itemid:3774916 values:10006 request.values:3

screenshots 5 -8.

There is the same situation: we need just 3 values but keep in cache 10006 an try fill it on server start.


 Comments   
Comment by MB [ 2024 Jun 06 ]

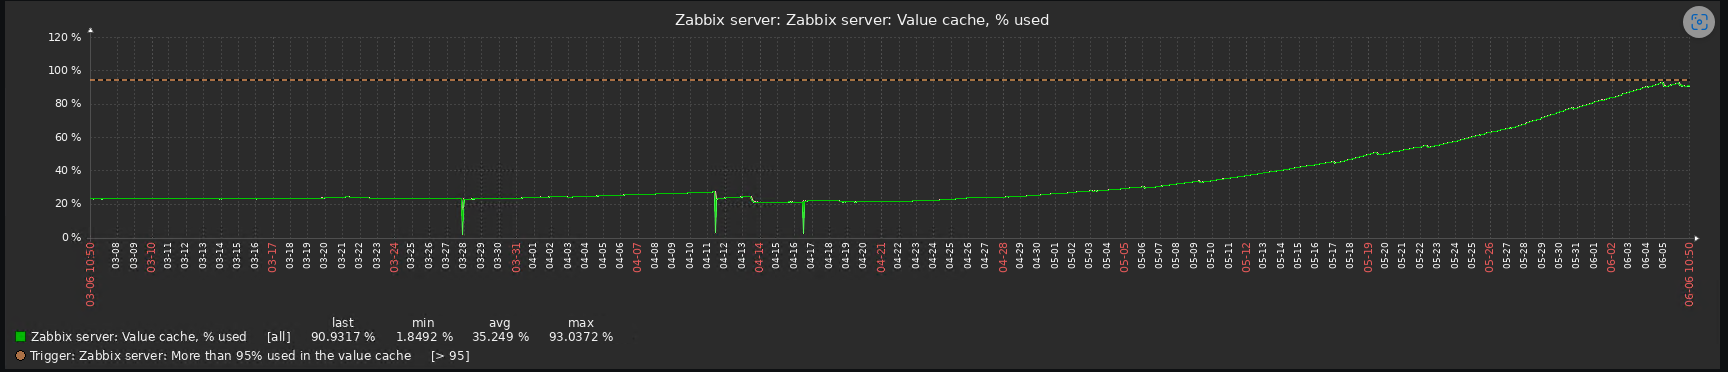
I don't know if it's related but I upgraded to 6.4.13 in April and my value cache size is increasing since then. I'll upgrade to the latest and hope it fixes the issue.

Comment by Aleksandr Khudushin [ 2024 Jun 14 ]

Same thing.
Periodically dealing with value cache exponential leaks on different Zabbix installations after one of the latest 6.4.x upgrades (can't mention the exact one).

Comment by MB [ 2024 Jun 18 ]

The bug must have been fixed. I don't see the same problem in 6.4.15.

Comment by Artem [ 2024 Jun 21 ]

Thank you for your comments. It seems the same but may be it is not. In short my problem is: when zabbix server is restarting, exactly restart procedure is fast. The problem begins after that. There is growing delay appears in items execution. For example I have the availability items (agent.ping) with interval 1 minute. I see theese items has last exec time 2, 3, 4,... 20 minutes  ago. Also theese items are coming "nodata" during this process and it occurs switching all the triggers, which has nodata in expression. It generates hundreds and thousands of alerts. Watching for server start and getting diaginfo=valuecache I''ve seen that server downloads very large datasets for for all items. All theese items used in trigger expressions with very short intervals: not longer than 20 minutes, but I've seen a thousands of downloaded values for it in valuecache. It means server downloads values for about a week, or longer. Why does it do it, if it needs just several? I think that is a reason of my problem with items execution delay.

I've tried to patch sources like that:


--- a/src/libs/zbxhistory/history_elastic.c
+++ b/src/libs/zbxhistory/history_elastic.c
@@ -645,17 +645,27 @@ static int        elastic_get_values(zbx_history_iface_t *hist, zbx_uint64_t itemid, in
 {
        zbx_elastic_data_t      *data = hist->data.elastic_data;
        size_t                  url_alloc = 0, url_offset = 0, id_alloc = 0, scroll_alloc = 0, scroll_offset = 0;
-       int                     total, empty, ret;
+       int                     total, empty, ret, new_start, range_limit;
        CURLcode                err;
        struct zbx_json         query;
        struct curl_slist       *curl_headers = NULL;
        char                    *scroll_id = NULL, *scroll_query = NULL, errbuf[CURL_ERROR_SIZE];
        CURLoption              opt;
+       range_limit = 1200;
 
        zabbix_log(LOG_LEVEL_DEBUG, "In %s()", __func__);
 
        ret = FAIL;
 
+    if (end - start > range_limit) {
+        new_start=end-range_limit;
+        zabbix_log(LOG_LEVEL_DEBUG, "[HISTSYNC] Correct time range for itemid %d: start %d --> %d.", itemid, (int)start, (int)new_start);
+        start=new_start;
+        zabbix_log(LOG_LEVEL_DEBUG, "[HISTSYNC] Elasticsearch GET itemid %d from %d to %d, count %d", itemid, (int)start, (int)end, (int)count);
+    }

With this patch I managed to decrease delay from 25-40 minutes to 9-10. This is not so good as I want too but  I still don't exactly know what are the reasons of this delay. May be the server waiting on something else or value cache is only a part of problem, but the patch is exactly reduces exec delay.

Comment by Vladislavs Sokurenko [ 2024 Dec 14 ]

Zabbix server should search in Elasticsearch instead of getting values from Elasticsearch and searching itself.

There is following request:

count(//vfs.file.regmatch[log.txt,^SUCCESS],130s)>2 

It will read all values in 130 seconds which can be many, store them in cache and search the cache, unfortunately it's not good approach for Zabbix server, it should instead provide a way to search in elasticsearch if there are such values, is it possible to test if moving such checks to http agent and queuing through elastic resolve the issue ?

Does moving from triggers to calculated items and then creating triggers to calculated items resolve issue ? As calculated items are not calculated by history syncer buy triggers are so it blocks.

How long periods are in nodata triggers ?
Currently it seems that there are trigger expressions that are slow and it’s best to identify those before proceeding with the fix.
For example trigger for itemid:2484077
Please provide new diagonfo after restart(with newer version) and expressions that use those items, if possible also enable profiling, with prof_enable command for history syncer and provide results please.

Also please see ZBX-24264

Comment by Vladislavs Sokurenko [ 2024 Dec 16 ]

Confirmed, for MySQL and PostgreSQL there are lower bounds when performing count based request, this should also be the case for Elasticsearch, check for hour first then 12 hours, day, week, month, but bounds should be limited by global history storage period.

Current example:

{
        "size": 3,
        "sort": [
                {
                        "clock": {
                                "order": "desc"
                        }
                }
        ],
        "query": {
                "bool": {
                        "must": [
                                {
                                        "match": {
                                                "itemid": 48297
                                        }
                                }
                        ],
                        "filter": [
                                {
                                        "range": {
                                                "clock": {
                                                        "lte": 1734348380
                                                }
                                        }
                                }
                        ]
                }
        }
}

Expected:

{
        "size": 3,
        "sort": [
                {
                        "clock": {
                                "order": "desc"
                        }
                }
        ],
        "query": {
                "bool": {
                        "must": [
                                {
                                        "match": {
                                                "itemid": 48297
                                        }
                                }
                        ],
                        "filter": [
                                {
                                        "range": {
                                                "clock": {
                                                        "gte": 17343480200,
                                                        "lte": 17343483800
                                                }
                                        }
                                }
                        ]
                }
        }
}
Comment by Artem [ 2024 Dec 16 ]

Thanks for your response. So let me explain in order.
Have I understood your explanations correctly?
1. LOG item must be replaced by http agent item, that works directly with Elasticsearch because this type of items can provide unexpected amount of data?

2. Triggers with the expressions kind of as in my example are processing by history syncer and that is the cause of performance issues? Those triggers must be replaced by calculated item and triggers with simple expression?

3. Triggers with nodata items has a periods, that not higher than 20 minutes. Also during last several months I've updated to server version 7.0.1 and it has the same behavior.

4. Trigger expression for itemid:2484077 is

last(/host_xxx/vfs.file.exists[{$MAILBOX}],#3)=1 and last(/host_xxx/vfs.file.size[{$MAILBOX}],#3)>0 and (now()-last(/host_xxx/vfs.file.time[{$MAILBOX}]))<604799 

I have a lot of this kind of triggers. On the next server update(to last 7.0.x version) I'll try to gather debug info you requested.

5. Are you confirm the issue with Elasticsearch query bounds in history requests? Is the global history storage period works as when the history is in the Elasticsearch?

Comment by Vladislavs Sokurenko [ 2024 Dec 16 ]

Yes, I confirm the same that you have mentioned in comment with a patch, we will get back to you when a solution is implemented, we will very much appreciate if you will try it and confirm if this improvement helps or resolves the issue.

Comment by Artem [ 2024 Dec 16 ]

Thank you! Ill wait for news and update to version with patch and check this

Comment by Vladislavs Sokurenko [ 2024 Dec 17 ]

Fixed in pull request feature/ZBX-24549-7.0-2

Comment by Vladislavs Sokurenko [ 2024 Dec 17 ]

(1) [D] When Elasticsearch is used then range queries when retrieving values from database will be limited by timestamp of data storage period.

Comment by Vladislavs Sokurenko [ 2024 Dec 17 ]

(2) [D] LogSlowQueries can be used to check slow queries to Elasticsearch database

Comment by Vladislavs Sokurenko [ 2024 Dec 17 ]

If there is test instance then please try running with ZBX-24549-7.0-final.diff please see if there are slow query reported in log, controlled by LogSlowQueries configuration parameter.

Comment by Vladislavs Sokurenko [ 2024 Dec 20 ]

Also please see ZBX-25777 and ZBX-21481

Comment by Vladislavs Sokurenko [ 2025 Jan 13 ]

Fixed in:

Comment by Jaroslav [ 2025 Feb 07 ]

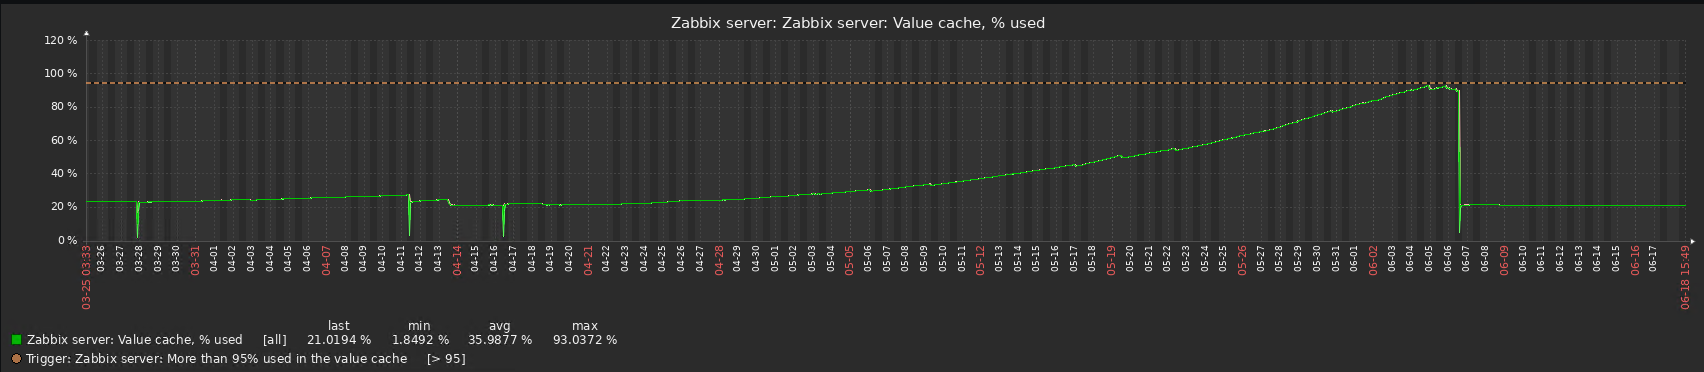
https://www.reddit.com/r/zabbix/comments/1ie5zcb/zabbix_value_cache_under_70/

after installing version 7.0.9 there is a problem with memory leak in the cache. maybe it's related to this topic.

Comment by Vladislavs Sokurenko [ 2025 Feb 18 ]

Was it possible to check if latest version resolve issues artem.kh ?

Comment by Andrii Fediuk [ 2025 Feb 21 ]

Updated documentation:

  • Elasticsearch setup: 7.0, 7.2, 7.4 (added troubleshooting step with LogSlowQueries and note about range queries).
Generated at Sun Apr 20 21:13:25 EEST 2025 using Jira 9.12.4#9120004-sha1:625303b708afdb767e17cb2838290c41888e9ff0.