|
Causes |
|||
| caused by |
|
Faster action execution on Server | Closed |
|
Duplicate |
|||

[ZBX-24712] Possible memory leak in zabbix_server process Created: 2024 Jun 24 Updated: 2025 Mar 16 Resolved: 2024 Jul 07 |
|
| Status: | Closed |
| Project: | ZABBIX BUGS AND ISSUES |
| Component/s: | Proxy (P), Server (S) |
| Affects Version/s: | 7.0.0 |
| Fix Version/s: | 7.0.1rc1, 7.2.0alpha1 |
| Type: | Problem report | Priority: | Major |
| Reporter: | Gáncs Krisztián | Assignee: | Vladislavs Sokurenko |
| Resolution: | Fixed | Votes: | 10 |
| Labels: | None | ||
| Remaining Estimate: | 0h | ||
| Time Spent: | 32h | ||
| Original Estimate: | Not Specified | ||
| Environment: |
Ubuntu 22.04, Zabbix 7.0.0 from zabbix repo |
||
| Attachments: |
|
||||||||||||
| Issue Links: |
|
||||||||||||
| Team: | |
||||||||||||
| Sprint: | S24-W26/27 | ||||||||||||
| Story Points: | 1 | ||||||||||||
| Description |
|
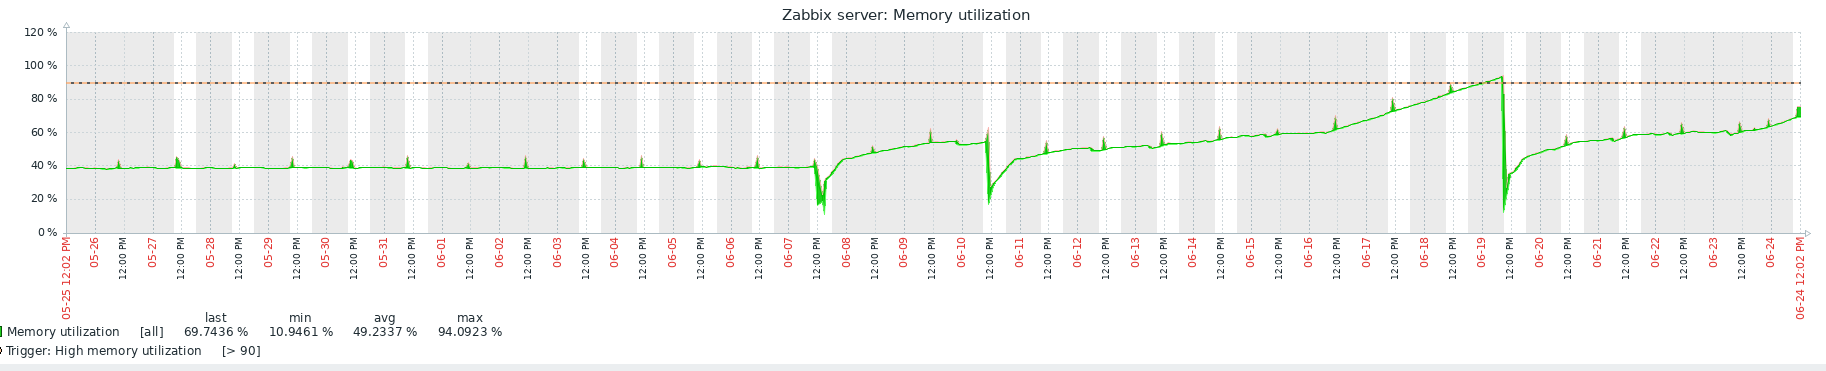
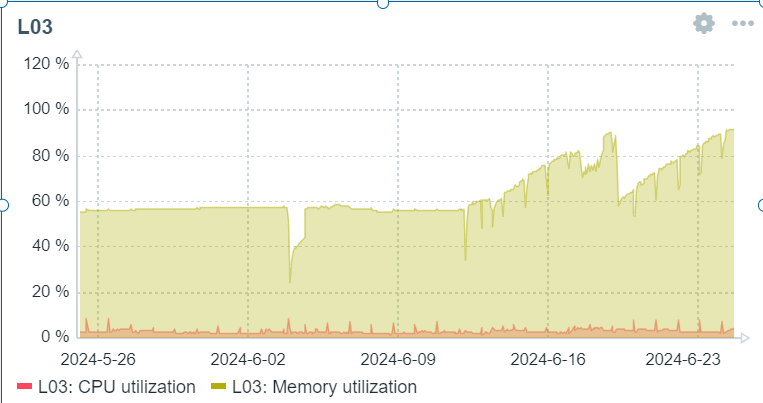
Hello! We have been using Zabbix for the past 1.5 years where memory usage had been constant. On 06.07. we have upgraded to Zabbix 7 and we also migrated our Postgres to version 16. After the update the configuration of Zabbix was retained, only modifications were to enable the async pollers. Templates were updated to the lastest version (mostly Linux by agent, Mikrotik by SNMP are used). On the 19th we have noticed that zabbix was consuming high amounts of memory and was restarted, which made it return to normal levels.
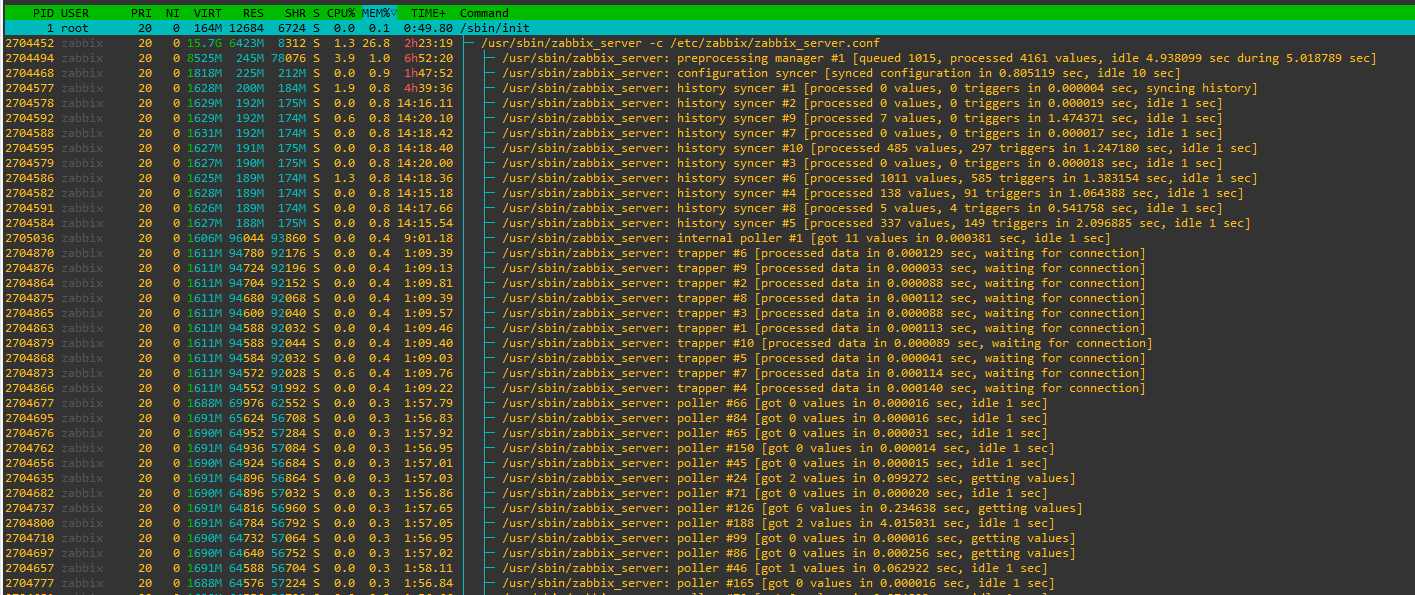
Observing memory of the zabbix_server master process it is obvious it is constantly increasing. The other zabbix processes are non-issue only the master process seem to own this memory as "private".
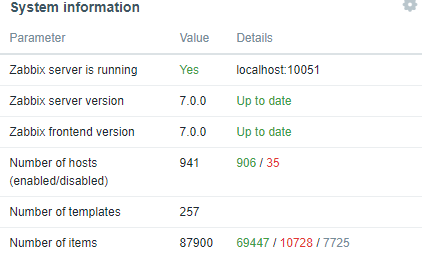
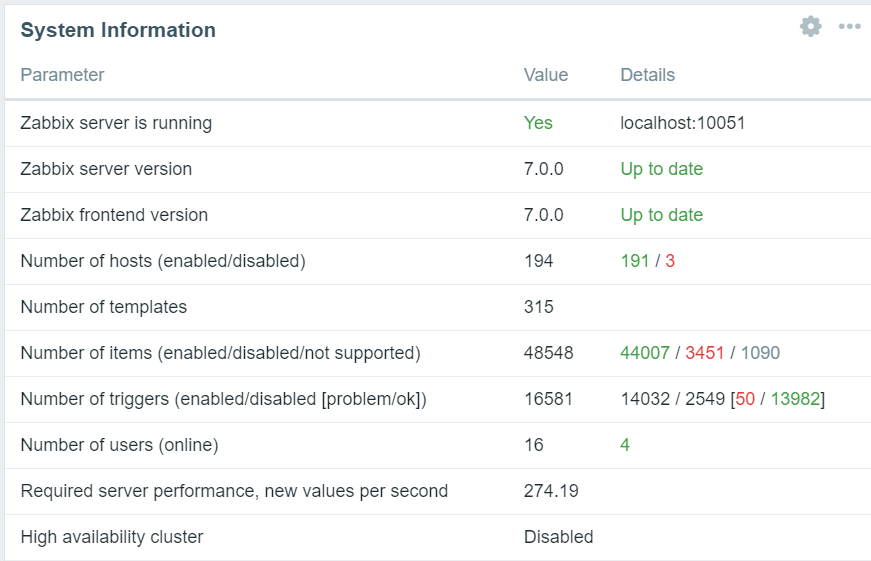
Zabbix info
No HA, no proxies, DB and zabbix_server co-located on same server with 24gb total memory. Result: zabbix_server master process consumes more and more memory. Expected: |
| Comments |
| Comment by Ruslan Aznabaev [ 2024 Jun 24 ] |
|
Yep, it leaks.
|
| Comment by Santiago [ 2024 Jun 25 ] |
|
Same issue here, zabbix_server is increasing memory usage constantly since upgraded to Zabbix 7. Server:
|
| Comment by Edgar Akhmetshin [ 2024 Jun 25 ] |
|
Hello Gáncs, Which process type consumes memory over time more? Preprocessing manager? Execute this with 2 hours interval (or more to see memory increase): ps -eo size,pid,user,command --sort -size | \
awk '{ hr=$1/1024 ; printf("%13.2f Mb ",hr) } { for ( x=4 ; x<=NF ; x++ ) { printf("%s ",$x) } print "" }' |\
cut -d "" -f2 | cut -d "-" -f1
Find which process consumes more memory over time and create script file in some directory: dump-all-memory-of-pid.sh #!/bin/bash grep rw-p /proc/$1/maps \ | sed -n 's/^\([0-9a-f]*\)-\([0-9a-f]*\) .*$/\1 \2/p' \ | while read start stop; do \ gdb --batch --pid $1 -ex \ "dump memory $1-$start-$stop.dump 0x$start 0x$stop"; \ done Give execute permissions: chmod +x ./dump-all-memory-of-pid.sh Execute with affected process <pid>: ./dump-all-memory-of-pid.sh <pid> It will dump everything from the memory. After inside created directory you will have .dump files, example: [root@dante]# ls -la *.dump -rw-r--r--. 1 root root 4096 Mar 26 18:48 690-aaaac6db0000-aaaac6db1000.dump -rw-r--r--. 1 root root 4096 Mar 26 18:48 690-aaaac6db1000-aaaac6db2000.dump -rw-r--r--. 1 root root 135168 Mar 26 18:48 690-aaaae20c0000-aaaae20e1000.dump -rw-r--r--. 1 root root 147456 Mar 26 18:48 690-aaaae20e1000-aaaae2105000.dump -rw-r--r--. 1 root root 135168 Mar 26 18:48 690-ffff7c000000-ffff7c021000.dump -rw-r--r--. 1 root root 4096 Mar 26 18:48 690-ffff8011a000-ffff8011b000.dump -rw-r--r--. 1 root root 4096 Mar 26 18:48 690-ffff8015b000-ffff8015c000.dump -rw-r--r--. 1 root root 8388608 Mar 26 18:48 690-ffff8016c000-ffff8096c000.dump -rw-r--r--. 1 root root 4096 Mar 26 18:48 690-ffff8098c000-ffff8098d000.dump Archive/Compress this directory. Collect dumps twice in different directories for 2 hour interval (or more) to catch difference. Provide 2 full dumps. Regards,
|
| Comment by Gáncs Krisztián [ 2024 Jun 25 ] |
|
Thanks for your answer Edgar!
Here is the output of the first command showing memory increase of 310MB/2h: # at 11:13 today ps -eo size,pid,user,command --sort -size SIZE PID USER COMMAND 2555648 4179317 zabbix /usr/sbin/zabbix_server -c /etc/zabbix/zabbix_server.conf 1175468 4179383 zabbix /usr/sbin/zabbix_server: preprocessing manager #1 [queued 933, processed 3732 values, idle 4.957487 sec during 5.013799 sec] 223044 1287 root /usr/lib/snapd/snapd 208124 1372 zabbix /usr/sbin/zabbix_agent2 -c /etc/zabbix/zabbix_agent2.conf 207224 4179333 zabbix /usr/sbin/zabbix_server: configuration syncer [synced configuration in 0.237075 sec, idle 10 sec] 202188 1781 root /var/ossec/bin/wazuh-modulesd 185112 4204 zabbix /usr/sbin/zabbix-agent2-plugin/zabbix-agent2-plugin-postgresql /run/zabbix/agent.plugin.sock false 166456 2452 gdm /usr/bin/gnome-shell 103068 4179848 zabbix /usr/sbin/zabbix_server: http agent poller #2 [got 0 values, queued 0 in 5 sec] 102716 4179851 zabbix /usr/sbin/zabbix_server: http agent poller #4 [got 0 values, queued 0 in 5 sec] # at 13:15 today ps -eo size,pid,user,command --sort -size SIZE PID USER COMMAND 2873936 4179317 zabbix /usr/sbin/zabbix_server -c /etc/zabbix/zabbix_server.conf 1185808 4179383 zabbix /usr/sbin/zabbix_server: preprocessing manager #1 [queued 927, processed 3703 values, idle 4.954932 sec during 5.004672 sec] 223044 1287 root /usr/lib/snapd/snapd 208124 1372 zabbix /usr/sbin/zabbix_agent2 -c /etc/zabbix/zabbix_agent2.conf 207224 4179333 zabbix /usr/sbin/zabbix_server: configuration syncer [synced configuration in 0.377315 sec, idle 10 sec] 202188 1781 root /var/ossec/bin/wazuh-modulesd 185112 4204 zabbix /usr/sbin/zabbix-agent2-plugin/zabbix-agent2-plugin-postgresql /run/zabbix/agent.plugin.sock false 166456 2452 gdm /usr/bin/gnome-shell 103068 4179848 zabbix /usr/sbin/zabbix_server: http agent poller #2 [got 4 values, queued 4 in 5 sec] 102716 4179851 zabbix /usr/sbin/zabbix_server: http agent poller #4 [got 0 values, queued 0 in 5 sec]
About the memory dumps: I have talked with higher-ups and they said no, as it would expose company-internals/client data, and as such would be against company policy. I have the dumps locally if there is a way I could get the data you need from them, then I'm happy to dig in, but in it's current state unable to upload them. Edit: after 2 more hours SIZE PID USER COMMAND 2892416 4179317 zabbix /usr/sbin/zabbix_server -c /etc/zabbix/zabbix_server.conf 1358984 4179383 zabbix /usr/sbin/zabbix_server: preprocessing manager #1 [queued 937, processed 3993 values, idle 4.987613 sec during 5.029758 sec] 223044 1287 root /usr/lib/snapd/snapd 208124 1372 zabbix /usr/sbin/zabbix_agent2 -c /etc/zabbix/zabbix_agent2.conf 207224 4179333 zabbix /usr/sbin/zabbix_server: configuration syncer [synced configuration in 0.340007 sec, idle 10 sec] 202188 1781 root /var/ossec/bin/wazuh-modulesd 185112 4204 zabbix /usr/sbin/zabbix-agent2-plugin/zabbix-agent2-plugin-postgresql /run/zabbix/agent.plugin.sock false 166456 2452 gdm /usr/bin/gnome-shell 103068 4179848 zabbix /usr/sbin/zabbix_server: http agent poller #2 [got 2 values, queued 2 in 5 sec] 102716 4179851 zabbix /usr/sbin/zabbix_server: http agent poller #4 [got 0 values, queued 0 in 5 sec] Now only the preprocessing manager grew significantly. Will check on it in 2 more hours and see, made a dump of it. Edit: 3h passed, seems to be preprocessing manager be the one growing now SIZE PID USER COMMAND 2892416 4179317 zabbix /usr/sbin/zabbix_server -c /etc/zabbix/zabbix_server.conf 1637824 4179383 zabbix /usr/sbin/zabbix_server: preprocessing manager #1 [queued 1122, processed 4730 values, idle 4.951454 sec during 5.000069 sec] 223044 1287 root /usr/lib/snapd/snapd 208124 1372 zabbix /usr/sbin/zabbix_agent2 -c /etc/zabbix/zabbix_agent2.conf 207224 4179333 zabbix /usr/sbin/zabbix_server: configuration syncer [synced configuration in 0.348891 sec, idle 10 sec] 202188 1781 root /var/ossec/bin/wazuh-modulesd 185112 4204 zabbix /usr/sbin/zabbix-agent2-plugin/zabbix-agent2-plugin-postgresql /run/zabbix/agent.plugin.sock false 166456 2452 gdm /usr/bin/gnome-shell 103068 4179848 zabbix /usr/sbin/zabbix_server: http agent poller #2 [got 0 values, queued 0 in 5 sec] 102716 4179851 zabbix /usr/sbin/zabbix_server: http agent poller #4 [got 2 values, queued 2 in 5 sec] Tomorrow I'll restart the zabbix_server and redo the tests. Edit: before restart after quite a lot of hours SIZE PID USER COMMAND 2973508 4179383 zabbix /usr/sbin/zabbix_server: preprocessing manager #1 [queued 978, processed 5023 values, idle 4.956315 sec during 5.001194 sec] 2892416 4179317 zabbix /usr/sbin/zabbix_server -c /etc/zabbix/zabbix_server.conf 223044 1287 root /usr/lib/snapd/snapd 208124 1372 zabbix /usr/sbin/zabbix_agent2 -c /etc/zabbix/zabbix_agent2.conf 207224 4179333 zabbix /usr/sbin/zabbix_server: configuration syncer [synced configuration in 0.288586 sec, idle 10 sec] 202644 1781 root /var/ossec/bin/wazuh-modulesd 185112 4204 zabbix /usr/sbin/zabbix-agent2-plugin/zabbix-agent2-plugin-postgresql /run/zabbix/agent.plugin.sock false 166456 2452 gdm /usr/bin/gnome-shell 103068 4179848 zabbix /usr/sbin/zabbix_server: http agent poller #2 [got 0 values, queued 0 in 5 sec] |
| Comment by ihopealliswell [ 2024 Jun 26 ] |
|
I've had the same problem since I upgraded to zabbix7, which caused me to have to reboot once a day. |
| Comment by Edgar Akhmetshin [ 2024 Jun 26 ] |
|
Please provide dumps and logs as requested. Just a message like: "I've had the same problem since I upgraded to zabbix7, which caused me to have to reboot once a day." will not help to find the root cause quickly. |
| Comment by Milan [ 2024 Jun 26 ] |
|
I have the same problem on Ubuntu 24.04 with Mysql and Gentoo with Postgresql after the update from 7.0-RC1, which did not have this problem. |
| Comment by Andris Zeila [ 2024 Jun 26 ] |
|
Could you check the main process cpu usage in such scenario ? |
| Comment by Jack Cheng [ 2024 Jun 26 ] |
|
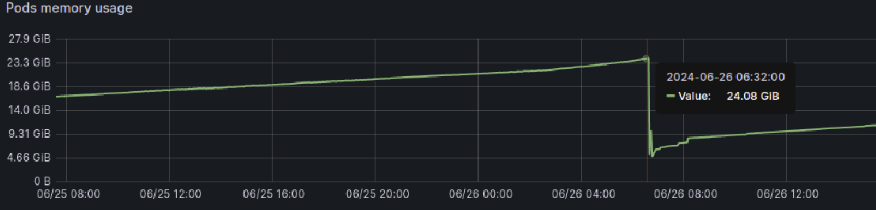
Same issue here ,but we have this problem since zabbix 6.4 . Zabbix server pod memory usage reaches limit and terminated by Kubernetes. Server : Ubuntu 20.04 (5.4.0-124-generic) Kubernetes: v1.22.0 Postgres: 14 Timescaledb: 2.8 / 2.14.2 Zabbix: 6.4 ~ 7.0
|
| Comment by Edgar Akhmetshin [ 2024 Jun 26 ] |
|
Hello All with "I have the same...", please collect helpful information and share with us, this will help us to find the root cause faster, currently we are not able to reproduce the issue, since every environment is different. Which process type consumes memory over time more? Preprocessing manager? Execute this with 2 hours interval (or more to see memory increase): ps -eo size,pid,user,command --sort -size | \
awk '{ hr=$1/1024 ; printf("%13.2f Mb ",hr) } { for ( x=4 ; x<=NF ; x++ ) { printf("%s ",$x) } print "" }' |\
cut -d "" -f2 | cut -d "-" -f1
ps aux | sort -nrk 3,3 | head -n 10
Find which process consumes more memory over time and create script file in some directory: dump-all-memory-of-pid.sh #!/bin/bash grep rw-p /proc/$1/maps \ | sed -n 's/^\([0-9a-f]*\)-\([0-9a-f]*\) .*$/\1 \2/p' \ | while read start stop; do \ gdb --batch --pid $1 -ex \ "dump memory $1-$start-$stop.dump 0x$start 0x$stop"; \ done Give execute permissions: chmod +x ./dump-all-memory-of-pid.sh Execute with affected process <pid>: ./dump-all-memory-of-pid.sh <pid> It will dump everything from the memory. After inside created directory you will have .dump files, example: [root@dante]# ls -la *.dump -rw-r--r--. 1 root root 4096 Mar 26 18:48 690-aaaac6db0000-aaaac6db1000.dump -rw-r--r--. 1 root root 4096 Mar 26 18:48 690-aaaac6db1000-aaaac6db2000.dump -rw-r--r--. 1 root root 135168 Mar 26 18:48 690-aaaae20c0000-aaaae20e1000.dump -rw-r--r--. 1 root root 147456 Mar 26 18:48 690-aaaae20e1000-aaaae2105000.dump -rw-r--r--. 1 root root 135168 Mar 26 18:48 690-ffff7c000000-ffff7c021000.dump -rw-r--r--. 1 root root 4096 Mar 26 18:48 690-ffff8011a000-ffff8011b000.dump -rw-r--r--. 1 root root 4096 Mar 26 18:48 690-ffff8015b000-ffff8015c000.dump -rw-r--r--. 1 root root 8388608 Mar 26 18:48 690-ffff8016c000-ffff8096c000.dump -rw-r--r--. 1 root root 4096 Mar 26 18:48 690-ffff8098c000-ffff8098d000.dump Archive/Compress this directory. Collect dumps twice in different directories for 2 hour interval (or more) to catch difference. Provide 2 full dumps. Regards, |
| Comment by ihopealliswell [ 2024 Jun 27 ] |
|
I came to the same conclusion as kriszdev , apparently there was a memory leak in the process called preprocessing manager. I have collected dumpfiles with an interval of 2 hours, please download them through the link. |
| Comment by Ruslan Aznabaev [ 2024 Jun 27 ] |
|
Yep, preprocessing manager is leaking even on fresh Zabbix 7 install with 1 host. |
| Comment by Vladislavs Sokurenko [ 2024 Jul 01 ] |
|
If possible, please provide output of: |
| Comment by Ruslan Aznabaev [ 2024 Jul 01 ] |
|
Prod zabbix-server: == preprocessing diagnostic information == Cached items:96054 pending tasks:0 finished tasks:0 task sequences:0 time:0.000326 Top.sequences: == Test zabbix-server: == preprocessing diagnostic information == Cached items:393 pending tasks:0 finished tasks:0 task sequences:0 time:0.000430 Top.sequences: == One of prod zabbix-proxy: == preprocessing diagnostic information == Cached items:165047 pending tasks:0 finished tasks:0 task sequences:0 time:0.000263 Top.sequences: == |
| Comment by Ruslan Aznabaev [ 2024 Jul 01 ] |
|
Okay, I compiled zabbix-server with this patch: zabbix_server (Zabbix) 7.0.0 Revision 49955f1fb5c 3 June 2024, compilation time: Jul 1 2024 18:19:20 Before restart: 5558.49 Mb jre/jdk8u312 2179.31 Mb /usr/sbin/zabbix_server: preprocessing manager #1 [queued 6, processed 1174 values, idle 4.999330 sec during 5.020922 sec] 671.55 Mb /usr/sbin/zabbix_server 313.36 Mb /home/telegram/bot/telegram 305.80 Mb /usr/share/grafana/bin/grafana server 234.92 Mb /usr/bin/node 215.13 Mb /usr/sbin/zabbix_agent2 196.71 Mb /home/actions 185.36 Mb /usr/local/bin/telegram Preprocessing manager reached 2+GB of RAM in 4 days. So... we need to wait. |
| Comment by Ruslan Aznabaev [ 2024 Jul 01 ] |
|
After 3 hours - 43.59 Mb. I think, it's fixed now. |
| Comment by Vladislavs Sokurenko [ 2024 Jul 01 ] |
|
Thank you for testing patch, that was quick, that should be the reason then and will be fixed. |
| Comment by Ruslan Aznabaev [ 2024 Jul 02 ] |
|
Yes, now it's perfect.
        48.76 Mb /usr/sbin/zabbix_server: agent poller #1 [got 0 values, queued 0 in 5 sec]
        43.65 Mb /usr/sbin/zabbix_server: preprocessing manager #1 [queued 8, processed 1299 values, idle 5.000624 sec during 5.009300 sec]
        43.46 Mb /usr/sbin/zabbix_server: discovery manager #1 [processing 0 rules, 0 unsaved checks]
        29.46 Mb /usr/sbin/zabbix_server: http agent poller #1 [got 0 values, queued 0 in 5 sec]
        29.46 Mb /usr/sbin/zabbix_server: snmp poller #1 [got 0 values, queued 0 in 5 sec]
        21.48 Mb /usr/sbin/zabbix_server
        20.30 Mb /usr/sbin/zabbix_server: history syncer #1 [processed 0 values, 0 triggers in 0.000007 sec, idle 1 sec]
        20.18 Mb /usr/sbin/zabbix_server: history syncer #4 [processed 0 values, 0 triggers in 0.000026 sec, idle 1 sec]
        20.15 Mb /usr/sbin/zabbix_server: history syncer #2 [processed 0 values, 0 triggers in 0.000027 sec, idle 1 sec]
        20.14 Mb /usr/sbin/zabbix_server: history syncer #3 [processed 0 values, 0 triggers in 0.000022 sec, idle 1 sec]
        16.00 Mb /usr/sbin/zabbix_server: configuration syncer [synced configuration in 0.031718 sec, idle 10 sec]
        10.95 Mb /usr/sbin/zabbix_server: proxy group manager #1 started
         9.11 Mb /usr/sbin/zabbix_server: trapper #4 [processed data in 0.045683 sec, waiting for connection]
         8.95 Mb /usr/sbin/zabbix_server: trapper #2 [processed data in 0.000079 sec, waiting for connection]
         8.07 Mb /usr/sbin/zabbix_server: trapper #1 [processed data in 0.050985 sec, waiting for connection]
         8.06 Mb /usr/sbin/zabbix_server: trapper #3 [processed data in 0.000115 sec, waiting for connection]
         7.84 Mb /usr/sbin/zabbix_server: trapper #5 [processed data in 0.000097 sec, waiting for connection]
         5.16 Mb /usr/sbin/zabbix_server: lld manager #1 [processed 86 LLD rules, idle 5.743082sec during 5.744561 sec]
         3.76 Mb /usr/sbin/zabbix_server: lld worker #1 [processed 99 LLD rules, idle 8.763374 sec during 9.439606 sec]
         3.40 Mb /usr/sbin/zabbix_server: lld worker #2 [processed 1 LLD rules, idle 7.429412 sec during 7.437543 sec]
|
| Comment by Volodymyr Mazur [ 2024 Jul 03 ] |
|
The same issue with memory leak (preprocessing manager) with Zabbix 7.0.0 (revision 49955f1fb5c) installed via package from official zabbix repo on OracleLinux 9 head /var/log/zabbix/zabbix_server.log-20240630
21105:20240625:105123.580 Starting Zabbix Server. Zabbix 7.0.0 (revision 49955f1fb5c).
21105:20240625:105123.580 ****** Enabled features ******
21105:20240625:105123.580 SNMP monitoring: YES
...
zabbix_server -R diaginfo="preprocessing"
zabbix_server: /usr/pgsql-16/lib/libpq.so.5: no version information available (required by zabbix_server)
== preprocessing diagnostic information ==
Cached items:59073 pending tasks:0 finished tasks:0 task sequences:0 time:0.000387
Top.sequences:
==
ps -eo size,pid,user,command --sort -size | \
awk '\{ hr=$1/1024 ; printf("%13.2f Mb ",hr) } \{ for ( x=4 ; x<=NF ; x++ ) { printf("%s ",$x) } print "" }' |\
cut -d "" -f2 | cut -d "-" -f1
0.00 Mb COMMAND
3610.39 Mb /usr/sbin/zabbix_server: preprocessing manager #1 [queued 1676, processed 1631 values, idle 4.985376 sec during 5.006168 sec]
190.65 Mb /usr/sbin/zabbix_server: configuration syncer [synced configuration in 0.256261 sec, syncing configuration]
166.54 Mb /usr/sbin/zabbix_server: discovery manager #1 [processing 0 rules, 0 unsaved checks]
106.21 Mb /usr/sbin/zabbix_server: poller #138 [got 0 values in 0.000053 sec, idle 1 sec]
...
systemctl status zabbix-server
● zabbix-server.service - Zabbix Server
Loaded: loaded (/etc/systemd/system/zabbix-server.service; enabled; preset: disabled)
Active: active (running) since Wed 2024-07-03 10:53:28 EEST; 10h ago
Process: 1120 ExecStart=/usr/sbin/zabbix_server -c $CONFFILE (code=exited, status=0/SUCCESS)
Main PID: 1129 (zabbix_server)
Tasks: 726 (limit: 617655)
Memory: 41.4G
CPU: 3h 12min 30.484s
CGroup: /system.slice/zabbix-server.service
├─1129 /usr/sbin/zabbix_server -c /etc/zabbix/zabbix_server.conf
...
|
| Comment by Dan Sheppard [ 2024 Jul 05 ] |
|
I am seeing this same behaviour in the zabbix_proxy.
Befor I spend some time compiling this on the proxies, does the patch impact the proxy pre-processor? |
| Comment by Vladislavs Sokurenko [ 2024 Jul 05 ] |
|
Proxy is also affected and is fixed in feature/ZBX-24712-7.1 |
| Comment by Vladislavs Sokurenko [ 2024 Jul 05 ] |
|
Fixed in:
|
| Comment by Vladislavs Sokurenko [ 2024 Nov 28 ] |
|
Please also try ZBXNEXT-9625 if possible |