[ZBX-24870] Continuous increase in proxy memory usage Created: 2024 Jul 17  Updated: 2024 Jul 18

Status: Open
Project: ZABBIX BUGS AND ISSUES
Component/s: Proxy (P)
Affects Version/s: None
Fix Version/s: None

Type: Problem report Priority: Trivial
Reporter: jh Assignee: Oleksii Zagorskyi
Resolution: Unresolved Votes: 0
Labels: None
Remaining Estimate: Not Specified
Time Spent: Not Specified
Original Estimate: Not Specified

Attachments: PNG File image-2024-07-17-14-22-33-668.png    

 Description   

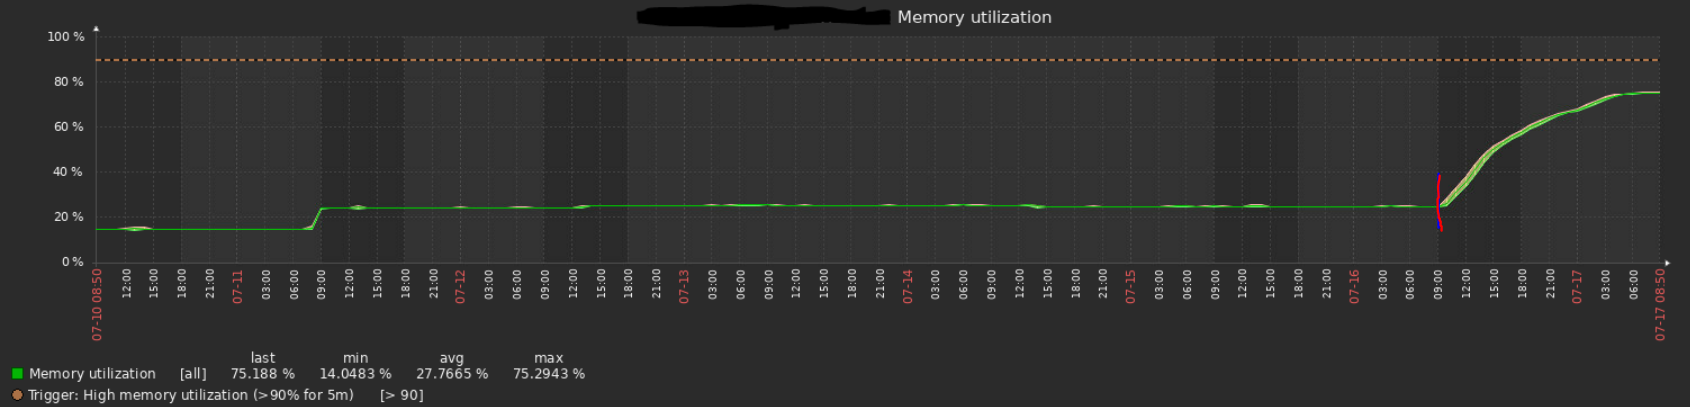
I have noticed continuous memory usage growth in proxy pollers when using 'Veeam Backup Enterprise Manager by HTTP' template. After removing templates memory usage is not decreasing and you need to restart proxy service. Seems like it is only happening when veeam manager api query is not working or causing timeout.


I have similar test environment with same zabbix version and there everything seems to work OK.

Tested with proxy 6.0.30, ubuntu 20.04 / 8GB RAM


Steps to reproduce:

  1. Add hosts with 'Veeam Backup Enterprise Manager by HTTP' template.
  2. item: Veeam Manager: Get errors
        Error: cannot get URL: Timeout was reached.
        Error: script execution timeout occurred.

Result:

Before adding hosts and veeam template
USER         PID %CPU %MEM    VSZ   RSS TTY      STAT START   TIME COMMAND
zabbix     81025  0.0  0.2 1731528 22236 ?       S    Jul05   0:42 /usr/sbin/zabbix_proxy: poller #28 [got 0 values in 0.000020 sec, idle 1 sec]
zabbix     81035  0.0  0.2 1731532 22224 ?       S    Jul05   0:41 /usr/sbin/zabbix_proxy: poller #38 [got 0 values in 0.000008 sec, idle 1 sec]
zabbix     80994  0.0  0.2 1731520 22212 ?       S    Jul05   0:40 /usr/sbin/zabbix_proxy: poller #3 [got 0 values in 0.000021 sec, idle 1 sec]
zabbix     81026  0.0  0.2 1731676 22208 ?       S    Jul05   0:40 /usr/sbin/zabbix_proxy: poller #29 [got 0 values in 0.000010 sec, idle 1 sec]
zabbix     81028  0.0  0.2 1731676 22208 ?       S    Jul05   0:43 /usr/sbin/zabbix_proxy: poller #31 [got 0 values in 0.000010 sec, idle 1 sec]
*SNIP


After sometime (in this case 20 hours):
USER         PID %CPU %MEM    VSZ   RSS TTY      STAT START   TIME COMMAND
zabbix     80999  0.0  1.2 1815884 103664 ?      S    Jul05   1:04 /usr/sbin/zabbix_proxy: poller #7 [got 0 values in 0.000006 sec, idle 5 sec]
zabbix     81056  0.0  1.1 1802472 90156 ?       S    Jul05   1:11 /usr/sbin/zabbix_proxy: poller #59 [got 0 values in 0.000024 sec, idle 5 sec]
zabbix     81005  0.0  1.1 1801764 89816 ?       S    Jul05   1:12 /usr/sbin/zabbix_proxy: poller #13 [got 0 values in 0.000033 sec, idle 5 sec]
zabbix     81035  0.0  1.1 1801728 89732 ?       S    Jul05   1:06 /usr/sbin/zabbix_proxy: poller #38 [got 0 values in 0.000020 sec, idle 5 sec]

*SNIP


Generated at Fri Apr 11 18:53:17 EEST 2025 using Jira 9.12.4#9120004-sha1:625303b708afdb767e17cb2838290c41888e9ff0.