|
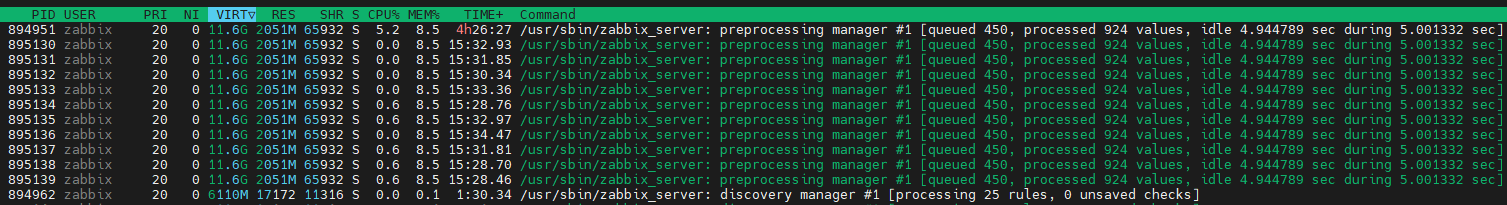
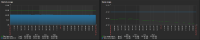
Note: as a troubleshooting step, I have increased number of preprocessors to 10. I noticed when looking at the running processes that each of the existing preprocessing threads had about 500 values queued at any given time.
It is also noted that when monitoring slab usage with slabtop -s c, a high amount of radix_tree_node allocation is present, which is also released when restarting or terminating zabbix_server (and as a result the preprocessing manager).
|
|
Zabbix doesn't directly control the use of virtual memory. That is managed by the operating system. How much available memory do you have on your system?
Many Zabbix processes have own caches, and it's normal for memory consumption to increase for some time after the server starts.
|
|
Thanks sasha, see below.
RAM: 16GB
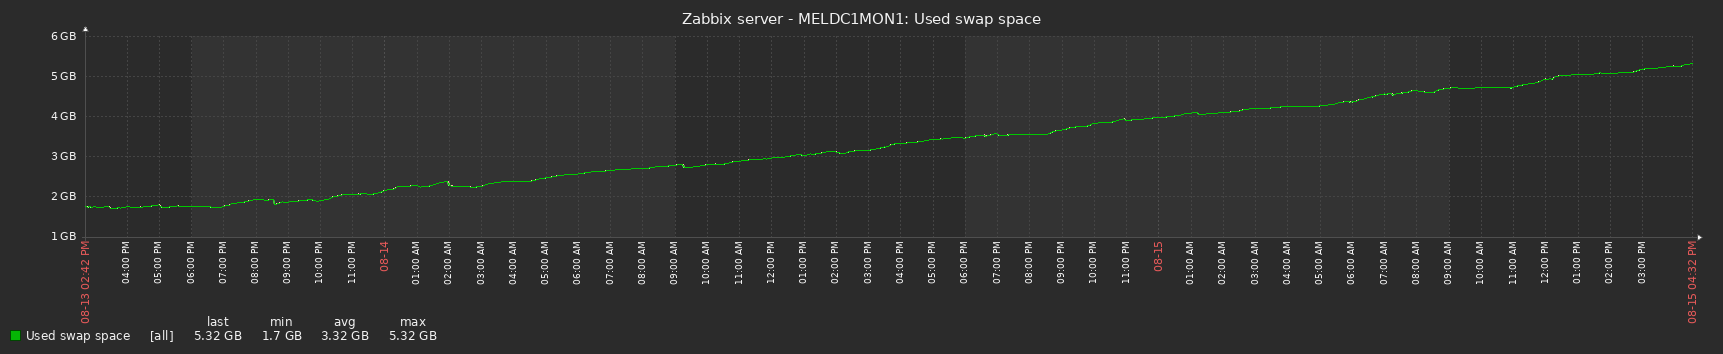
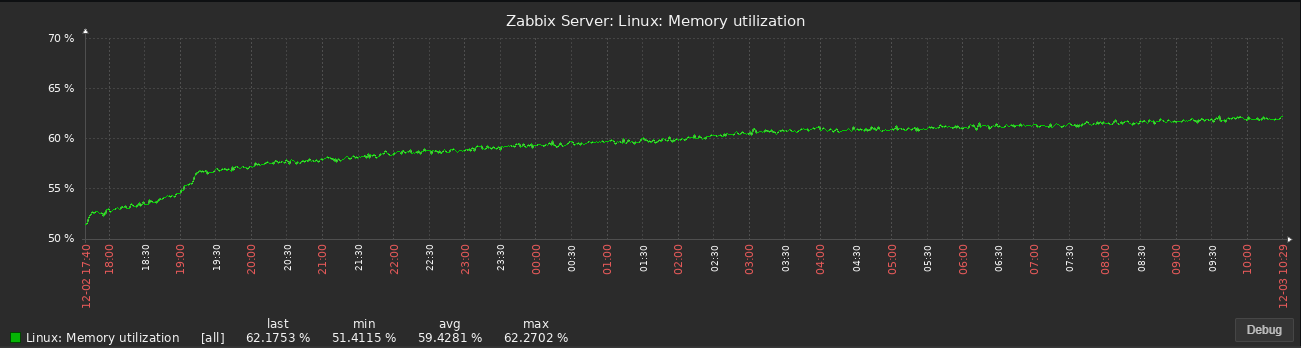
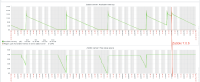
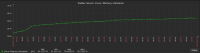
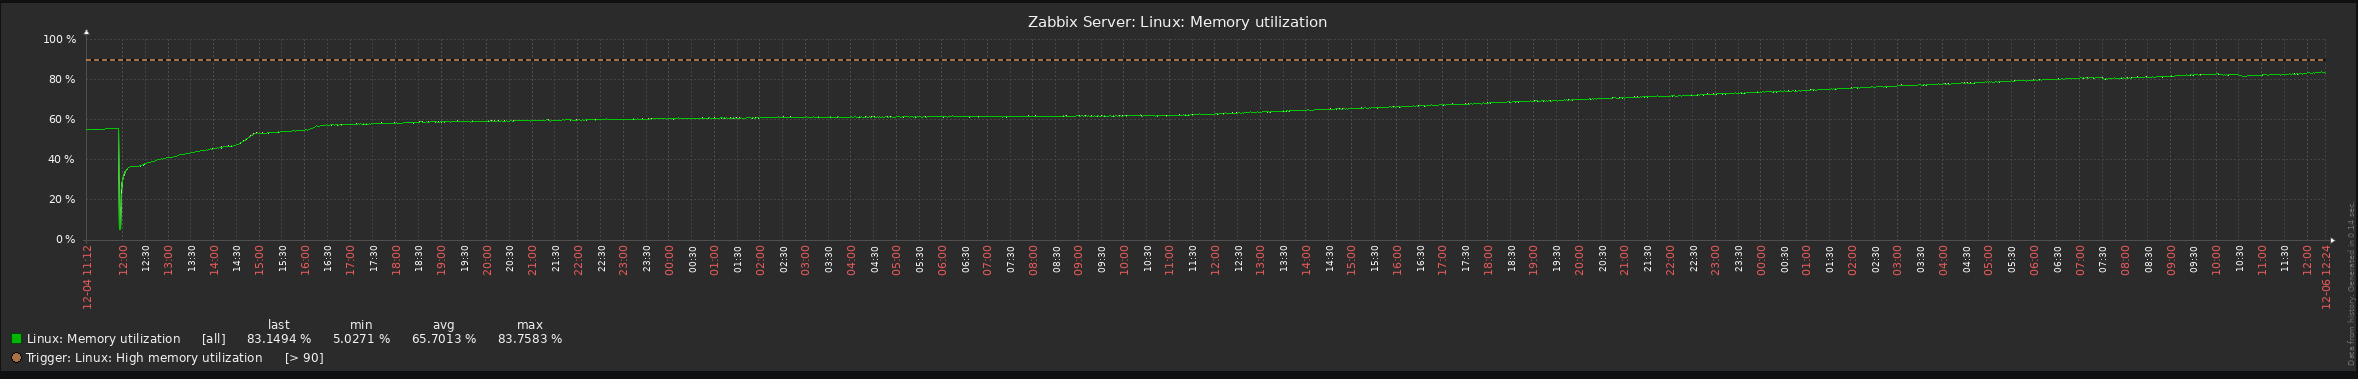
The memory increase as shown in the attached graph shows a constant memory increase in the order of gigabytes. This will eventually exhaust all available memory.
|
|
Could you please run the following commands on a long running server and share the output:
What types of items are you using for monitoring?
What types of preprocessing steps are in those items?
Are you using the standard templates provided by Zabbix?
If so, which ones?
|
|
Could you please be so kind and provide zabbix_server -R diaginfo, what kind of preprocessing is mostly used ?
|
|
Thanks sasha and vso , please see attached zabbix diaginfo.txt . .
The zabbix_server processes were restarted yesterday so I cannot fulfil the 'long running server' criteria, however I can see already that the virtual memory is increasing despite physical memory being available. See attached 'zabbix_server potential memory leak - memory and processes.txt'
For types of preprocessing items, see below. I have chosen itemid>100000 as I believe this would closely represent any items added that weren't simple oobe templates. The largest amount of preprocessed items would be from Veeam Backup and Replication by HTTP, AWS by HTTP and Azure by HTTP discovery;
SELECT COUNT(*), type FROM item_preproc WHERE itemid > '100000' GROUP BY TYPE ORDER BY COUNT ASC
| count |
type |
| 6 |
6 |
| 41 |
5 |
| 54 |
13 |
| 56 |
14 |
| 121 |
26 |
| 329 |
15 |
| 545 |
18 |
| 1667 |
25 |
| 3665 |
1 |
| 3898 |
21 |
| 5206 |
10 |
| 5450 |
4 |
| 16722 |
20 |
| 22291 |
12 |
|
|
Could you please be so kind to also provide output of:
zabbix_agentd -t proc.get or with template zabbix_server_memory_utilisation_v5.yaml
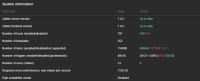
In diaginfo only interesting information is count of cached items, otherwise looks good:
== preprocessing diagnostic information == Cached items:31185 pending tasks:0 finished tasks:0 task sequences:0 time:0.000309
Could it be that cached items are large ?
|
|
See attached zabbix_agent2-proc.get.txt
|
|
PSS is 387 megabytes, however peak memory usage is high 3246 megabytes, it appears there was lots of data to process by preprocessing manager at some moment, could you please show Zabbix server health graphs ?
                {
                        "pid": 894951,
                        "ppid": 894924,
                        "name": "zabbix_server",
                        "cmdline": "/usr/sbin/zabbix_server: preprocessing manager #1 [queued 424, processed 1038 values, idle 4.986044 sec during 5.016775 sec]",
                        "user": "zabbix",
                        "group": "zabbix",
                        "uid": 113,
                        "gid": 119,
                        "vsize": 3246260224,
                        "pmem": 1.785468047381302,
                        "rss": 449212416,
                        "data": 1516560384,
                        "exe": 3588096,
                        "hwm": 455725056,
                        "lck": 0,
                        "lib": 17494016,
                        "peak": 3246260224,
                        "pin": 0,
                        "pte": 3297280,
                        "size": 1520283648,
                        "stk": 135168,
                        "swap": 1039720448,
                        "cputime_user": 2138.98,
                        "cputime_system": 786.27,
                        "state": "sleeping",
                        "ctx_switches": 42628321,
                        "threads": 11,
                        "page_faults": 3188,
                        "pss": 387652096
                }
For example I see that proxy poller peak memory usage was also high
                        "pid": 894970,
                        "ppid": 894924,
                        "name": "zabbix_server",
                        "cmdline": "/usr/sbin/zabbix_server: proxy poller #1 [exchanged data with 0 proxies in 0.000025 sec, idle 5 sec]",
                        "user": "zabbix",
                        "group": "zabbix",
                        "uid": 113,
                        "gid": 119,
                        "vsize": 1314439168,
                        "pmem": 0.025494825087754455,
                        "rss": 6414336,
                        "data": 3227648,
                        "exe": 3588096,
                        "hwm": 10686464,
                        "lck": 0,
                        "lib": 17494016,
                        "peak": 1314439168,
                        "pin": 0,
                        "pte": 126976,
                        "size": 6950912,
                        "stk": 135168,
                        "swap": 2166784,
                        "cputime_user": 0.64,
                        "cputime_system": 0.16,
                        "state": "sleeping",
                        "ctx_switches": 17990,
                        "threads": 1,
                        "page_faults": 1,
                        "pss": 179712
                },
|
|
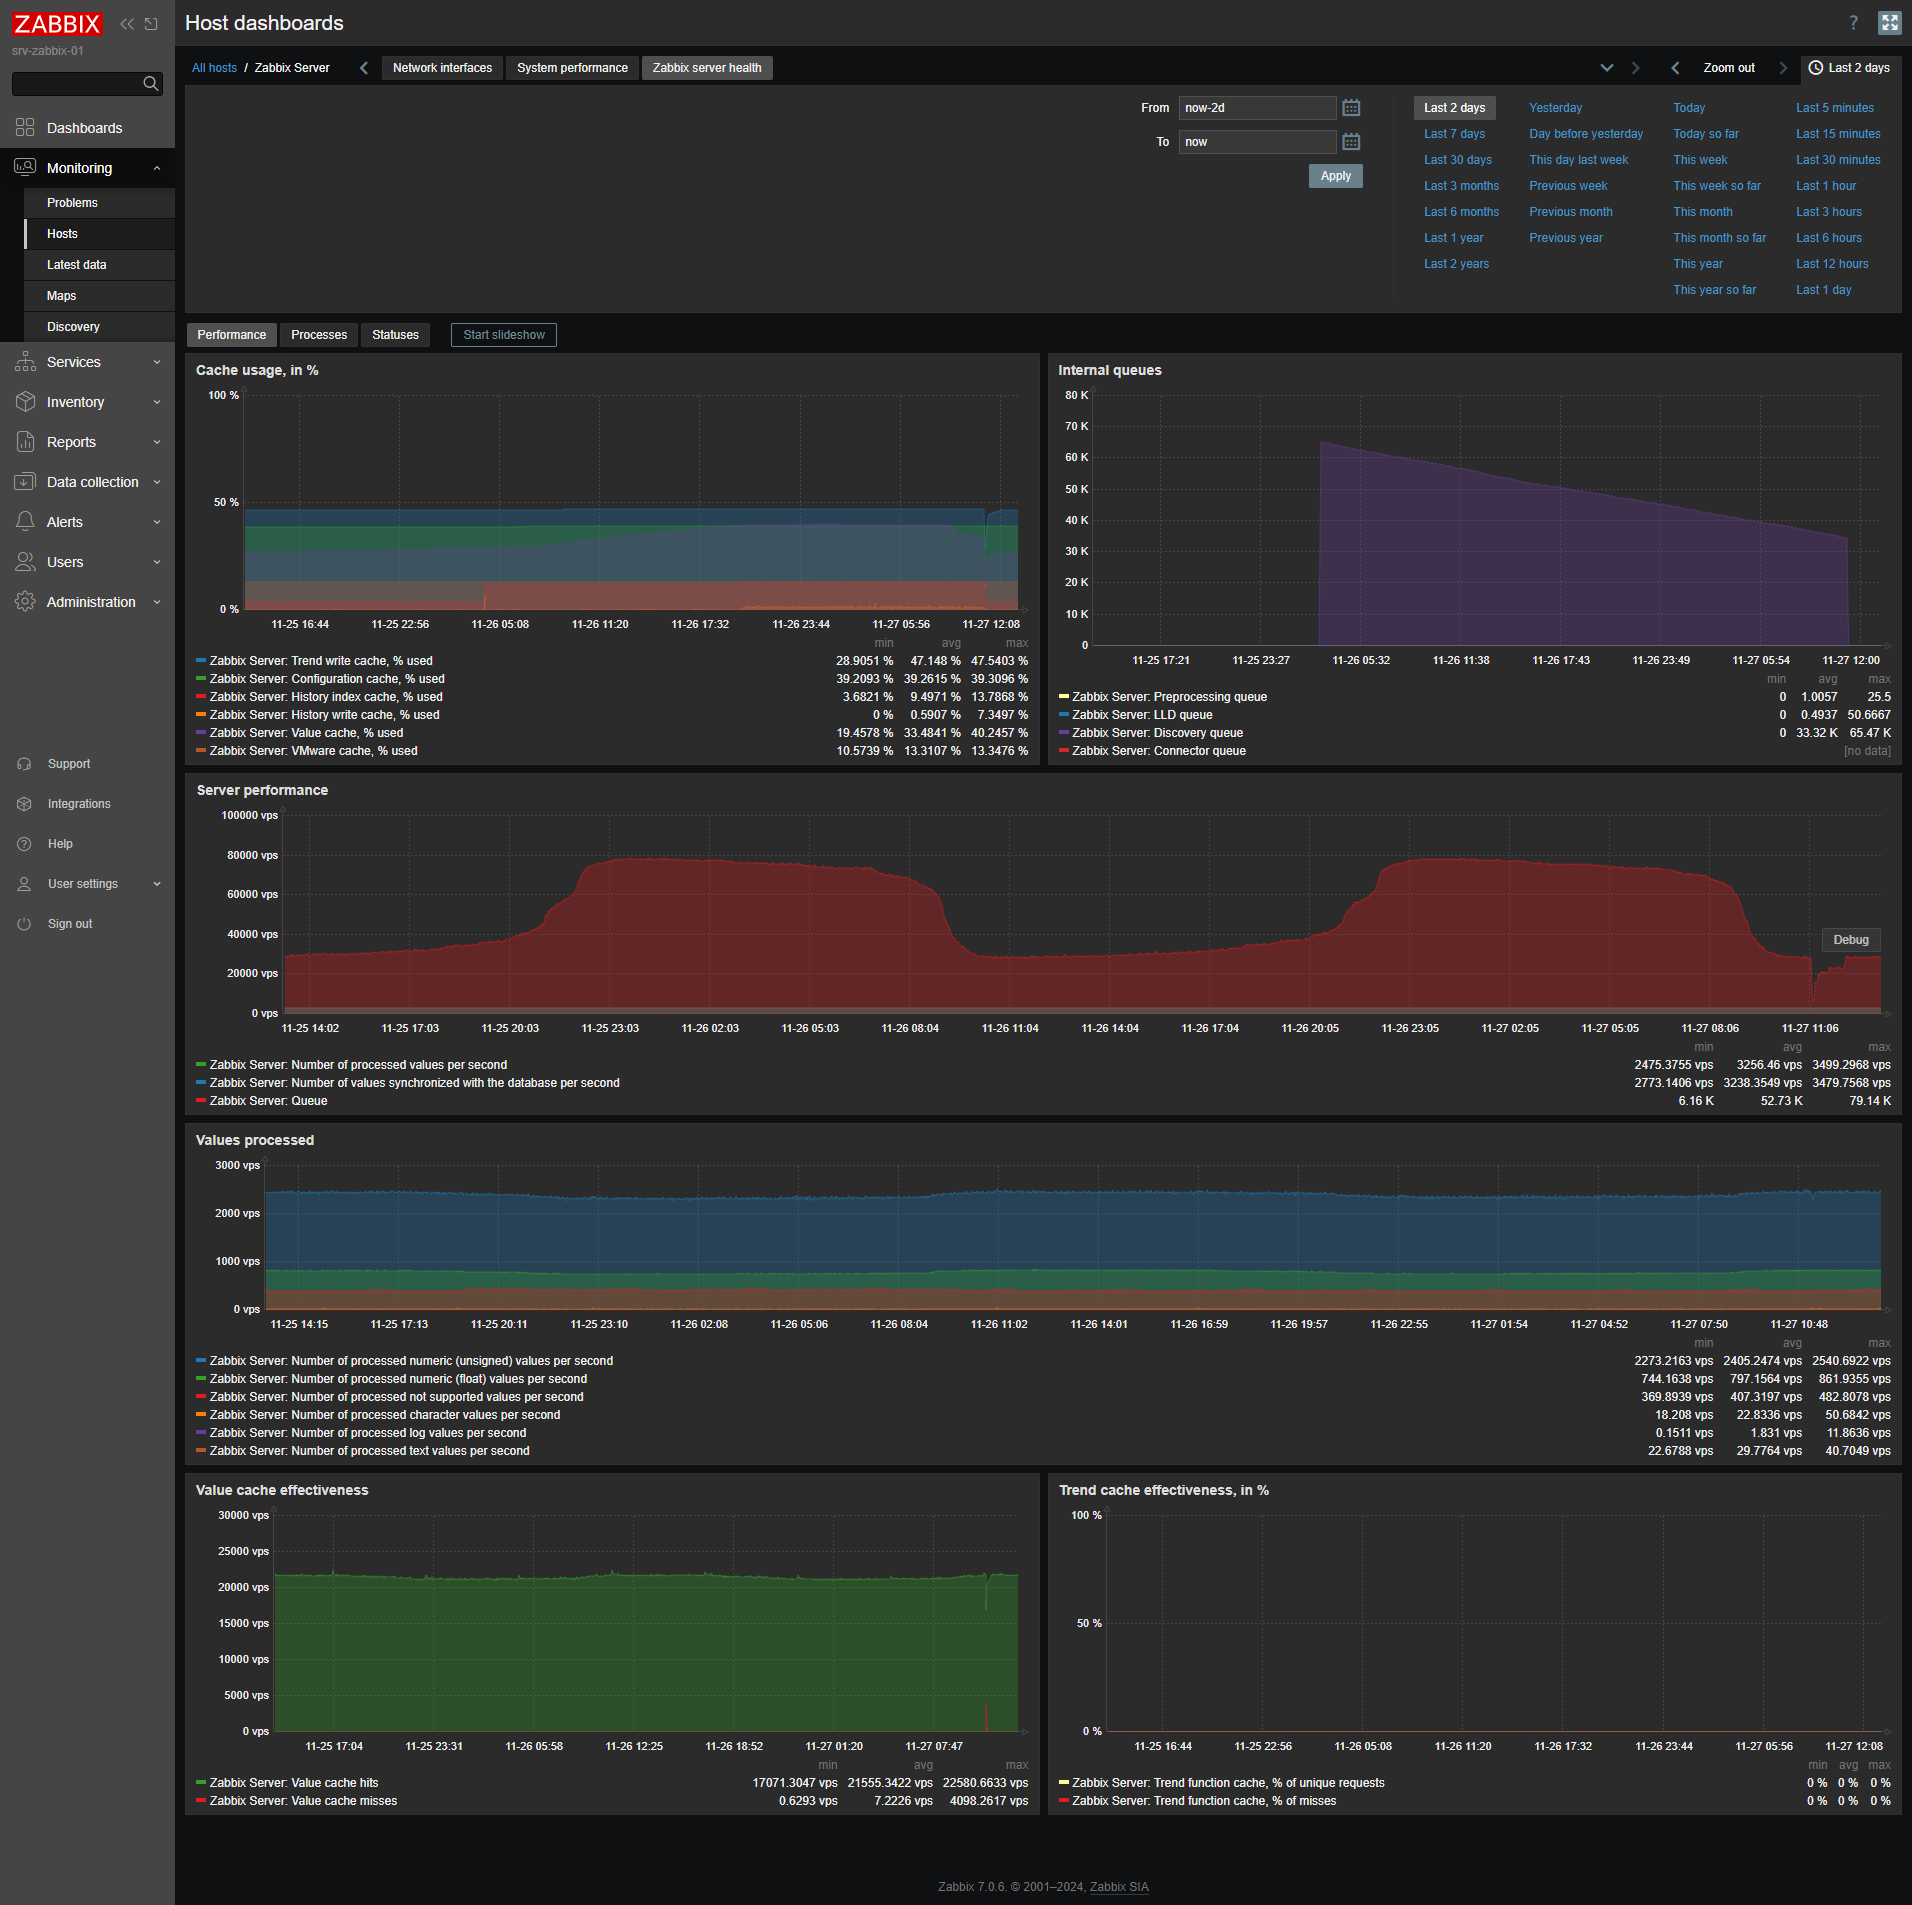
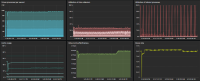
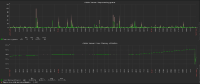
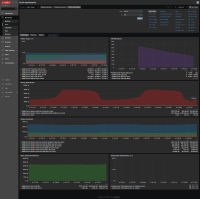
See below past 24 hours from health dashboard. Peaks are housekeeper. Also note the increased value cache effectiveness and queue size changes are directly correlated to starting the local zabbix agent after having been stopped the night before.
|
|
Its most likely shared memory, what are the values for it in configuration file and does changing them for example 2x smaller reduce memory usage ? However actual memory usage appears to be reasonable 387 megabytes by preprocessing manager, currently there is no indication of an issue.
|
|
Thanks vso, to confirm, you see the 11.6G of virtual memory allocated to preprocessing manager to be normal?
I am struggling to understand this change in behaviour, as it seemed to coincide with our upgrade to Zabbix 7.x from 6.4.
|
|
It's possible that there is an issue but having large virtual size is not issue itself, it can be observed that it grows immediately once CacheSize is set too larger value, please also provide cat /proc/894951/smaps_rollup for analysis
|
|
Thanks, see attached smaps_rollup for the preprocessing PID, as well as a pmap sorted by Kbytes in zabbix pre-processor pmap.txtzabbix pre-processor pmap.txt
For what it's worth, I killed the pre-processing manager parent process with kill -9, and it immediately released all virtual memory that was allocated to it.
In regard to cache sizing, it is very small (128M), I don't believe any zabbix_server cache configurations would be attributing to this, and indeed none have changed.
This looks exactly the same as
ZBX-24712
|
|
It could be due to the fact that there are many javascript preprocessing, they are all cached and can consume memory, same goes for throttling. Is same javascript used for many items ?
|
|
Please apply history_size_7_0.diff patch and provide diaginfo information to confirm if it's indeed history size for preprocessing that is large due to throttling
|
|
Thanks Vlad, unfortunately I cannot compile from source in our environment. I am going to restart zabbix_server under valgrind tonight to see if this helps identify the issue.
Scratch that, immediately crashed with an out of memory error.
|
|
Hello [email protected],
If you can install patched package, please share what operating system version you have and backend type used, we will share patched package to find the root cause.
Regards,
Edgar
|
|
Thanks edgar.akhmetshin;
OS: PRETTY_NAME="Ubuntu 22.04.4 LTS"
Kernel: Linux 5.15.0-119-generic #129-Ubuntu SMP Fri Aug 2 19:25:20 UTC 2024 x86_64 x86_64 x86_64 GNU/Linux
DB: PostgreSQL 14.13 (Ubuntu 14.13-0ubuntu0.22.04.1)
|
|
Hello [email protected],
Here is the Server package, provide diaginfo information since memory leak is visible and noticeable as mentioned by vso:
zabbix-server-pgsql_7.0.3-0.ZBX25050+ubuntu22.04_amd64.deb
Regards,
Edgar
|
|
Thanks edgar.akhmetshin, this package is now installed, and I will report back in about a week with the results.
|
|
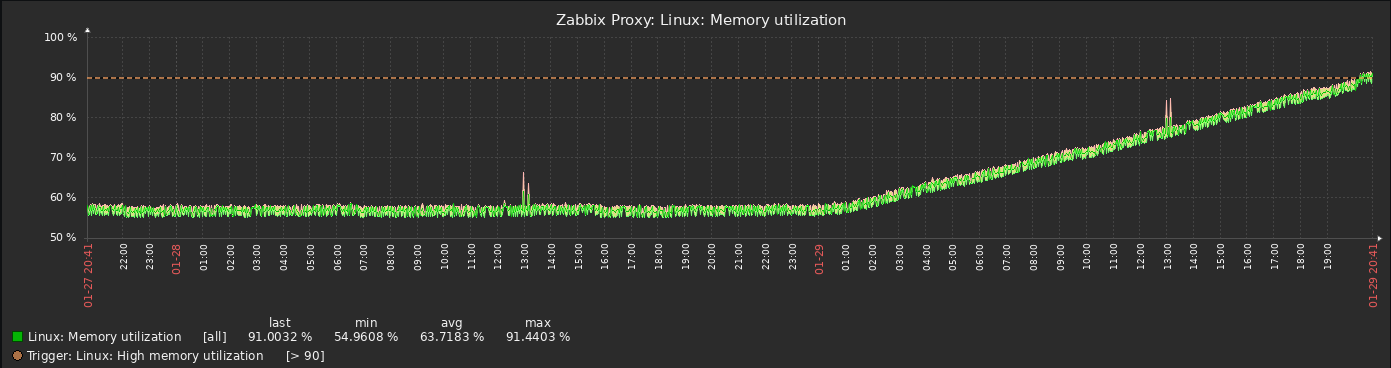
Hi edgar.akhmetshin , since running Zabbix Server using the package provided, the behaviour seems to have resolved, as shown below;
I don't know if this was the expected result or a co-incidence, but it looks like the symptom isn't being reproduced at this time. See also zabbix_server_patched_diaginfo.txt.
|
|
Hello [email protected],
We have one env with the same issue and memory usage by preprocessing manager started to grow after 1 week of a usage.
Please keep monitoring, currently we are investigating already existing information from another environment.
Regards,
Edgar
|
|
Hi edgar.akhmetshin, it looks like it has begun again. See below. I have also noted any activities that were being performed in Zabbix around that time;
- Created maintenance period
- Deleted a VMware-discovered host, and executed discovery on the VCSA for VMware FQDN
- VEEAM Backup and Replication by HTTP: Job states discovery
- Azure via HTTP: Storage account: Get data
|
|
It's normal for memory usage to grow a little if new items are added, did configuration cache usage also grow ?
|
|
How many preprocessing workers are configured ? Please try adding as many as possible to avoid large queue, please set at least to StartPreProcessor=100 and see if issue persists
|
|
Please also provide graphs for history cache usage and zabbix[vps,written]
zabbix[wcache,<cache>,<mode>] such as zabbix[wcache, history,pfree]
Also for preprocessing queue:
zabbix[preprocessing_queue]
|
|
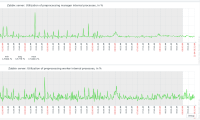
Increasing preprocessing workers from 3 to 10 decrease speed of memory consumption.
|
|
If lots of values are processed then please increase to 100 or more and see if memory usage stops to increase, unfortunately it's possibility that lots of values are queued if there are not enough works and in that case it can cause memory usage to increase, it should stabilise at some moment though when peak is reached, if there are more workers then queue should not grow so much. If peaks are rare then a solution could be to force memory to be released back to system.
However first it would be good to know what is causing such spikes in memory usage
|
|
Confirmed, default count of preprocessing workers should be increased to match core count, see system_cpu_num() function
### Option: StartPreprocessors
#	Number of pre-started instances of preprocessing worker threads, should be set to no less than available CPU core count. More workers should be set if preprocessing is not CPU bound and has lots of network requests.
#
# Mandatory: no
# Range: 1-1000
# Default (automatically set to core count):
# StartPreprocessors=
Also malloc_trim should be called on a daily basis to trim memory above 128 MB in case there were spikes in queue
|
|
Does it help setting to StartPreprocessors to number of cores in system Dimasmir ?
|
|
I have VM with 8 vCPU. Increasing Preprocessors to 10 or to 20 not help.
I attach memory usage praph, output of "/proc/cpuinfo" and output of "ps -aux --sort -rss"
I can try to reduce Preprocessors to 8.
|
|
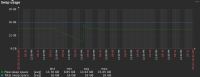
Please check graphs for zabbix[preprocessing_queue] item what is the peak value ?
|
|
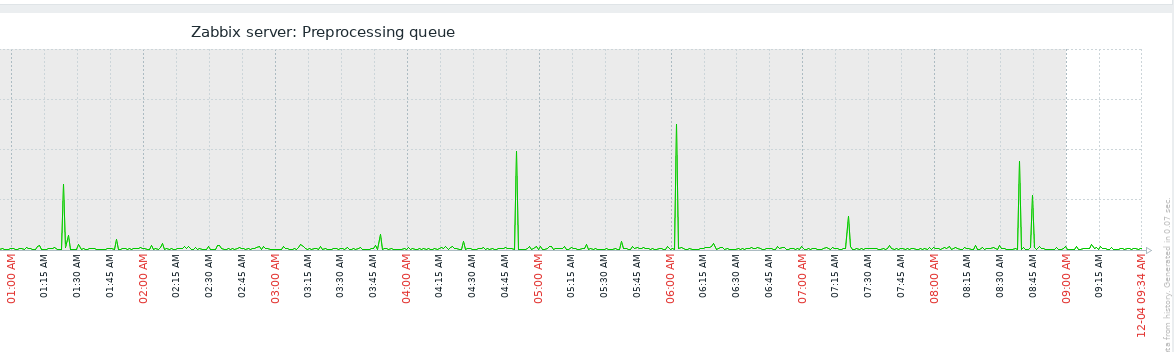
Peak 191, avg 0.5.
|
|
Thank you, could you please check over the longer period, preferably since server was started ?
|
|
It is for last 5 days, when preprocessors qty was increased.
|
|
Thank you, could you please also share pss instead of rss ? RSS also includes shared memory so it can be misleading.
Here is example:
ps -eo pss,pid,user,command --sort -pss | \
    awk '{ hr=$1/1024 ; printf("%13.2f Mb ",hr) } { for ( x=4 ; x<=NF ; x++ ) { printf("%s ",$x) } print "" }' |\
    cut -d "" -f2 | cut -d "-" -f1
|
|
ps does not accept pss, returns "error: unknown user-defined format specifier "pss".
Maybe output of /proc/'pid of preprocessing manager #1'/smaps can help? I've recently restarted the service, let's wait until the memory usage increases.
|
|
Could check cat /proc/<pid>/smaps_rollup and if Zabbix server config file have too much shared memory allocated.
|
|
VMwareCacheSize=128M - Utilization 14%
CacheSize=2G - Utilization 50%
HistoryIndexCacheSize=32M - Utilization 13%
TrendCacheSize=64M - Utilization 47%
ValueCacheSize=256M - Utilization 34%
cat smaps_rollup below, but so far little memory has been used up
cat /proc/4052990/smaps_rollup
55a9af6ec000-7ffc893c7000 ---p 00000000 00:00 0                          [rollup]
Rss:              680720 kB
Pss:              339401 kB
Shared_Clean:       9060 kB
Shared_Dirty:     387184 kB
Private_Clean:        60 kB
Private_Dirty:    284416 kB
Referenced:       678844 kB
Anonymous:        286256 kB
LazyFree:              0 kB
AnonHugePages:    151552 kB
ShmemPmdMapped:        0 kB
FilePmdMapped:         0 kB
Shared_Hugetlb:        0 kB
Private_Hugetlb:       0 kB
Swap:                  0 kB
SwapPss:               0 kB
Locked:                0 kB
|
|
Actual statistics
ps -aux --sort -rss
USER         PID %CPU %MEM    VSZ   RSS TTY      STAT START   TIME COMMAND
zabbix    882954  7.4 39.8 12529160 9820940 ?    Sl   Oct17 244:03 /usr/sbin/zabbix_server: preprocessing manager #1 [queued 9989, processed 10989 values, idle 4.878511 sec during 5.000763 sec]

cat /proc/882954/smaps_rollup
55fa44c95000-7ffdb15fc000 ---p 00000000 00:00 0                          [rollup]
Rss:             9825624 kB
Pss:             9486237 kB
Shared_Clean:       9252 kB
Shared_Dirty:     382996 kB
Private_Clean:        60 kB
Private_Dirty:   9433316 kB
Referenced:      9823744 kB
Anonymous:       9434768 kB
LazyFree:              0 kB
AnonHugePages:   9318400 kB
ShmemPmdMapped:        0 kB
FilePmdMapped:         0 kB
Shared_Hugetlb:        0 kB
Private_Hugetlb:       0 kB
Swap:                  0 kB
SwapPss:               0 kB
Locked:                0 kB
One more 12 hours later
cat /proc/882954/smaps_rollup
55fa44c95000-7ffdb15fc000 ---p 00000000 00:00 0                          [rollup]
Rss:            12281460 kB
Pss:            11937922 kB
Shared_Clean:       9236 kB
Shared_Dirty:     387212 kB
Private_Clean:        60 kB
Private_Dirty:  11884952 kB
Referenced:     12272084 kB
Anonymous:      11887052 kB
LazyFree:              0 kB
AnonHugePages:  11235328 kB
ShmemPmdMapped:        0 kB
FilePmdMapped:         0 kB
Shared_Hugetlb:        0 kB
Private_Hugetlb:       0 kB
Swap:                  0 kB
SwapPss:               0 kB
Locked:                0 kB
|
|
Fixed in:
|
|
Documentation updated:
- Introduction > What's new in Zabbix 7.0.6
- Installation > Upgrade notes for 7.0.6
- Configuration > Items > Item value preprocessing > Preprocessing details (7.0, 7.2; updated "Preprocessing workers" section introduction)
- Appendixes > Process configuration > Zabbix server (7.0, 7.2; updated StartPreprocessors parameter description)
- Appendixes > Process configuration > Zabbix proxy (7.0, 7.2; updated StartPreprocessors parameter description)
|
|
Looks like 7.0.6 not resolve memory leaking.
|
|
Could you please be so kind and provide smaps_rollup for preprocessing manager ?
|
|
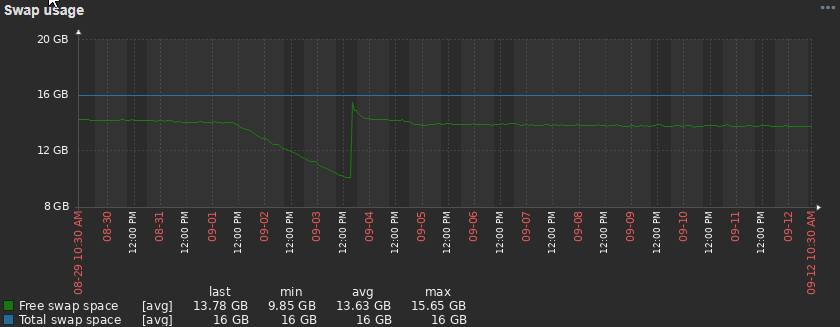
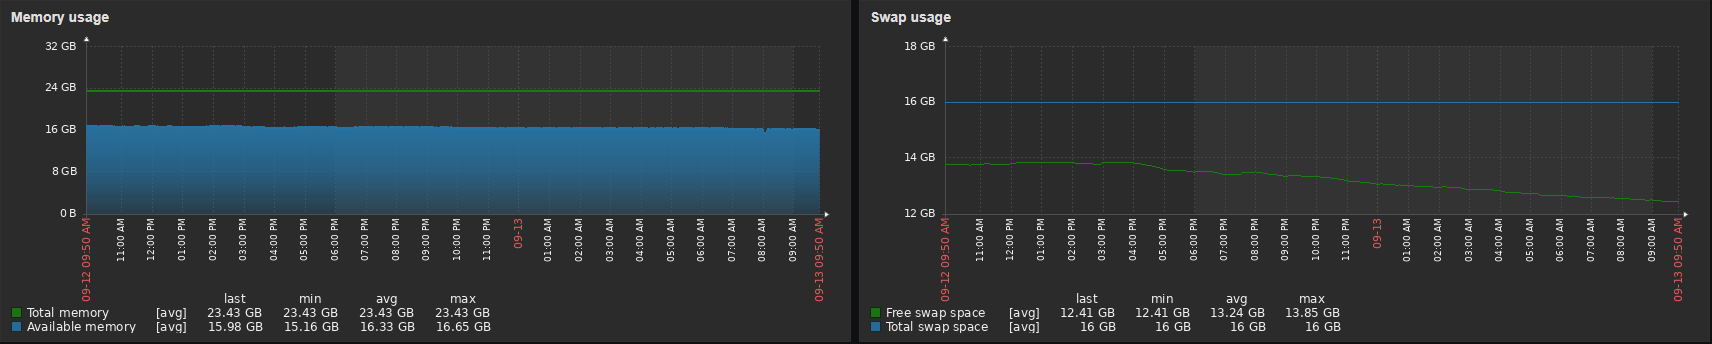
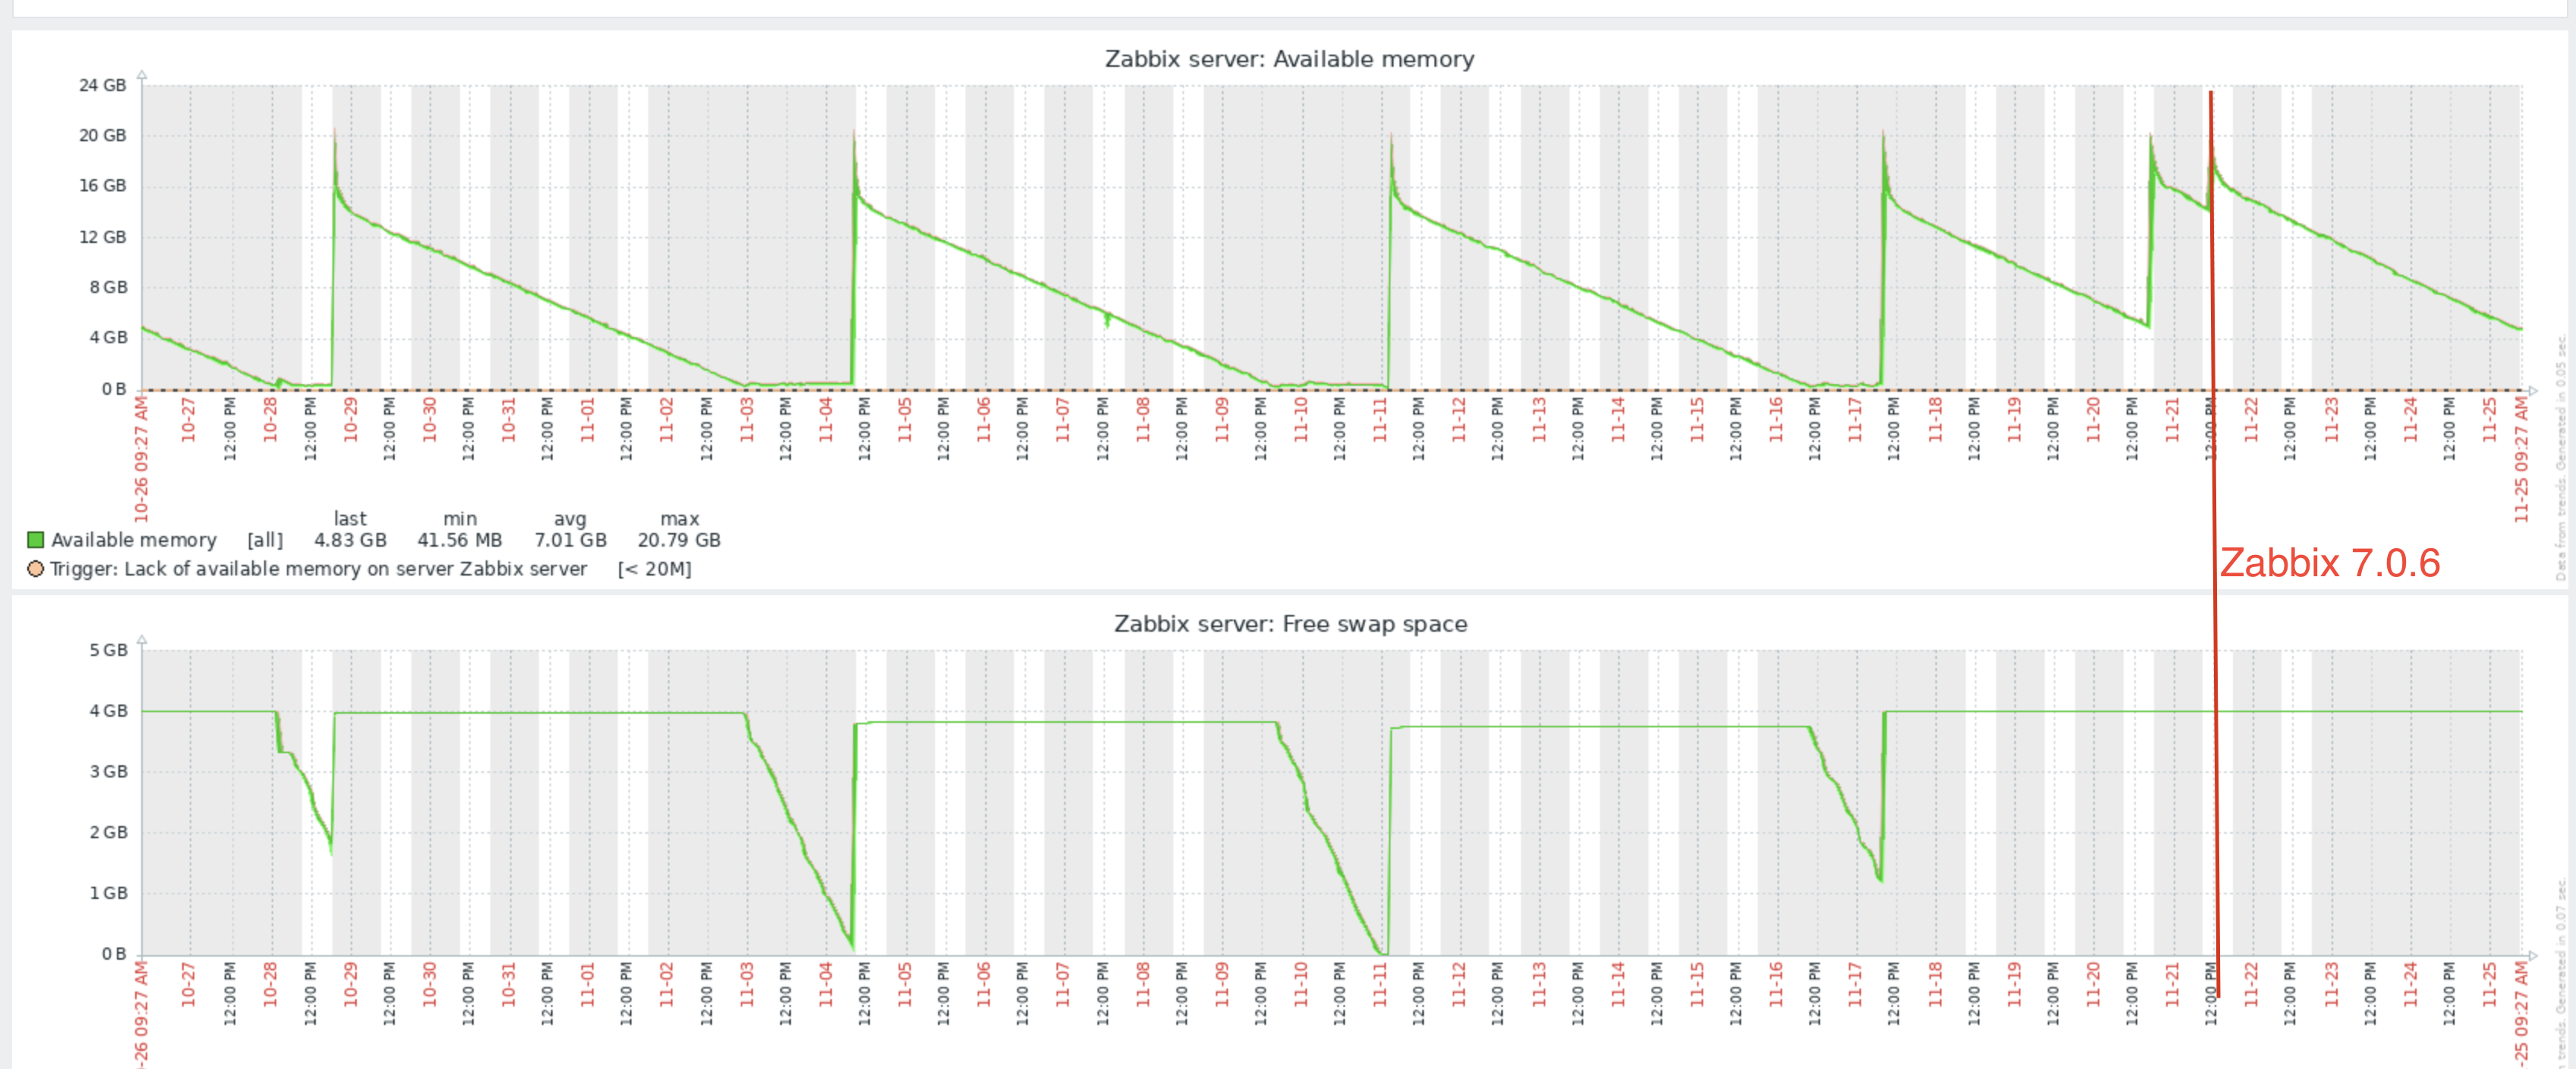
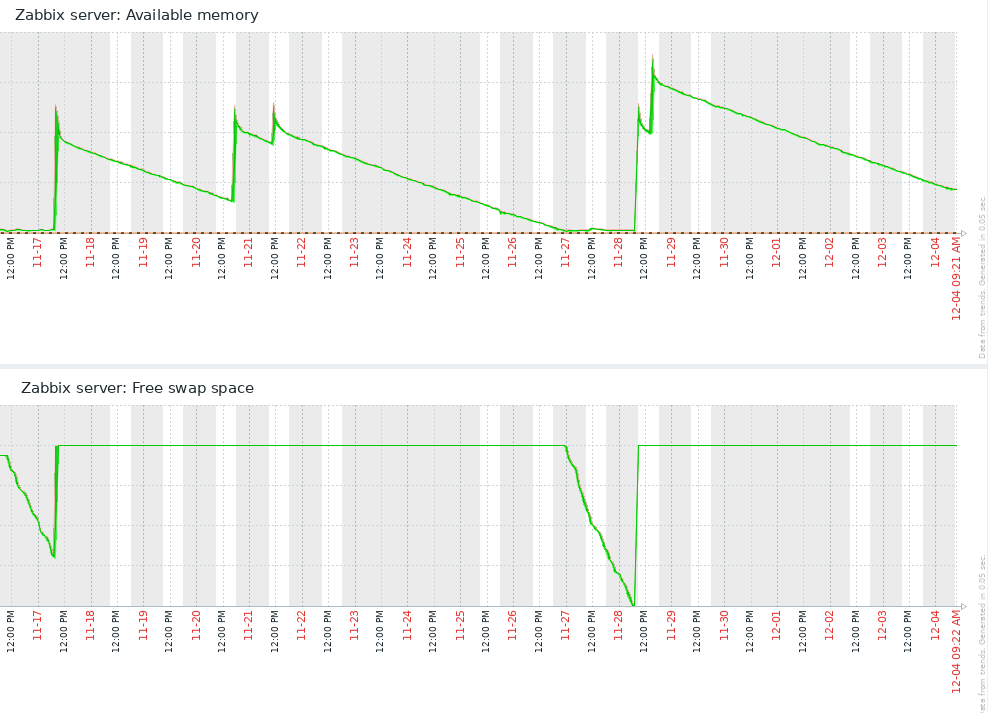
I am having the same or at least very similar behavior with one Zabbix installations:
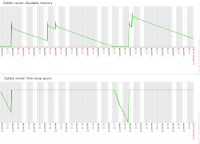
As you can see Zabbix Server available memory shrinks down until eaten up including swap space, then it crashes. This happens every ~6 days since upgrade to Zabbix 7.0
Process lists shows that Preprocessing Manager process is the one eating up the memory (right now 50%):
zabbix 1102 6.7 50.1 15896064 12332900 ? Sl Nov21 381:11 /usr/sbin/zabbix_server: preprocessing manager #1 [queued 5467, processed 6314 values, idle 4.812578 sec during 5.000574 sec]
In this installation, we have roughly 5k NVPS, running Zabbix Server + frontend on an Ubuntu 22 VM with 24 GiB of RAM, 4 cores. I have started 50 Preprocessors in zabbix_server.conf. I was hoping 7.0.6 to fix this issue, but I can see the memory consumption still goes the same direction as before.
|
|
vso , I just increased the number of preprocessors from 20 to 40 and restarted the server. Let's wait a little bit.
|
|
Please provide smaps_rollup for preprocessing manager christiananton toe see if there is really an issue
|
|
cat /proc/1102/smaps_rollup
55dfe9b4d000-7ffe99792000 ---p 00000000 00:00 0 [rollup]
Rss: 12472388 kB
Pss: 12197019 kB
Pss_Anon: 12168070 kB
Pss_File: 81 kB
Pss_Shmem: 28866 kB
Shared_Clean: 9600 kB
Shared_Dirty: 294728 kB
Private_Clean: 0 kB
Private_Dirty: 12168060 kB
Referenced: 12469192 kB
Anonymous: 12171556 kB
LazyFree: 0 kB
AnonHugePages: 0 kB
ShmemPmdMapped: 0 kB
FilePmdMapped: 0 kB
Shared_Hugetlb: 0 kB
Private_Hugetlb: 0 kB
Swap: 0 kB
SwapPss: 0 kB
Locked: 0 kB
|
|
Indeed memory usage is high christiananton, could you please check if after upgrade to 7.0.6 it drops daily, this could give some hints on why it was happening.
|
|
vso according to the graph posted above since upgrade to 7.0.6 (from formerly 7.0.5), no changes. Available memory continuously going down in exactly the same speed as before and over several days now. Will see whether it will behave equally than before, eating up all memory, and all swap space, and killing itself afterwards. I suppose it will.
|
|
vso
ps -aux --sort -rss
USER PID %CPU %MEM VSZ RSS TTY STAT START TIME COMMAND
zabbix 759250 7.4 11.2 7821084 2785224 ? Sl Nov25 203:28 /usr/sbin/zabbix_server: preprocessing manager #1 [queued 5442, processed 6186 values, idle 4.927770 sec during 5.001555 sec]
cat /proc/759250/smaps_rollup
56439ab87000-7ffcd35de000 ---p 00000000 00:00 0 [rollup]
Rss: 2793208 kB
Pss: 2471420 kB
Shared_Clean: 8908 kB
Shared_Dirty: 343900 kB
Private_Clean: 0 kB
Private_Dirty: 2440400 kB
Referenced: 2791328 kB
Anonymous: 2441240 kB
LazyFree: 0 kB
AnonHugePages: 2134016 kB
ShmemPmdMapped: 0 kB
FilePmdMapped: 0 kB
Shared_Hugetlb: 0 kB
Private_Hugetlb: 0 kB
Swap: 0 kB
SwapPss: 0 kB
Locked: 0 kB
|
|
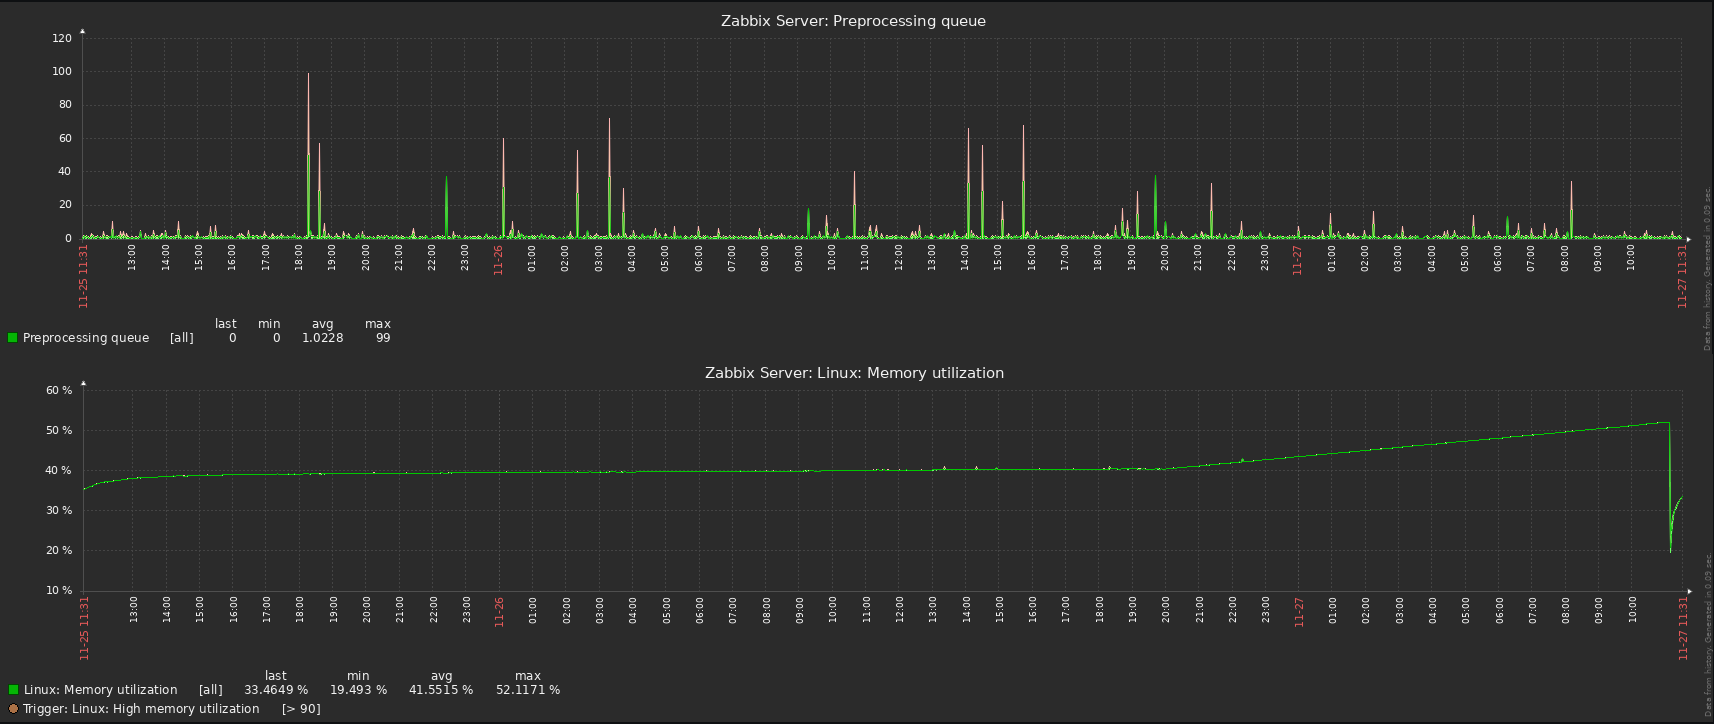
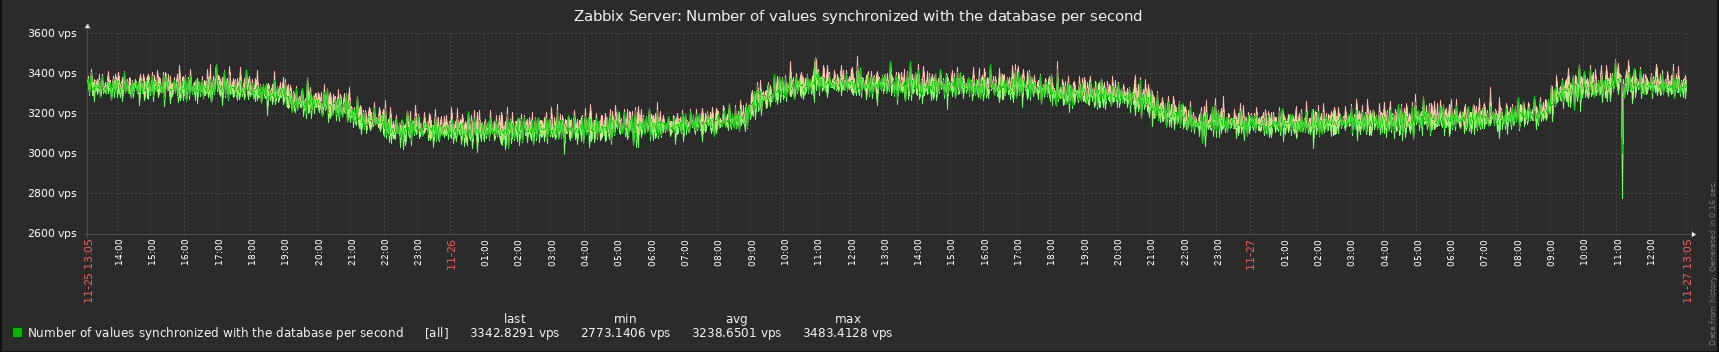
Please provide both memory utilisation and preprocessing manager queue together to see if there is correlation
|
|
I see Preprocessing queue metric in Zabbix server health template and information in ps output. Which one will be useful?
|
|
In template please
|
|
|
|
Please check cat /proc/759250/smaps_rollup daily if possible Dimasmir to see if it stabilises or not, it's possible that there was some kind of spike of values that filled preprocessing queue quickly and then released, for example there are queued 5442, processed 6186 values, currently it is unknown how big each value was but if each value is for example 1MB then it could take 5442 MB over short period, but memory should be released back to system after 24 hours.
|
|
Ок. Zabbix server started 2024-11-27 11:08:34.
Stats for now:
ps -aux | grep "preprocessing manager"
zabbix 2661309 7.7 1.9 5763556 480264 ? Sl 11:08 7:15 /usr/sbin/zabbix_server: preprocessing manager #1 [queued 9255, processed 11472 values, idle 4.887511 sec during 5.001647 sec]
cat /proc/2661309/smaps_rollup
556ff7501000-7ffe769dc000 ---p 00000000 00:00 0 [rollup]
Rss: 485836 kB
Pss: 184969 kB
Shared_Clean: 9020 kB
Shared_Dirty: 323272 kB
Private_Clean: 0 kB
Private_Dirty: 153544 kB
Referenced: 483956 kB
Anonymous: 155612 kB
LazyFree: 0 kB
AnonHugePages: 71680 kB
ShmemPmdMapped: 0 kB
FilePmdMapped: 0 kB
Shared_Hugetlb: 0 kB
Private_Hugetlb: 0 kB
Swap: 0 kB
SwapPss: 0 kB
Locked: 0 kB
|
|
Could you please bet so kind and provide graph for zabbix[vps,written] and screenshot for Zabbix server health dashboard
|
|
|
|
Stats for now:
cat /proc/2661309/smaps_rollup
556ff7501000-7ffe769dc000 ---p 00000000 00:00 0 [rollup]
Rss: 4331020 kB
Pss: 4010545 kB
Shared_Clean: 9020 kB
Shared_Dirty: 343180 kB
Private_Clean: 0 kB
Private_Dirty: 3978820 kB
Referenced: 4329140 kB
Anonymous: 3980728 kB
LazyFree: 0 kB
AnonHugePages: 3696640 kB
ShmemPmdMapped: 0 kB
FilePmdMapped: 0 kB
Shared_Hugetlb: 0 kB
Private_Hugetlb: 0 kB
Swap: 0 kB
SwapPss: 0 kB
Locked: 0 kB
|
|
If possible please try launching zabbix with jemalloc https://github.com/jemalloc/jemalloc/wiki/getting-started, here is example:
LD_PRELOAD="/usr/lib/aarch64-linux-gnu/libjemalloc.so.2" ./sbin/zabbix_server -c /etc/zabbix/zabbix_server.conf --foreground
|
|
Stats for now:
cat /proc/2661309/smaps_rollup
556ff7501000-7ffe769dc000 ---p 00000000 00:00 0 [rollup]
Rss: 9084068 kB
Pss: 8758731 kB
Shared_Clean: 9148 kB
Shared_Dirty: 347540 kB
Private_Clean: 0 kB
Private_Dirty: 8727380 kB
Referenced: 9082188 kB
Anonymous: 8729288 kB
LazyFree: 0 kB
AnonHugePages: 8611840 kB
ShmemPmdMapped: 0 kB
FilePmdMapped: 0 kB
Shared_Hugetlb: 0 kB
Private_Hugetlb: 0 kB
Swap: 0 kB
SwapPss: 0 kB
Locked: 0 kB
|
|
Started, bun locks the console and under root user.
I can set up shell for zabbix user and use nohup to free console?
LD_PRELOAD="/usr/lib64/libjemalloc.so.2" /usr/sbin/zabbix_server -c /etc/zabbix/zabbix_server.conf --foreground
Starting Zabbix Server. Zabbix 7.0.6 (revision c1d7a081969).
Press Ctrl+C to exit.
|
|
I think simplest way is to use tmux, but you can remove foreground option and probably update systemd file, just prepend previous command with LD_PRELOAD="/usr/lib64/libjemalloc.so.2"
|
|
Also created ZBXNEXT-9622 to be able to identify if there are specific items that are causing issues and ZBX-25642 to see if performance improvement for javascript to be executed in parallel will solve the issue
|
|
I have connected the library in the test environment. Attached is the mips from the test, can you confirm that there is the necessary data? Then I will be able to apply it to production.
maps.txt
|
|
Is it possible to attach smaps instead of maps please ? Did memory stopped increasing ?
|
|
It looks like the memory consumption hasn't stopped.
smaps attached.
Unfortunately, we can't leave the jemallock attached because all icmp checks stopped working with error
ERROR: ld.so: object 'libjemalloc.so.2' from LD_PRELOAD cannot be preloaded (cannot open shared object file): ignored.
app-qv-04.domainname : [0], 64 bytes, 0.313 ms (0.313 avg, 0% loss)
app-qv-04.domainname : xmt/rcv/%loss = 1/1/0%, min/avg/max = 0.313/0.313/0.313
smaps.txt
|
|
I have just tried and fling works for me with LD_PRELOAD, maybe there are some permission issues, if it's not possible to test then lets see after ZBXNEXT-9622, ZBX-25642
|
|
Little update from my side:
Current status of used memory on system:
So, we are very near to the next crash here.
ps axu | grep preprocessing
zabbix 1203 7.1 55.5 22521348 18249396 ? Sl Nov28 595:39 /usr/sbin/zabbix_server: preprocessing manager #1 [queued 6707, processed 9355 values, idle 4.859893 sec during 5.006683 sec]
Preprocessing manager is eating 21.4 GB of VSZ and 17.4 GB of RSS.
StartPreprocessors is set to 50
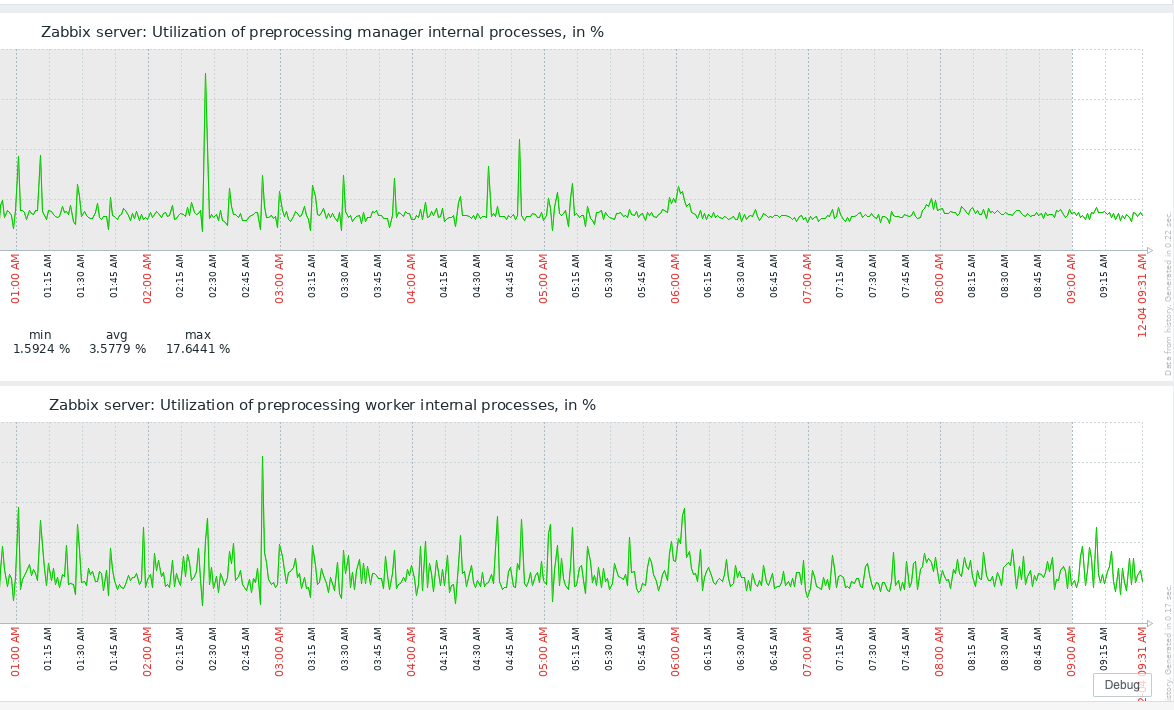
Utilization is almost nothing:
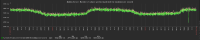
Preprocessing queue is also rather low.
|
|
Thank you christiananton for you report, from graph it looks like memory is freed every 24 hours and then climbs up again ? It's better to check pss instead of rss:
ps -eo pss,pid,user,command --sort -pss | \
    awk '{ hr=$1/1024 ; printf("%13.2f Mb ",hr) } { for ( x=4 ; x<=NF ; x++ ) { printf("%s ",$x) } print "" }' |\
    cut -d "" -f2 | cut -d "-" -f1
Current suspicion is that some values come in faster than they can be preprocessed, maybe discovery values, you can check it following command:
zabbix_server -R diaginfo="preprocessing";
But might need to wait for ZBXNEXT-9622 to see peak values as it is not always possible to catch problem at the time of occurrence, if true then implementing ZBX-25642 will help to process such values much faster
|
|
Memory doesn't free every 24h, instead it continues running full until eaten entirely, then it eats up swap, then system crashes. That happens approx. every 5-6 days.
Your ps command gives me "error: unknown user-defined format specifier "pss"" on Ubuntu 22.
|
|
ZBXNEXT-9622 has been pushed into pre-7.0.7rc1, please try it when possible and provide info from diaginfo to see if there are items that receive too many values over short periods.
Could you please also provide output of zabbix_server -R diaginfo="preprocessing" now christiananton ?
|
|
Right now, yet on 7.0.6, this is the output:
zabbix_server -R diaginfo="preprocessing"
== preprocessing diagnostic information ==
Cached items:186958 pending tasks:0 finished tasks:0 task sequences:0 time:0.000210
Top.sequences:
==
I am going to install a pre-release built to check whether ZBX-25584 would be solved. Could you check internally whether the build provided by Michael Veksler that he provided just 40 minutes ago does also include the change mentioned by you above? In that case, or if Michael could generate another pre-release build including both, I could verify both cases as these are on the same instance.
|
|
Actually cached items:186958 could itself be a problem if discard unchanged is used and there are big values stored to check for discard, this could require it to be fixed in other way by storing hash instead of last values but we have tried history_size_7_0.diff patch with other installation and it was not the case, maybe it is this time, but then it should have also been issue prior to 7.0
|
|
I have installed 7.0.7-rc1 from ZBX-25584 in order to verify whether the changes made help.
I also see a changed output of the diagnostics info for preprocessing, so it seems it has ZBXNEXT-9622 in it:
zabbix_server -R diaginfo="preprocessing"
== preprocessing diagnostic information ==
Cached items:187164 pending tasks:0 finished tasks:0 task sequences:0 time:0.016441
Top.sequences:
Top.peak:
itemid:3976924 tasks:2
itemid:3997252 tasks:2
itemid:2365541 tasks:2
itemid:2365506 tasks:2
itemid:1556131 tasks:2
itemid:4019662 tasks:2
itemid:2361158 tasks:2
itemid:3970034 tasks:2
itemid:2361872 tasks:2
itemid:2364779 tasks:2
itemid:3976857 tasks:2
itemid:3974407 tasks:2
itemid:2454490 tasks:2
itemid:4026019 tasks:2
itemid:3972920 tasks:2
itemid:3991707 tasks:2
itemid:3983344 tasks:2
itemid:3998008 tasks:2
itemid:3941471 tasks:2
itemid:4011239 tasks:2
itemid:1155245 tasks:2
itemid:4034940 tasks:2
itemid:4030660 tasks:2
itemid:4022250 tasks:2
itemid:2857421 tasks:2
==
Of course, up to now there is no big memory consumption of preprocessing manager (and workers) because I have started 7.0.7rc1 not more than 20 minutes ago. I will keep it running and check if I can see anything interesting.
|
|
That looks correct, please note that statistics is reset every 24 hours so it's best to collect before the time expires
|
|
vso, we were able to attach jemalloc without errors and waited for high memory consumption.
smaps attached.
prepressor_smaps.txt
smaps 9 hours later, before reboot
prepressor_smaps2.txt
|
|
Currently it is not clear how to reproduce issue, if there is test installation that experiences this issue could try debugging it with following commands.
When compiling do not strip debug symbols also best to compile with following CFLAGS:
Run with tcmalloc
LD_PRELOAD="/usr/lib/aarch64-linux-gnu/libtcmalloc.so" HEAPPROFILE=./heap_profile HEAP_PROFILE_ALLOCATION_INTERVAL=0 HEAP_PROFILE_INUSE_INTERVAL=4294967296 HEAPPROFILESIGNAL=5 MALLOCSTATS=1 ./sbin/zabbix_server -f -c /etc/zabbix/zabbix_server.conf
Identify pid that is consuming lots of memory and make it dump profiling, replace 2724852 with pid of preprocessing manager as an example:
Then print profile:
google-pprof -text ./sbin/zabbix_server ./heap_profile.0001.heap
Using local file ./sbin/zabbix_server.
Using local file ./heap_profile.0001.heap.
Total: 1078.1 MB
  1076.8  99.9%  99.9%   1076.8  99.9% zbx_malloc2
     1.0   0.1% 100.0%      1.0   0.1% __GI___strdup
     0.2   0.0% 100.0%      0.2   0.0% CRYPTO_zalloc@@OPENSSL_3.0.0
     0.1   0.0% 100.0%      0.1   0.0% OPENSSL_LH_insert@@OPENSSL_3.0.0
     0.0   0.0% 100.0%      0.0   0.0% zbx_realloc2
     0.0   0.0% 100.0%      0.1   0.0% PKCS7_decrypt@@OPENSSL_3.0.0
     0.0   0.0% 100.0%      0.0   0.0% find_best_tree_node
     0.0   0.0% 100.0%      0.0   0.0% CRYPTO_strndup@@OPENSSL_3.0.0
|
|
I am sorry Dimasmir did you have smaps_rollup with jemalloc for preprocessing manager, it seemed that memory usage was much lower, maybe something else consumed rest of the memory ?
|
|
vso, I can restart Zabbix with jemalloc.
let's agree on a methodology for collecting metrics?
We can try to make a copy of the production in the hope that the problem will repeat there. But it will still be different because of the ACL and all that.
|
|
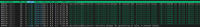
One thing that I have noticed today is that many of the items in preprocessing manager's diaginfo are actually unsupported items. Some of them from LLD rules not discovering those entities anymore, and some just unsupported.
== preprocessing diagnostic information ==
Cached items:186247 pending tasks:0 finished tasks:0 task sequences:0 time:0.011051
Top.sequences:
Top.peak:
itemid:4058443 tasks:2
itemid:2365541 tasks:2
itemid:2365506 tasks:2
itemid:1556131 tasks:2
itemid:4019662 tasks:2
itemid:2361158 tasks:2
itemid:4053280 tasks:2
itemid:1565613 tasks:2
itemid:2361872 tasks:2
itemid:2364779 tasks:2
itemid:3974407 tasks:2
itemid:3389971 tasks:2
itemid:2454490 tasks:2
itemid:4026019 tasks:2
itemid:3941471 tasks:2
itemid:4011239 tasks:2
itemid:1155245 tasks:2
itemid:4037529 tasks:2
itemid:4034940 tasks:2
itemid:4030660 tasks:2
itemid:4022250 tasks:2
itemid:2857421 tasks:2
itemid:4024892 tasks:2
itemid:2450951 tasks:2
itemid:502509 tasks:2
==
...and the output of preprocessing diaginfo doesn't change at all. Don't know how it works internally (read about reset every 24h above) but it makes me suspect that if unsupported items are actually using memory in preprocessing manager and workers, that might be the reason for huge memory consumption in this specific installation: it has quite huge number of unsupported items (>60k)...
--------
| itemid | key_ | status | state | type | value_type | flags | delay |
--------
| 502509 | dns_records_ip_compare.sh[\{HOST.DNS}, \{$DNS_WHITELIST_IPS}] | 0 | 0 | 10 | 4 | 0 | 15m |
| 1155245 | get_api_barracuda_general_service_info | 0 | 0 | 19 | 4 | 0 | 5m |
| 1556131 | zbx_fetch_agent_item_from_host.sh[{$LOGSERVER},"syslog_stats_for_host[\{HOST.HOST}]"] | 0 | 0 | 10 | 4 | 0 | 5m |
| 1565613 | dns_records_ip_compare.sh[\{HOST.DNS}, \{$DNS_WHITELIST_IPS}] | 0 | 0 | 10 | 4 | 0 | 15m |
| 2361158 | hpe.msa.get.pools | 0 | 0 | 18 | 4 | 0 | 0 |
| 2361872 | hpe.msa.get.disks["disk_01.09",data] | 0 | 0 | 18 | 4 | 4 | 0 |
| 2364779 | hpe.msa.get.disks["disk_03.12",data] | 0 | 0 | 18 | 4 | 4 | 0 |
| 2365506 | hpe.msa.get.pools["B",data] | 0 | 0 | 18 | 4 | 4 | 0 |
| 2365541 | hpe.msa.get.ports["B3",,data] | 0 | 0 | 18 | 4 | 4 | 0 |
| 2450951 | hpe.primera.disk["14",data] | 0 | 0 | 18 | 4 | 4 | 0 |
| 2454490 | get_api_barracuda_general_box_status_item | 0 | 0 | 19 | 4 | 0 | 5m |
| 2857421 | hpe.msa.get.disks["disk_01.05",data] | 0 | 0 | 18 | 4 | 4 | 0 |
| 3389971 | dns_records_ip_compare.sh[\{HOST.DNS}, \{$DNS_WHITELIST_IPS}] | 0 | 0 | 10 | 4 | 0 | 15m |
| 3941471 | hpe.primera.volume["88382",data] | 0 | 1 | 18 | 4 | 4 | 0 |
| 3974407 | sap.workprocesses.overview[\{$SID}] | 0 | 0 | 0 | 4 | 0 | 1m |
| 4011239 | hpe.primera.volume["91712",data] | 0 | 1 | 18 | 4 | 4 | 0 |
| 4019662 | hpe.primera.volume["71543",data] | 0 | 1 | 18 | 4 | 4 | 0 |
| 4022250 | hpe.primera.volume["92127",data] | 0 | 1 | 18 | 4 | 4 | 0 |
| 4024892 | hpe.primera.volume["92235",data] | 0 | 1 | 18 | 4 | 4 | 0 |
| 4026019 | hpe.primera.volume["71758",data] | 0 | 1 | 18 | 4 | 4 | 0 |
| 4030660 | hpe.primera.volume["92459",data] | 0 | 1 | 18 | 4 | 4 | 0 |
| 4034940 | hpe.primera.volume["92647",data] | 0 | 1 | 18 | 4 | 4 | 0 |
| 4037529 | hpe.primera.volume["92749",data] | 0 | 1 | 18 | 4 | 4 | 0 |
| 4053280 | hpe.primera.volume["72814",data] | 0 | 1 | 18 | 4 | 4 | 0 |
| 4058443 | hpe.primera.volume["93408",data] | 0 | 1 | 18 | 4 | 4 | 0 |
--------
|
|
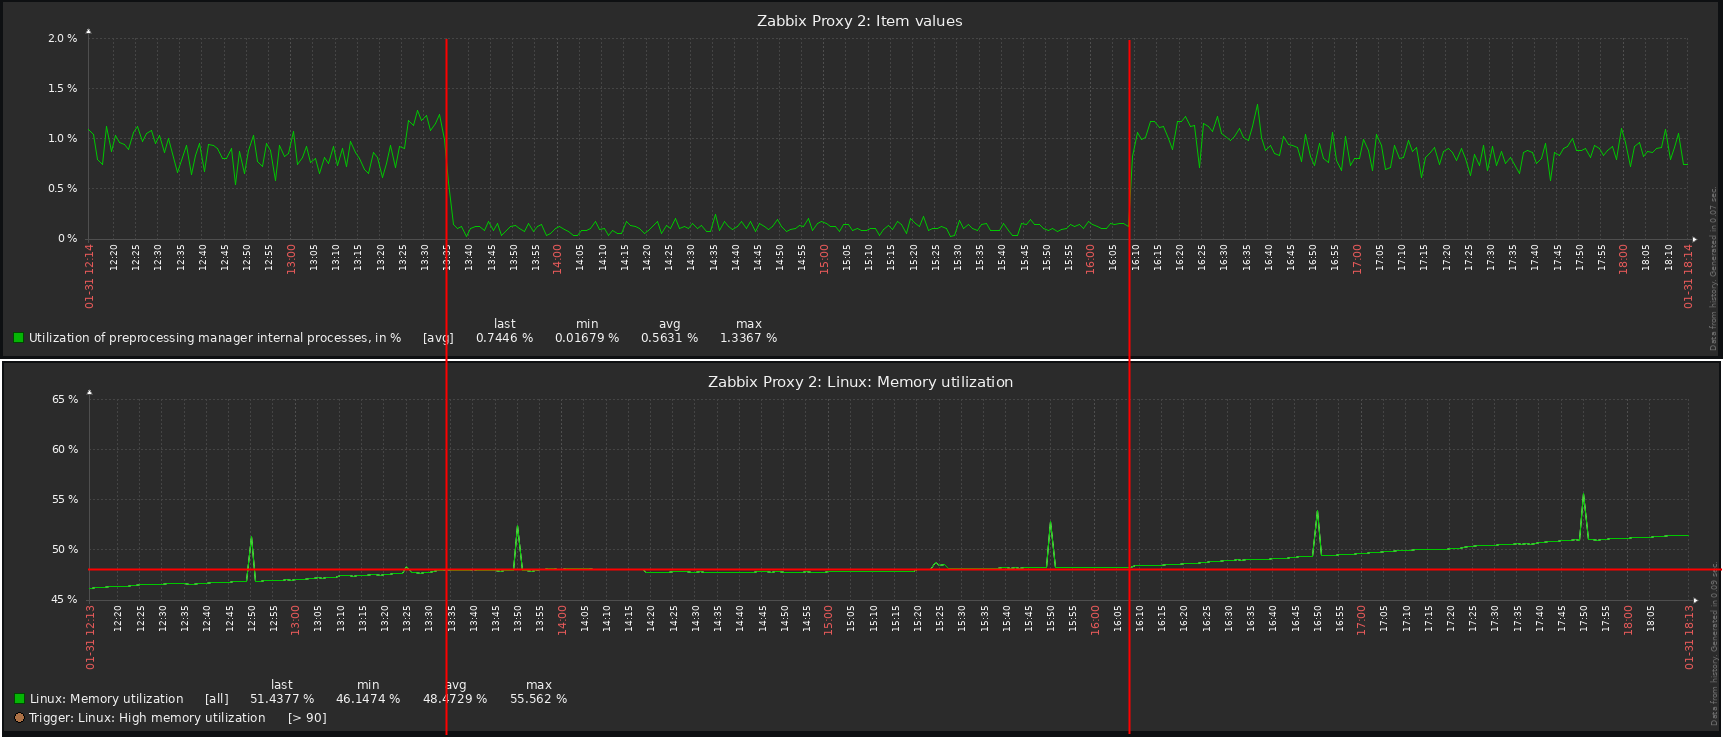
We moved VMware monitoring and some part of SNMP monitoring to proxy and the memory leak problem moved to proxy.
The move was related to worker load balancing.
|
|
If possible please provide output of diaginfo as in ZBXNEXT-9622, also could try launching with tcmalloc and seeing what consumes most memory. Maybe lots of data is receiving by preprocessing manager and from VMware, thought it could be possible that it even does not have preprocessing.
|
|
vso, now we deploy additional VM for Zabbix Proxy for VMware monitoring to determine exactly that it is VMware monitoring. Next, there is an idea to disable some items to understand which one exactly leads to problems.
|
|
Looks like problem somewhere in VMware Guest template. Memory leak moves to a new proxy for VMware monitoring.
Interesting that temporary disable all items in VMware Guest stops memory consumption increase.
|
|
Maybe it's related to ZBX-25584 ? What version is used on Zabbix proxy ? Is there something unusual in diaginfo ?
|
|
I use 7.0.8. I will analyze diaginfo and will try to find item which when disabled, the memory is stabilized.
Can anyone here who uses zabbix confirm that you use VMware monitoring also?
|
|
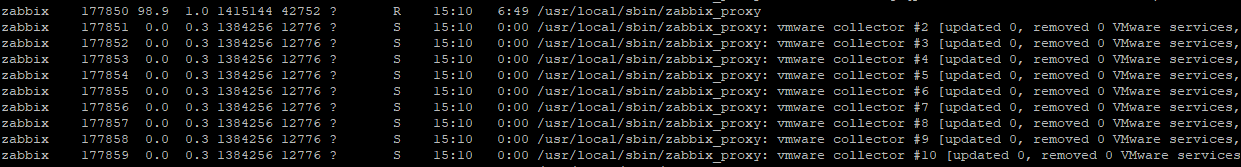
A see lots of "allocated memory" messages in preprocessing worker log. Hundreds time/sec. Much much more than on other proxy where is no memory leak.
cat /var/log/zabbix/zabbix_proxy.log | grep "allocated"
783020:20250203:154605.055 [10] End of zbx_es_execute():SUCCEED  allocated memory: 114854 max allocated or requested memory: 116348 max allowed memory: 536870912
783020:20250203:154605.055 [10] End of zbx_es_execute():SUCCEED  allocated memory: 114854 max allocated or requested memory: 116348 max allowed memory: 536870912
783020:20250203:154605.056 [10] End of zbx_es_execute():SUCCEED  allocated memory: 114854 max allocated or requested memory: 116348 max allowed memory: 536870912
783020:20250203:154605.056 [10] End of zbx_es_execute():SUCCEED  allocated memory: 114854 max allocated or requested memory: 116348 max allowed memory: 536870912
783020:20250203:154605.056 [10] End of zbx_es_execute():SUCCEED  allocated memory: 114854 max allocated or requested memory: 116348 max allowed memory: 536870912
783020:20250203:154605.056 [10] End of zbx_es_execute():SUCCEED  allocated memory: 114854 max allocated or requested memory: 116348 max allowed memory: 536870912
783020:20250203:154605.057 [10] End of zbx_es_execute():SUCCEED  allocated memory: 114854 max allocated or requested memory: 116348 max allowed memory: 536870912
783020:20250203:154605.057 [9] End of zbx_es_execute():SUCCEED  allocated memory: 116018 max allocated or requested memory: 117512 max allowed memory: 536870912
783020:20250203:154605.057 [9] End of zbx_es_execute():SUCCEED  allocated memory: 116018 max allocated or requested memory: 117512 max allowed memory: 536870912
783020:20250203:154605.058 [5] End of zbx_es_execute():SUCCEED  allocated memory: 114854 max allocated or requested memory: 116348 max allowed memory: 536870912
783020:20250203:154605.058 [5] End of zbx_es_execute():SUCCEED  allocated memory: 114854 max allocated or requested memory: 116348 max allowed memory: 536870912
783020:20250203:154605.059 [5] End of zbx_es_execute():SUCCEED  allocated memory: 114854 max allocated or requested memory: 116348 max allowed memory: 536870912
783020:20250203:154605.059 [5] End of zbx_es_execute():SUCCEED  allocated memory: 114854 max allocated or requested memory: 116348 max allowed memory: 536870912
783020:20250203:154605.060 [11] End of zbx_es_execute():SUCCEED  allocated memory: 114854 max allocated or requested memory: 116348 max allowed memory: 536870912
783020:20250203:154605.060 [11] End of zbx_es_execute():SUCCEED  allocated memory: 114854 max allocated or requested memory: 116348 max allowed memory: 536870912
783020:20250203:154605.060 [9] End of zbx_es_execute():SUCCEED  allocated memory: 116018 max allocated or requested memory: 117512 max allowed memory: 536870912
783020:20250203:154605.061 [5] End of zbx_es_execute():SUCCEED  allocated memory: 114854 max allocated or requested memory: 205082 max allowed memory: 536870912
783020:20250203:154605.062 [5] End of zbx_es_execute():SUCCEED  allocated memory: 114854 max allocated or requested memory: 116348 max allowed memory: 536870912
783020:20250203:154605.062 [5] End of zbx_es_execute():SUCCEED  allocated memory: 114854 max allocated or requested memory: 116348 max allowed memory: 536870912
783020:20250203:154605.062 [5] End of zbx_es_execute():SUCCEED  allocated memory: 114854 max allocated or requested memory: 116348 max allowed memory: 536870912
783020:20250203:154605.063 [8] End of zbx_es_execute():SUCCEED  allocated memory: 114854 max allocated or requested memory: 116348 max allowed memory: 536870912
783020:20250203:154605.063 [8] End of zbx_es_execute():SUCCEED  allocated memory: 114854 max allocated or requested memory: 116348 max allowed memory: 536870912
783020:20250203:154605.063 [8] End of zbx_es_execute():SUCCEED  allocated memory: 114854 max allocated or requested memory: 116348 max allowed memory: 536870912
783020:20250203:154605.063 [8] End of zbx_es_execute():SUCCEED  allocated memory: 114854 max allocated or requested memory: 116348 max allowed memory: 536870912
783020:20250203:154605.064 [8] End of zbx_es_execute():SUCCEED  allocated memory: 114854 max allocated or requested memory: 116348 max allowed memory: 536870912
783020:20250203:154605.064 [8] End of zbx_es_execute():SUCCEED  allocated memory: 114854 max allocated or requested memory: 116348 max allowed memory: 536870912
783020:20250203:154605.064 [8] End of zbx_es_execute():SUCCEED  allocated memory: 114854 max allocated or requested memory: 116173 max allowed memory: 536870912
783020:20250203:154605.064 [8] End of zbx_es_execute():SUCCEED  allocated memory: 114854 max allocated or requested memory: 116348 max allowed memory: 536870912
783020:20250203:154605.065 [8] End of zbx_es_execute():SUCCEED  allocated memory: 114854 max allocated or requested memory: 116348 max allowed memory: 536870912
783020:20250203:154605.065 [8] End of zbx_es_execute():SUCCEED  allocated memory: 114854 max allocated or requested memory: 116348 max allowed memory: 536870912
783020:20250203:154605.065 [8] End of zbx_es_execute():SUCCEED  allocated memory: 114854 max allocated or requested memory: 116348 max allowed memory: 536870912
783020:20250203:154605.066 [2] End of zbx_es_execute():SUCCEED  allocated memory: 114854 max allocated or requested memory: 116348 max allowed memory: 536870912
783020:20250203:154605.066 [12] End of zbx_es_execute():SUCCEED  allocated memory: 114854 max allocated or requested memory: 116348 max allowed memory: 536870912
783020:20250203:154605.066 [7] End of zbx_es_execute():SUCCEED  allocated memory: 114854 max allocated or requested memory: 116348 max allowed memory: 536870912
783020:20250203:154605.066 [15] End of zbx_es_execute():SUCCEED  allocated memory: 114854 max allocated or requested memory: 116348 max allowed memory: 536870912
783020:20250203:154605.067 [15] End of zbx_es_execute():SUCCEED  allocated memory: 114854 max allocated or requested memory: 116348 max allowed memory: 536870912
783020:20250203:154605.067 [8] End of zbx_es_execute():SUCCEED  allocated memory: 114854 max allocated or requested memory: 116348 max allowed memory: 536870912
783020:20250203:154605.068 [8] End of zbx_es_execute():SUCCEED  allocated memory: 114854 max allocated or requested memory: 116348 max allowed memory: 536870912
783020:20250203:154605.068 [8] End of zbx_es_execute():SUCCEED  allocated memory: 114854 max allocated or requested memory: 116348 max allowed memory: 536870912
783020:20250203:154605.068 [2] End of zbx_es_execute():SUCCEED  allocated memory: 114854 max allocated or requested memory: 116348 max allowed memory: 536870912
783020:20250203:154605.068 [2] End of zbx_es_execute():SUCCEED  allocated memory: 114854 max allocated or requested memory: 116348 max allowed memory: 536870912
783020:20250203:154605.069 [4] End of zbx_es_execute():SUCCEED  allocated memory: 114854 max allocated or requested memory: 116348 max allowed memory: 536870912
783020:20250203:154605.069 [4] End of zbx_es_execute():SUCCEED  allocated memory: 114854 max allocated or requested memory: 116348 max allowed memory: 536870912
783020:20250203:154605.070 [4] End of zbx_es_execute():SUCCEED  allocated memory: 114854 max allocated or requested memory: 116348 max allowed memory: 536870912
783020:20250203:154605.070 [4] End of zbx_es_execute():SUCCEED  allocated memory: 114854 max allocated or requested memory: 116348 max allowed memory: 536870912
783020:20250203:154605.070 [4] End of zbx_es_execute():SUCCEED  allocated memory: 114854 max allocated or requested memory: 116348 max allowed memory: 536870912
783020:20250203:154605.071 [4] End of zbx_es_execute():SUCCEED  allocated memory: 114854 max allocated or requested memory: 116348 max allowed memory: 536870912
783020:20250203:154605.071 [4] End of zbx_es_execute():SUCCEED  allocated memory: 114854 max allocated or requested memory: 116348 max allowed memory: 536870912
783020:20250203:154605.071 [14] End of zbx_es_execute():SUCCEED  allocated memory: 114854 max allocated or requested memory: 116348 max allowed memory: 536870912
783020:20250203:154605.072 [12] End of zbx_es_execute():SUCCEED  allocated memory: 114854 max allocated or requested memory: 116348 max allowed memory: 536870912
783020:20250203:154605.072 [5] End of zbx_es_execute():SUCCEED  allocated memory: 114854 max allocated or requested memory: 116348 max allowed memory: 536870912
783020:20250203:154605.072 [3] End of zbx_es_execute():SUCCEED  allocated memory: 114854 max allocated or requested memory: 116348 max allowed memory: 536870912
783020:20250203:154605.072 [10] End of zbx_es_execute():SUCCEED  allocated memory: 114854 max allocated or requested memory: 116348 max allowed memory: 536870912
783020:20250203:154605.073 [6] End of zbx_es_execute():SUCCEED  allocated memory: 114854 max allocated or requested memory: 116348 max allowed memory: 536870912
783020:20250203:154605.074 [9] End of zbx_es_execute():SUCCEED  allocated memory: 116018 max allocated or requested memory: 117512 max allowed memory: 536870912
783020:20250203:154605.075 [2] End of zbx_es_execute():SUCCEED  allocated memory: 114854 max allocated or requested memory: 116348 max allowed memory: 536870912
783020:20250203:154605.075 [7] End of zbx_es_execute():SUCCEED  allocated memory: 114854 max allocated or requested memory: 116348 max allowed memory: 536870912
783020:20250203:154605.076 [13] End of zbx_es_execute():SUCCEED  allocated memory: 114854 max allocated or requested memory: 116348 max allowed memory: 536870912
783020:20250203:154605.076 [4] End of zbx_es_execute():SUCCEED  allocated memory: 114854 max allocated or requested memory: 116348 max allowed memory: 536870912
783020:20250203:154605.077 [16] End of zbx_es_execute():SUCCEED  allocated memory: 114854 max allocated or requested memory: 116348 max allowed memory: 536870912
783020:20250203:154605.077 [15] End of zbx_es_execute():SUCCEED  allocated memory: 114854 max allocated or requested memory: 116348 max allowed memory: 536870912
783020:20250203:154605.078 [1] End of zbx_es_execute():SUCCEED  allocated memory: 114854 max allocated or requested memory: 116348 max allowed memory: 536870912
zabbix_proxy -R diaginfo
== history cache diagnostic information ==
Items:0 values:0 time:0.000022
Memory.data:
  size: free:16776832 used:0
  chunks: free:1 used:0 min:16776832 max:16776832
    buckets:
      256+:1
Memory.index:
  size: free:16704104 used:72632
  chunks: free:2 used:4 min:164776 max:16539328
    buckets:
      256+:2
Top.values:
==
== preprocessing diagnostic information ==
Cached items:20454 pending tasks:0 finished tasks:0 task sequences:0 time:0.001537
Top.sequences:
Top.peak:
  itemid:9009500 tasks:2
  itemid:8977370 tasks:2
  itemid:8963168 tasks:2
  itemid:8973320 tasks:2
  itemid:8962466 tasks:2
  itemid:8428893 tasks:2
  itemid:8970350 tasks:2
  itemid:9110179 tasks:2
  itemid:8980556 tasks:2
  itemid:8966624 tasks:2
  itemid:8966084 tasks:2
  itemid:8995190 tasks:2
  itemid:8966840 tasks:2
  itemid:8428902 tasks:2
  itemid:8977694 tasks:2
  itemid:8976830 tasks:2
  itemid:8988062 tasks:2
  itemid:8981096 tasks:2
  itemid:8995406 tasks:2
  itemid:9002264 tasks:2
  itemid:8984390 tasks:2
  itemid:8999024 tasks:2
  itemid:8959226 tasks:2
  itemid:8984606 tasks:2
  itemid:8428930 tasks:2
==
== locks diagnostic information ==
Locks:
  ZBX_MUTEX_LOG:0x7fe8abe18000
  ZBX_MUTEX_CACHE:0x7fe8abe18028
  ZBX_MUTEX_TRENDS:0x7fe8abe18050
  ZBX_MUTEX_CACHE_IDS:0x7fe8abe18078
  ZBX_MUTEX_SELFMON:0x7fe8abe180a0
  ZBX_MUTEX_CPUSTATS:0x7fe8abe180c8
  ZBX_MUTEX_DISKSTATS:0x7fe8abe180f0
  ZBX_MUTEX_VALUECACHE:0x7fe8abe18118
  ZBX_MUTEX_VMWARE:0x7fe8abe18140
  ZBX_MUTEX_SQLITE3:0x7fe8abe18168
  ZBX_MUTEX_PROCSTAT:0x7fe8abe18190
  ZBX_MUTEX_PROXY_HISTORY:0x7fe8abe181b8
  ZBX_MUTEX_MODBUS:0x7fe8abe181e0
  ZBX_MUTEX_TREND_FUNC:0x7fe8abe18208
  ZBX_MUTEX_REMOTE_COMMANDS:0x7fe8abe18230
  ZBX_MUTEX_PROXY_BUFFER:0x7fe8abe18258
  ZBX_MUTEX_VPS_MONITOR:0x7fe8abe18280
  ZBX_RWLOCK_CONFIG:0x7fe8abe182a8
  ZBX_RWLOCK_CONFIG_HISTORY:0x7fe8abe182e0
  ZBX_RWLOCK_VALUECACHE:0x7fe8abe18318
==
== proxy buffer diagnostic information ==
Memory:
  size: free:16626424 used:106248
  chunks: free:2 used:2758 min:58056 max:16568368
    buckets:
      256+:2
==
|
|
It's javascript preprocessing, can you please provide more details about 9009500 and other items mentioned in diaginfo, note that diaginfo only show 25 most used values, so there could be much more similar items, current suspicion is that for short amount of time there was huge amount of data received but it seems that it was discarded afterwards if it did not affect history write cache. Is event log filtered by javascript preprocessing ?
|
|
There are 3 Get sensors and 22 Get snapshots.
Get sensors have no preprocessing, Get snapshots have only discard unchanged with heartbeat.
|
|
how frequent are those checks ? it seems that this snapshot is large, probably need to think about introducing statistics to display biggest values received by preprocessing manager.
As for now it would be best to investigate top.peak items and see if anything can be done so they are not shown in top.peak as this means that new value came before previous one was processed, meaning that it could be collected more frequently that it's possible to process.
top.peak only shows items with preprocessing
Most probably what is happening is that 22 get snapshots are very big, maybe 100 MB each or more and perhaps grow over time.
Also please collect how busy is preprocessing worker, please provide as much internal monitoring graphs as possible.
|
|
Get snapshots value takes every hour on each VM. 1000 VMs, so 1000 values per hour for whole Zabbix Proxy.
Get sensors value takes every minute on each hypervisor. 56 HV, so 56 values per minute.
Get snapshot returns json about VM snapshot, which creates during VM backup. Most of the time it returns empty because of no snapshot exists. It returns results like
{"snapshot":[{"name":"Acronis_Tue Feb 04 03:42:10 2025","description":"","createtime":"2025-02-04T00:42:12.918158Z","size":8468172927177,"uniquesize":8468172927177}],"count":1,"latestdate":"2025-02-04T00:42:12.918158Z","latestage":20893,"oldestdate":"2025-02-04T00:42:12.918158Z","oldestage":20893,"size":8468172927177,"uniquesize":8468172927177}
Get sensors is bigger - 32 kbyte of json, i wont quote it here.
I will try disable both this items.
|
|
After Server/Proxy restart some time memory is stable, but something happening and leak begins near 20:00.
Can it be interesting for you to do a confcall to collect some diagnostics data?
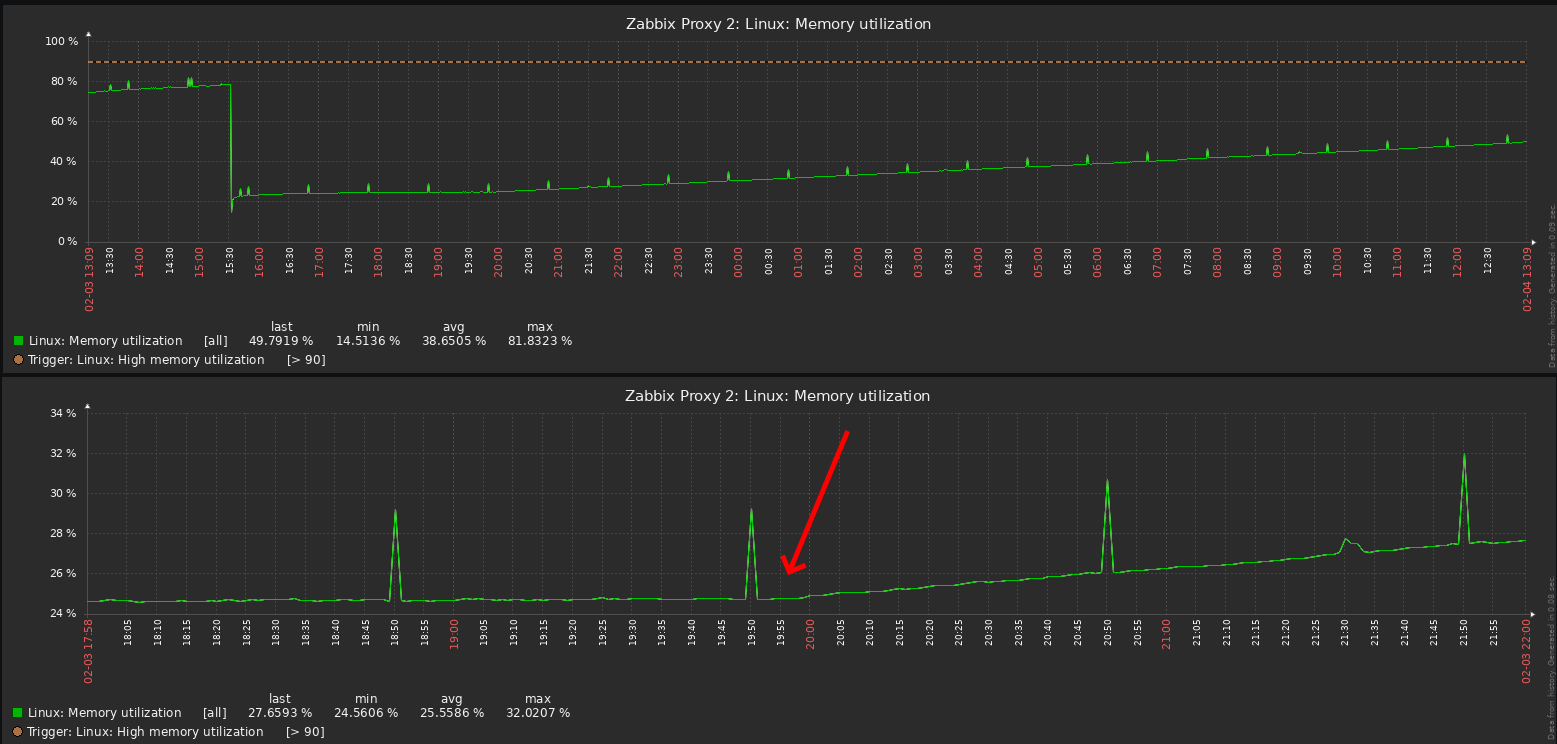
cat /var/log/zabbix/zabbix_proxy.log | grep "20250203:19"
783022:20250203:190311.165 executing housekeeper
783022:20250203:190311.171 housekeeper [deleted 0 records in 0.000181 sec, idle for 1 hour(s)]
783011:20250203:190416.688 received configuration data from server at "srv-zabbix-01.parfum3.local", datalen 73941
783011:20250203:190518.089 received configuration data from server at "srv-zabbix-01.parfum3.local", datalen 66020
783011:20250203:190741.104 received configuration data from server at "srv-zabbix-01.parfum3.local", datalen 145033
783011:20250203:192935.552 received configuration data from server at "srv-zabbix-01.parfum3.local", datalen 51125
783011:20250203:194108.154 received configuration data from server at "srv-zabbix-01.parfum3.local", datalen 28826
783022:20250203:200311.192 executing housekeeper
783022:20250203:200311.197 housekeeper [deleted 0 records in 0.000186 sec, idle for 1 hour(s)]
783011:20250203:200423.813 received configuration data from server at "srv-zabbix-01.parfum3.local", datalen 73941
783011:20250203:200545.834 received configuration data from server at "srv-zabbix-01.parfum3.local", datalen 145339
783011:20250203:200606.235 received configuration data from server at "srv-zabbix-01.parfum3.local", datalen 64865
783011:20250203:200707.426 received configuration data from server at "srv-zabbix-01.parfum3.local", datalen 67135
783011:20250203:201344.915 received configuration data from server at "srv-zabbix-01.parfum3.local", datalen 145643
783011:20250203:201941.611 received configuration data from server at "srv-zabbix-01.parfum3.local", datalen 145337
783011:20250203:202548.629 received configuration data from server at "srv-zabbix-01.parfum3.local", datalen 145643
783011:20250203:202639.504 received configuration data from server at "srv-zabbix-01.parfum3.local", datalen 145337
783011:20250203:203458.895 received configuration data from server at "srv-zabbix-01.parfum3.local", datalen 53423
783011:20250203:203640.839 received configuration data from server at "srv-zabbix-01.parfum3.local", datalen 145643
783011:20250203:203843.082 received configuration data from server at "srv-zabbix-01.parfum3.local", datalen 145031
783011:20250203:204045.306 received configuration data from server at "srv-zabbix-01.parfum3.local", datalen 144727
|
|
As mentioned here it's possible to try finding root cause with tcmalloc but it might be tricky:
When compiling do not strip debug symbols also best to compile with following CFLAGS:
Run with tcmalloc
LD_PRELOAD="/usr/lib/aarch64-linux-gnu/libtcmalloc.so" HEAPPROFILE=./heap_profile HEAP_PROFILE_ALLOCATION_INTERVAL=0 HEAP_PROFILE_INUSE_INTERVAL=4294967296 HEAPPROFILESIGNAL=5 MALLOCSTATS=1 ./sbin/zabbix_server -f -c /etc/zabbix/zabbix_server.conf
Identify pid that is consuming lots of memory and make it dump profiling, replace 2724852 with pid of preprocessing manager as an example:
Then print profile:
google-pprof -text ./sbin/zabbix_server ./heap_profile.0001.heap
Using local file ./sbin/zabbix_server.
Using local file ./heap_profile.0001.heap.
Total: 1078.1 MB
  1076.8  99.9%  99.9%   1076.8  99.9% zbx_malloc2
     1.0   0.1% 100.0%      1.0   0.1% __GI___strdup
     0.2   0.0% 100.0%      0.2   0.0% CRYPTO_zalloc@@OPENSSL_3.0.0
     0.1   0.0% 100.0%      0.1   0.0% OPENSSL_LH_insert@@OPENSSL_3.0.0
     0.0   0.0% 100.0%      0.0   0.0% zbx_realloc2
     0.0   0.0% 100.0%      0.1   0.0% PKCS7_decrypt@@OPENSSL_3.0.0
     0.0   0.0% 100.0%      0.0   0.0% find_best_tree_node
     0.0   0.0% 100.0%      0.0   0.0% CRYPTO_strndup@@OPENSSL_3.0.0
We can try also enhancing diaginfo with memory usage statistics, are you open to test the patch ?
|
|
Yes. I think I am open to test the patch. Please note that we use a Proxy to reduce the impact of service restarts. We will deploy an additional VM and build a debugging version of the Proxy there.
|
|
I build proxy with CFLAGS and it start and collect vmware metrics successfully.
But when I start it with
LD_PRELOAD="/usr/lib64/libtcmalloc.so" HEAPPROFILE=./heap_profile HEAP_PROFILE_ALLOCATION_INTERVAL=0 HEAP_PROFILE_INUSE_INTERVAL=4294967296 HEAPPROFILESIGNAL=5 MALLOCSTATS=1 /usr/local/sbin/zabbix_proxy
vmware collector #1 process utilizes 100% of CPU and cannot get data. In zabbix web gui this proxy show offline after some time. task manager, history syncer, data sender and configuration syncer processeses report overload.
Maybe it is necessary to change some of the above heap parameters?
|
|
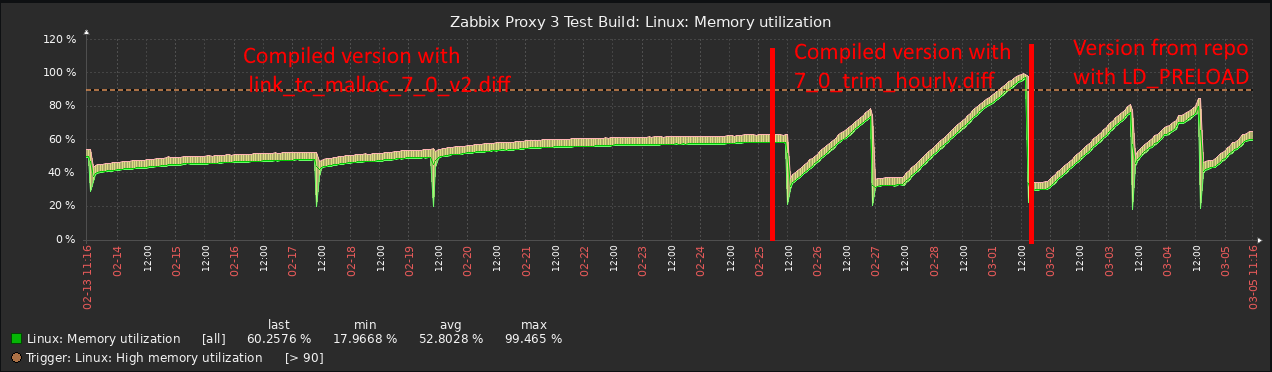
I am sorry to hear that, then only option is to compile with following patch link_tc_malloc_7_0_v2.diff then when there is memory problem:
./sbin/zabbix_proxy -R diaginfo="preprocessing"
google-pprof -text ./sbin/zabbix_proxy ./pp_manager.0001.heap
Should check latest ./pp_manager.0001.heap, number can be higher
zabbix proxy should be launched as usually, just "/usr/local/sbin/zabbix_proxy"
If performance will be bottleneck then can try 7_0_trim_hourly.diff this patch will not affect performance and will attempt to release memory back to system every hour.
Have you checked if there are eventlog items that send lots of data ?
|
|
Compiled successfully and work well. Let's wait for high memory consumption.
|
|
Still no memory leak. I'll try to restart Proxy.
|
|
It can be due to this change in patch that will trim memory every hour:
if (SEC_PER_HOUR <= sec - time_trim)
It can be changed back to SEC_PER_DAY to see if trimming memory every hour helps with the issue or just try 7_0_trim_hourly.diff
|
|
Ok. I will wait 24 hrs and than turn back release memory in case of peak periods
|
|
I turn back release memory in case of peak periods from hour to day and wait for a week, but memory does not leak on the version compiled from sources.
During compiling i've installed some required packages. Could it be that I build with some other versions of libraries?
sqlite-devel 3.26.0-19.el8_9
sqlite-libs 3.26.0-19.el8_9
net-snmp-devel 1:5.8-30.el8
libssh2-devel 1.10.0-1.el8
libevent-devel 2.1.8-5.el8
pcre-devel 8.42-6.el8
libxml2-devel 2.9.7-18.el8_10.1
libcurl-devel 7.61.1-34.el8_10.2
gperftools-libs 1:2.7-9.el8
gperftools 1:2.7-9.el8
automake 1.16.1-8.el8
|
|
It's highly unlikely, maybe due to optimization options, what kind of CFLAGS were used during compilation ? Please also share ldd ./zabbix_proxy
|
|
Looks like CFLAGS has been lost beetween compilations and was not set. Should I recompile with the flag CFLAGS=-g -O0?
ldd /usr/local/sbin/zabbix_proxy
        linux-vdso.so.1 (0x00007fff60fb9000)
        libsqlite3.so.0 => /lib64/libsqlite3.so.0 (0x00007fe456cd3000)
        libxml2.so.2 => /lib64/libxml2.so.2 (0x00007fe45696b000)
        libnetsnmp.so.35 => /lib64/libnetsnmp.so.35 (0x00007fe4565bf000)
        libssh2.so.1 => /lib64/libssh2.so.1 (0x00007fe45637f000)
        libz.so.1 => /lib64/libz.so.1 (0x00007fe456167000)
        libpthread.so.0 => /lib64/libpthread.so.0 (0x00007fe455f47000)
        libevent_core-2.1.so.6 => /lib64/libevent_core-2.1.so.6 (0x00007fe455d0e000)
        libevent_extra-2.1.so.6 => /lib64/libevent_extra-2.1.so.6 (0x00007fe455aea000)
        libevent_pthreads-2.1.so.6 => /lib64/libevent_pthreads-2.1.so.6 (0x00007fe4558e7000)
        libcurl.so.4 => /lib64/libcurl.so.4 (0x00007fe455658000)
        libtcmalloc.so.4 => /lib64/libtcmalloc.so.4 (0x00007fe45525c000)
        libm.so.6 => /lib64/libm.so.6 (0x00007fe454eda000)
        libdl.so.2 => /lib64/libdl.so.2 (0x00007fe454cd6000)
        libresolv.so.2 => /lib64/libresolv.so.2 (0x00007fe454abe000)
        libpcre.so.1 => /lib64/libpcre.so.1 (0x00007fe45484d000)
        libc.so.6 => /lib64/libc.so.6 (0x00007fe454477000)
        liblzma.so.5 => /lib64/liblzma.so.5 (0x00007fe454250000)
        libssl.so.1.1 => /lib64/libssl.so.1.1 (0x00007fe453fbb000)
        libcrypto.so.1.1 => /lib64/libcrypto.so.1.1 (0x00007fe453ad0000)
        /lib64/ld-linux-x86-64.so.2 (0x00007fe456fe7000)
        libnghttp2.so.14 => /lib64/libnghttp2.so.14 (0x00007fe4538a9000)
        libidn2.so.0 => /lib64/libidn2.so.0 (0x00007fe45368b000)
        libssh.so.4 => /lib64/libssh.so.4 (0x00007fe45341b000)
        libpsl.so.5 => /lib64/libpsl.so.5 (0x00007fe45320a000)
        libgssapi_krb5.so.2 => /lib64/libgssapi_krb5.so.2 (0x00007fe452fb5000)
        libkrb5.so.3 => /lib64/libkrb5.so.3 (0x00007fe452cca000)
        libk5crypto.so.3 => /lib64/libk5crypto.so.3 (0x00007fe452ab3000)
        libcom_err.so.2 => /lib64/libcom_err.so.2 (0x00007fe4528af000)
        libldap-2.4.so.2 => /lib64/libldap-2.4.so.2 (0x00007fe452660000)
        liblber-2.4.so.2 => /lib64/liblber-2.4.so.2 (0x00007fe452450000)
        libbrotlidec.so.1 => /lib64/libbrotlidec.so.1 (0x00007fe452243000)
        libunwind.so.8 => /lib64/libunwind.so.8 (0x00007fe45202b000)
        libstdc++.so.6 => /lib64/libstdc++.so.6 (0x00007fe451c96000)
        libgcc_s.so.1 => /lib64/libgcc_s.so.1 (0x00007fe451a7e000)
        libunistring.so.2 => /lib64/libunistring.so.2 (0x00007fe4516fd000)
        librt.so.1 => /lib64/librt.so.1 (0x00007fe4514f5000)
        libkrb5support.so.0 => /lib64/libkrb5support.so.0 (0x00007fe4512e4000)
        libkeyutils.so.1 => /lib64/libkeyutils.so.1 (0x00007fe4510e0000)
        libsasl2.so.3 => /lib64/libsasl2.so.3 (0x00007fe450ec2000)
        libbrotlicommon.so.1 => /lib64/libbrotlicommon.so.1 (0x00007fe450ca1000)
        libselinux.so.1 => /lib64/libselinux.so.1 (0x00007fe450a76000)
        libcrypt.so.1 => /lib64/libcrypt.so.1 (0x00007fe45084d000)
        libpcre2-8.so.0 => /lib64/libpcre2-8.so.0 (0x00007fe4505c9000)
|
|
You have libtcmalloc still linked and it might be the reason why there is no "leak" as it probably handle fragmentation in a better way.
libtcmalloc.so.4 => /lib64/libtcmalloc.so.4 (0x00007fe45525c000)
There is another ticket that could address fragmentation:
ZBX-25752
To confirm this could either try patch or update all javascript to contain some user macro, even if it is not existing and not used, such as {$MACRO}
|
|
Using MACRO is easier for me. And I should also test it on Zabbix packages from repo.
What MACRO should I use?
|
|
Any macro, just {$M} it will not cache javascript if there are macros, however it might not help if there is discard so something to keep in mind.
Currently there are several possible fixes besides more ram it is ZBX-25752, adding trim hourly as mentioned in previous patch or using tcmalloc.
I believe safest option for now is to test if trim hourly helps when built without tcmalloc:
Just try this patch 7_0_trim_hourly.diff
If it helps then we should consider including it in next release and issue should be gone for you and other installations and possibly improved even further by ZBX-25752 so that memory does not grow even within an hour.
|
|
patch 7_0_trim_hourly.diff did not help.
|
|
It appears workaround for now is to use LD_PRELOAD="/usr/lib64/libtcmalloc.so", this should work without needing to recompile.
|
|
I'm having this issue as well on 7.2.4 amazonlinux 2023
|
|
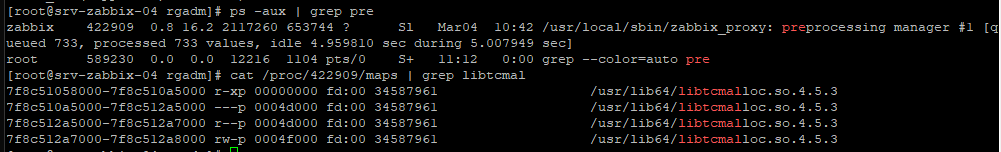
vso, do I understand correctly that if
ldd /usr/local/sbin/zabbix_proxy | grep libtcmalloc
doesn't show libtcmalloc.so, it means the library is not attached?
|
|
If it was launched like this:
LD_PRELOAD="/usr/lib/aarch64-linux-gnu/libtcmalloc.so" ./sbin/zabbix_server -f -c/etc/zabbix/zabbix_server.conf
Then could check with preprocessing manger pid:
cat /proc/3502575/maps | grep
 libtcmalloc
ff1e88800000-ff1e88845000 r-xp 00000000 fd:02 11825622                   /usr/lib/aarch64-linux-gnu/libtcmalloc.so.4.5.16
ff1e88845000-ff1e8885f000 ---p 00045000 fd:02 11825622                   /usr/lib/aarch64-linux-gnu/libtcmalloc.so.4.5.16
ff1e8885f000-ff1e88860000 r--p 0004f000 fd:02 11825622                   /usr/lib/aarch64-linux-gnu/libtcmalloc.so.4.5.16
ff1e88860000-ff1e88861000 rw-p 00050000 fd:02 11825622                   /usr/lib/aarch64-linux-gnu/libtcmalloc.so.4.5.16
|
|
Hm... So then it looks like it doesn't help.
Starting with LD_PRELOAD="/usr/lib64/libtcmalloc.so" /usr/local/sbin/zabbix_proxy
|
|
Thank you for detailed analysis, looks like when heap tracking is enabled then it keeps track of memory better so it's freed, lets hope that ZBX-25752 will solve the issue.
|
|
Please provide profiling when tcmalloc with heap profiling was used, maybe there is something interesting
|
|
This also solves the issue in my tests with glibc Dimasmir :
export MALLOC_TRIM_THRESHOLD_=134217728
Another option is to use patch from ZBX-26154 and seeing if zabbix[preprocessing_size] with change per second will indicate large amount of data being sent to preprocessing manager.
|
|
vso
"Please provide profiling when tcmalloc with heap profiling was used, maybe there is something interesting".
Do I understand correctly that I need to execute?
./sbin/zabbix_proxy -R diaginfo="preprocessing"
google-pprof -text ./sbin/zabbix_proxy ./pp_manager.0001.heap
Now I am using version build from source with link_tc_malloc_7_0_v2.diff patch.
Rocky Linux doesn't have google-pprof, only pprof, but I'm having some errors when using it. Am I doing what needs to be done?
"export MALLOC_TRIM_THRESHOLD_=134217728"
This must work with version, downloaded from repo?
|
"export MALLOC_TRIM_THRESHOLD_=134217728"
This must work with version, downloaded from repo?
Yes, it should work from repo but need to set it from same location where zabbix proxy is launched so it's visible, but it's not for tcmalloc, only glibc.
Could also try pprof or attach generated file here. Actually it should periodically write memory usage to log so you can check that to see and print with pprof, also could try applying patch ZBX-26154 to see if there is lots of data pushed to preprocessing manager, new key zabbix[preprocessing_size] is added there.
|
Vladislavs Sokurenko, now we deploy additional VM for Zabbix Proxy for VMware monitoring to determine exactly that it is VMware monitoring. Next, there is an idea to disable some items to understand which one exactly leads to problems.
Was it possible to determine items that caused memory to grow or no exact item Dimasmir ?
Following query can be used to find vmware.eventlog items:
select key_,status from items where key_ like 'vmware.eventlog%' and status=0;
|
|
Disabling all items and discovery rules one by one did not reduce the leakage.

|
|
Memory usage should decrease after ZBX-26693, closing.
|
Generated at Fri May 08 18:13:26 EEST 2026 using Jira 10.3.18#10030018-sha1:5642e4ad348b6c2a83ebdba689d04763a2393cab.