[ZBX-25287] Zabbix Server Crash Created: 2024 Sep 25 Updated: 2024 Dec 20 Resolved: 2024 Oct 08 |
|
| Status: | Closed |
| Project: | ZABBIX BUGS AND ISSUES |
| Component/s: | None |
| Affects Version/s: | 6.0.32 |
| Fix Version/s: | None |
| Type: | Problem report | Priority: | Trivial |
| Reporter: | haven gu | Assignee: | Tomasz Grzechulski |
| Resolution: | Incomplete | Votes: | 0 |
| Labels: | None | ||
| Remaining Estimate: | Not Specified | ||
| Time Spent: | Not Specified | ||
| Original Estimate: | Not Specified | ||
| Environment: |
zabbix 6.0.17 with HA-Manager |
||
| Attachments: |
|
| Description |
|
Steps to reproduce:
Result:
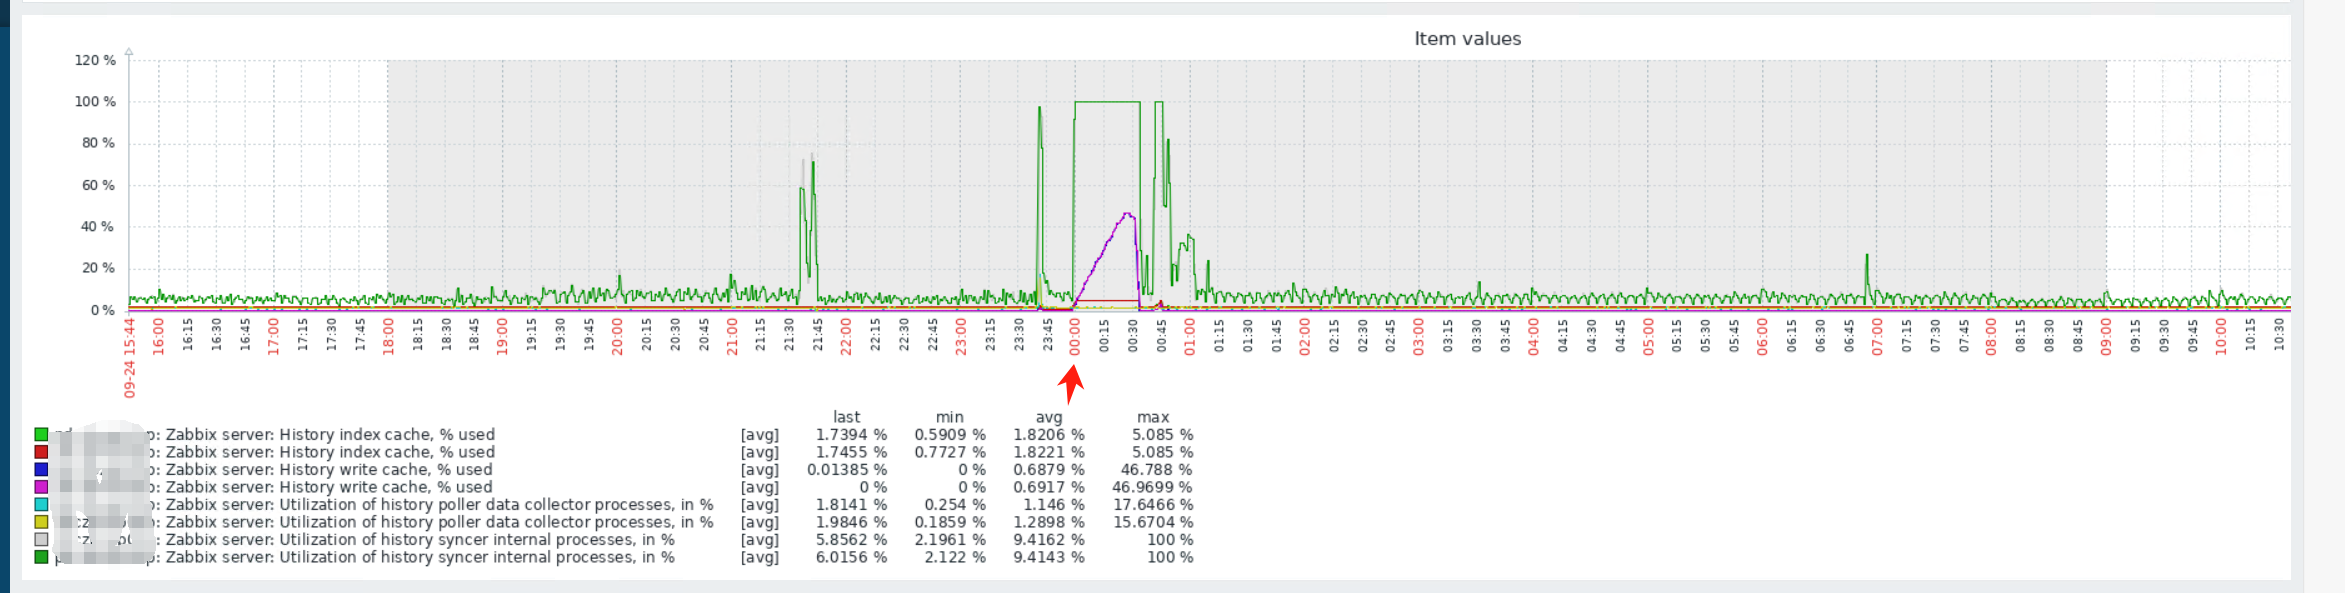
3.After the crash, the first node is start by himself and became a standy node 4. But 20 minutes later, history poller is very busy and cache usage increase and then decrease
Expected: 2. Why history poller High utilization |
| Comments |
| Comment by haven gu [ 2024 Sep 25 ] |
|
1.The zabbix crash log 273963:20240924:234149.119 Got signal [signal:11(SIGSEGV),reason:1,refaddr:0x7]. Crashing ... 3273963:20240924:234149.119 ====== Fatal information: ====== 3273963:20240924:234149.119 Program counter: 0x56240fb7e950 3273963:20240924:234149.120 === Registers: === 3273963:20240924:234149.120 r8 = 562411c13 = 23123270675 = 23123270675 3273963:20240924:234149.120 r9 = 562411b5201a = 94712915894298 = 94712915894298 3273963:20240924:234149.120 r10 = 14fef808 = 352253960 = 352253960 3273963:20240924:234149.120 r11 = 7 = 7 = 7 3273963:20240924:234149.120 r12 = 0 = 0 = 0 3273963:20240924:234149.120 r13 = 2 = 2 = 2 3273963:20240924:234149.121 r14 = 7fff3e005790 = 140734233597840 = 140734233597840 3273963:20240924:234149.121 r15 = 7fff3e005170 = 140734233596272 = 140734233596272 3273963:20240924:234149.122 rdi = 7fff3e005020 = 140734233595936 = 140734233595936 3273963:20240924:234149.122 rsi = 1 = 1 = 1 3273963:20240924:234149.122 rbp = 7fff3e035cb0 = 140734233795760 = 140734233795760 3273963:20240924:234149.122 rbx = 81 = 129 = 129 3273963:20240924:234149.122 rdx = 0 = 0 = 0 3273963:20240924:234149.122 rax = 7 = 7 = 7 3273963:20240924:234149.122 rcx = 0 = 0 = 0 3273963:20240924:234149.123 rsp = 7fff3e0050f0 = 140734233596144 = 140734233596144 3273963:20240924:234149.123 rip = 56240fb7e950 = 94712882522448 = 94712882522448 3273963:20240924:234149.123 efl = 10246 = 66118 = 66118 3273963:20240924:234149.123 csgsfs = 2b000000000033 = 12103423998558259 = 12103423998558259 3273963:20240924:234149.123 err = 4 = 4 = 4 3273963:20240924:234149.123 trapno = e = 14 = 14 3273963:20240924:234149.125 oldmask = 0 = 0 = 0 3273963:20240924:234149.128 cr2 = 7 = 7 = 7 3273963:20240924:234149.130 === Backtrace: === 3181872:20240924:234149.144 One child process died (PID:3273963,exitcode/signal:11). Exiting ... 3181872:20240924:234149.144 PROCESS EXIT: 3273963 3273553:20240924:234149.145 HA manager has been paused 3274634:20240924:234149.574 cannot write to IPC socket: Broken pipe 3274635:20240924:234149.576 cannot write to IPC socket: Broken pipe zabbix_server [3181872]: Error waiting for process with PID 3273963: [10] No child processes 3273553:20240924:234149.637 HA manager has been stopped 3181872:20240924:234149.698 syncing history data... 3181872:20240924:234150.095 syncing history data... 100.000000% 3181872:20240924:234150.095 syncing history data done 3181872:20240924:234150.095 syncing trend data... 3181872:20240924:234230.983 syncing trend data done 3181872:20240924:234231.175 Zabbix Server stopped. Zabbix 6.0.17 (revision c81d82859a8). 3945667:20240924:234241.275 Starting Zabbix Server. Zabbix 6.0.17 (revision c81d82859a8). 3945667:20240924:234241.275 ****** Enabled features ****** 3945667:20240924:234241.275 SNMP monitoring: YES 3945667:20240924:234241.275 IPMI monitoring: YES 3945667:20240924:234241.276 Web monitoring: YES 3945667:20240924:234241.276 VMware monitoring: YES 3945667:20240924:234241.276 SMTP authentication: YES 3945667:20240924:234241.276 ODBC: YES 3945667:20240924:234241.276 SSH support: YES 3945667:20240924:234241.276 IPv6 support: YES 3945667:20240924:234241.276 TLS support: YES 3945667:20240924:234241.277 ****************************** 3945667:20240924:234241.277 using configuration file: /etc/zabbix/zabbix_server.conf 3945667:20240924:234241.412 current database version (mandatory/optional): 06000000/06000020 3945667:20240924:234241.413 required mandatory version: 06000000 3945668:20240924:234241.541 starting HA manager 3945668:20240924:234241.575 HA manager started in standby mode 3945667:20240924:234241.576 "pdczbxap01p" node started in "standby" mode 3945667:20240925:004241.551 "pdczbxap01p" node is working in "standby" mode 3945668:20240925:011000.543 [Z3005] query failed: [0] PGRES_FATAL_ERROR:server closed the connection unexpectedly This probably means the server terminated abnormally before or while processing the request. [begin;] 3945667:20240925:014241.543 "pdczbxap01p" node is working in "standby" mode 3945667:20240925:024241.543 "pdczbxap01p" node is working in "standby" mode 3945667:20240925:034241.543 "pdczbxap01p" node is working in "standby" mode 3945667:20240925:044241.543 "pdczbxap01p" node is working in "standby" mode 2. when high history poller used , I find some slow request in DB, Some requst completed in 949.829426 sec. 2300192:20240925:041306.587 slow query: 4.001480 sec, "select auditid from auditlog where clock<1695672782 order by auditid limit 5000" 2300192:20240925:041309.651 slow query: 3.054834 sec, "select auditid from auditlog where clock<1695672782 order by auditid limit 5000" 2300192:20240925:051313.419 slow query: 3.244738 sec, "select auditid from auditlog where clock<1695676389 order by auditid limit 5000" 2300213:20240925:060025.508 slow query: 950.053324 sec, "select distinct r.druleid,r.iprange,r.name,c.dcheckid,r.proxy_hostid,r.delay from drules r left join dchecks c on c.druleid=r.druleid and c.uniq=1 where r.status=0 and r.nextcheck<=1727214275 and mod(r.druleid,30)=9" 2300192:20240925:061344.638 slow query: 3.824655 sec, "select auditid from auditlog where clock<1695680020 order by auditid limit 5000" 2300192:20240925:081400.171 slow query: 4.105848 sec, "select auditid from auditlog where clock<1695687235 order by auditid limit 5000" 2300192:20240925:081403.241 slow query: 3.045755 sec, "select auditid from auditlog where clock<1695687235 order by auditid limit 5000" 2300213:20240925:081701.603 slow query: 949.829426 sec, "select distinct r.druleid,r.iprange,r.name,c.dcheckid,r.proxy_hostid,r.delay from drules r left join dchecks c on c.druleid=r.druleid and c.uniq=1 where r.status=0 and r.nextcheck<=1727222471 and mod(r.druleid,30)=9" 2300192:20240925:091407.467 slow query: 3.836412 sec, "select auditid from auditlog where clock<1695690843 order by auditid limit 5000" 2300192:20240925:101414.783 slow query: 3.889972 sec, "select auditid from auditlog where clock<1695694450 order by auditid limit 5000" 2300192:20240925:101417.841 slow query: 3.033084 sec, "select auditid from auditlog where clock<1695694450 order by auditid limit 5000" 2300210:20240925:111706.851 slow query: 949.166381 sec, "begin;" 2300212:20240925:115005.219 slow query: 951.956315 sec, "select distinct r.druleid,r.iprange,r.name,c.dcheckid,r.proxy_hostid,r.delay from drules r left join dchecks c on c.druleid=r.druleid and c.uniq=1 where r.status=0 and r.nextcheck<=1727235253 and mod(r.druleid,30)=8" 2300212:20240925:130628.643 slow query: 950.042201 sec, "select distinct r.druleid,r.iprange,r.name,c.dcheckid,r.proxy_hostid,r.delay from drules r left join dchecks c on c.druleid=r.druleid and c.uniq=1 where r.status=0 and r.nextcheck<=1727239838 and mod(r.druleid,30)=8" 2300211:20240925:134458.787 slow query: 951.056993 sec, "begin;" 2300192:20240925:141452.274 slow query: 3.945263 sec, "select auditid from auditlog where clock<1695708888 order by auditid limit 5000" 2300210:20240925:143347.428 slow query: 949.943952 sec, "begin;" 2300246:20240925:145406.230 slow query: 30.970810 sec, "select clock,ns,value from history_uint where itemid=2729021 and clock>1726642415 and clock<=1727245185" 2300192:20240925:161522.296 slow query: 3.374543 sec, "select auditid from auditlog where clock<1695716115 order by auditid limit 5000" |
| Comment by Alexey Pustovalov [ 2024 Sep 26 ] |
|
You use 6.0.17 Zabbix server: 3181872:20240924:234231.175 Zabbix Server stopped. Zabbix 6.0.17 (revision c81d82859a8). 3945667:20240924:234241.275 Starting Zabbix Server. Zabbix 6.0.17 (revision c81d82859a8). Please update Zabbix server to latest 6.0 version |
| Comment by haven gu [ 2024 Sep 26 ] |
|
Thanks for prompt reply . Is this a known issue, and will an upgrade fix it?
|
| Comment by Alexey Pustovalov [ 2024 Sep 26 ] |
|
You did not provide full logs for the crash, but anyway, it is better to update Zabbix server to avoid already fixed crashes. |
| Comment by haven gu [ 2024 Sep 26 ] |
|
This is where I can get all the crash logs, is there a setting I need to change to get full crash logs? |
| Comment by Alexey Pustovalov [ 2024 Sep 26 ] |
|
Please attach Zabbix server log file, not just part of. |
| Comment by haven gu [ 2024 Sep 26 ] |
|
Total log was big, so I upload one hour log without any filter |
| Comment by Alexey Pustovalov [ 2024 Sep 26 ] |
|
Please share: |
| Comment by haven gu [ 2024 Sep 26 ] |
|
| Comment by Tomasz Grzechulski [ 2024 Sep 26 ] |
|
Hello Haven, Considering provided logs, could you also provide us with logs from 24.09 starting from at least 21:30? And since you are using RHEL in version 8.7, which is quite old , same as Zabbix version - are there reasons behind it? Do you consider upgrading both? Thank you, Regards, Tomasz |
| Comment by haven gu [ 2024 Sep 27 ] |
|
Yes. Will consider upgrading the zabbix version to the latest 6.0.x version。In general, the only time I would consider upgrading is if I encountered a security risk or bug, and it has been running very stable for over 1 year. Because zabbix has high availability. master crash will be switched to slave has little impact. But from 00:00 onwards suddenly history syncer poller is 100% busy. at that time the data can not be written to the database. This led to a large number of agent unreachable alert. at this time there are a few sql slow query has reached 900s. but at that time to check the database performance is not very high. i have some confusion.
|
| Comment by Tomasz Grzechulski [ 2024 Sep 27 ] |
|
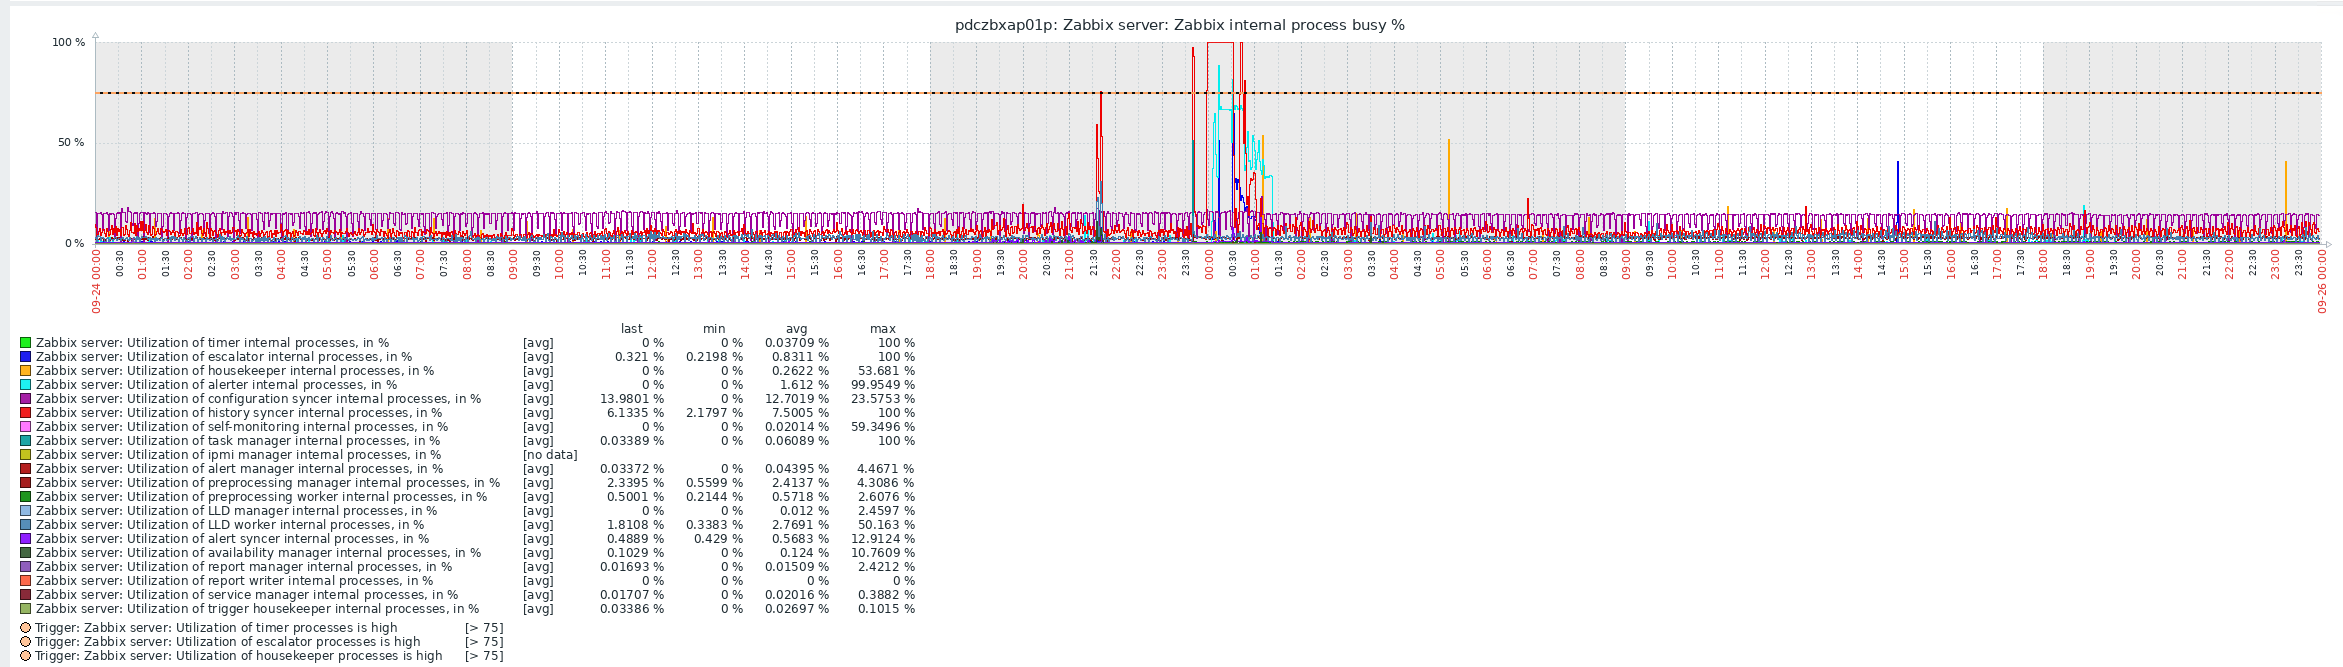
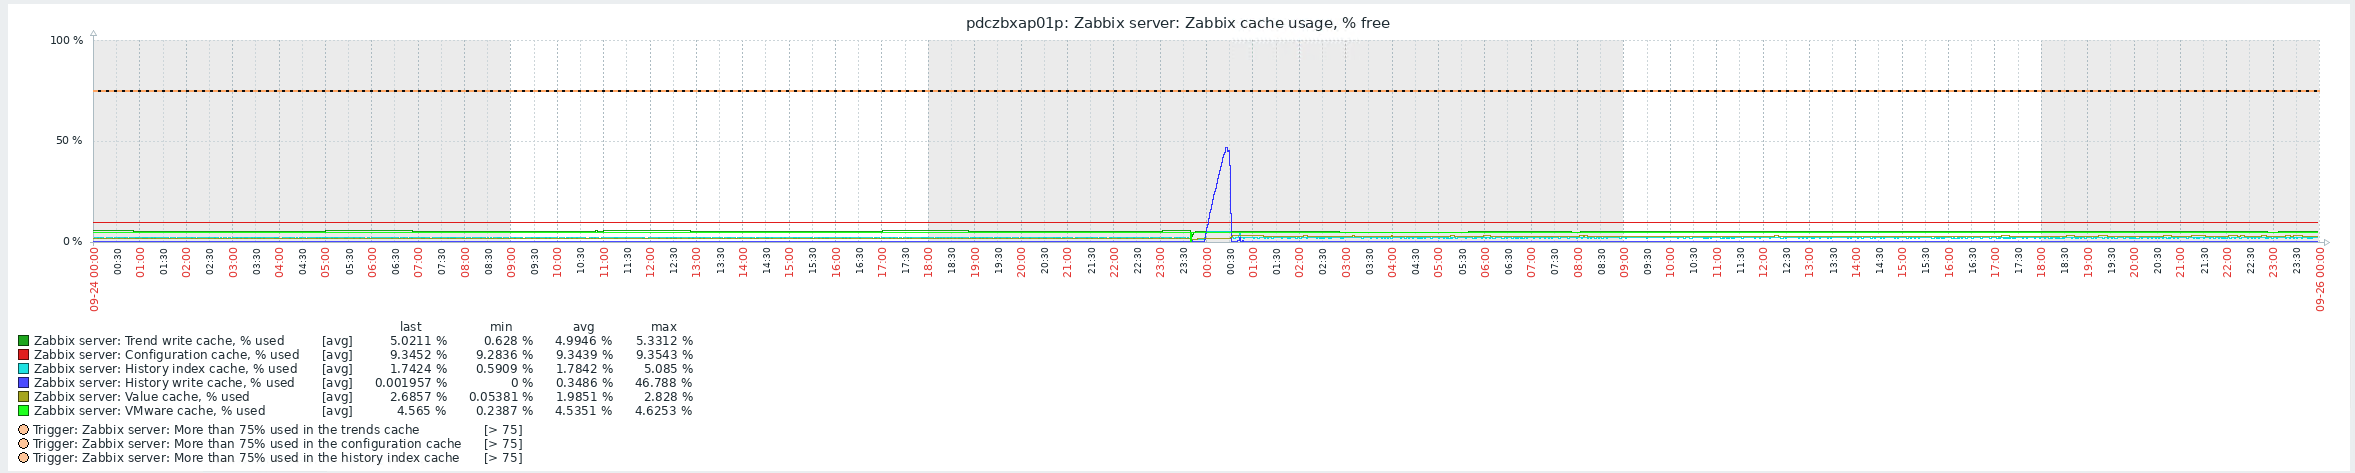
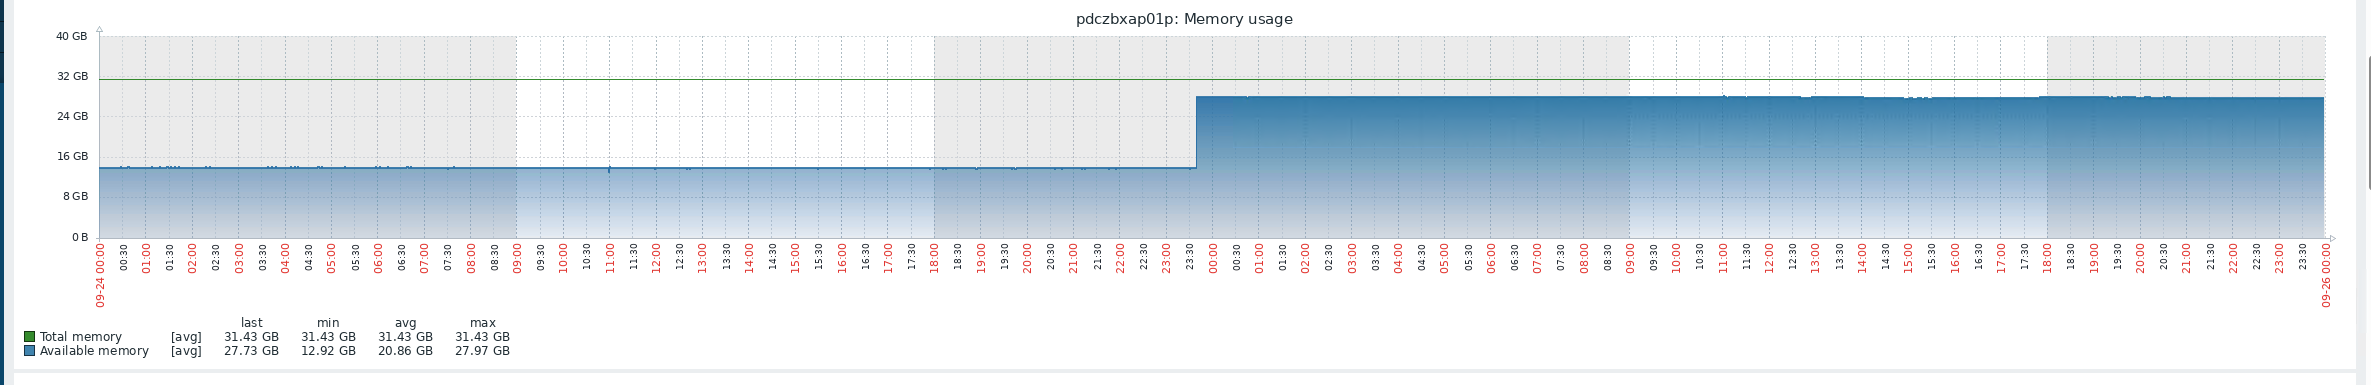
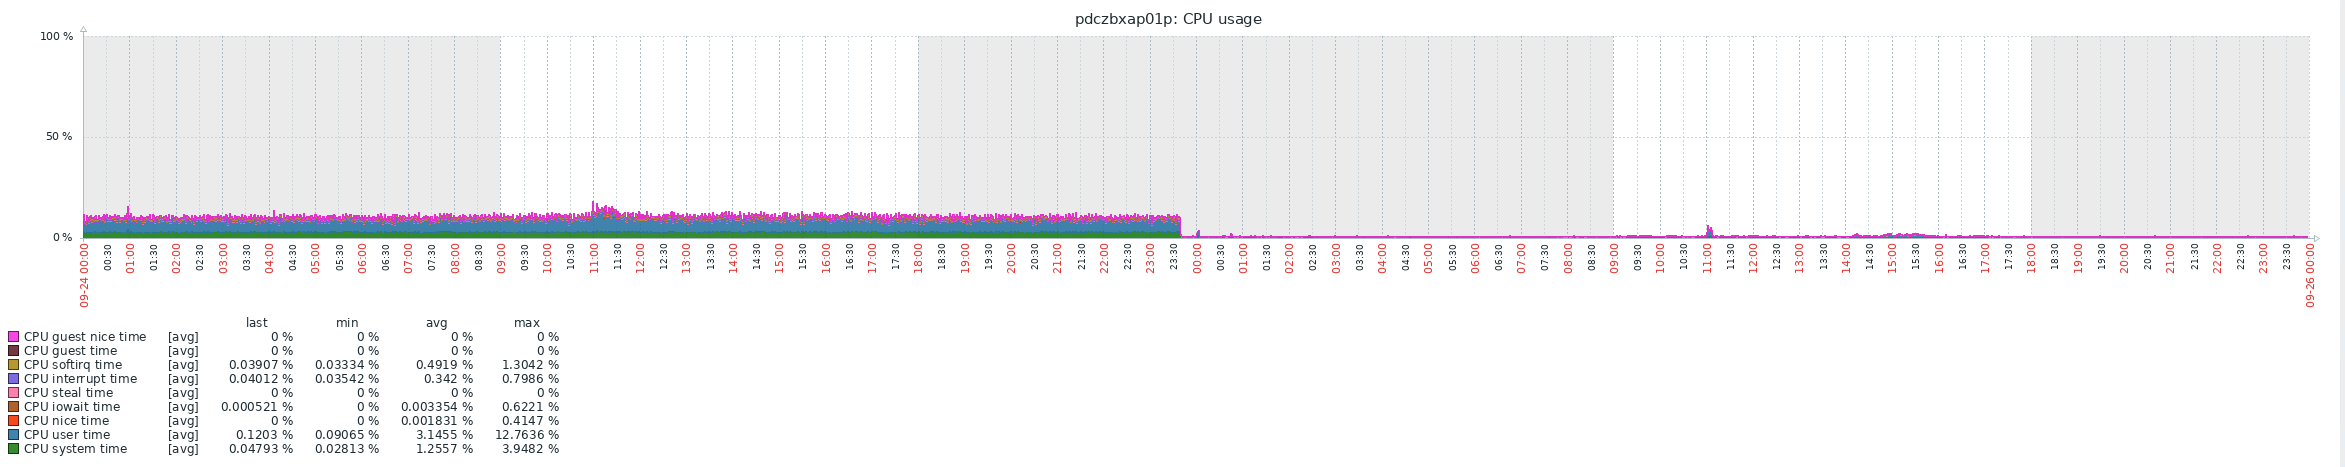
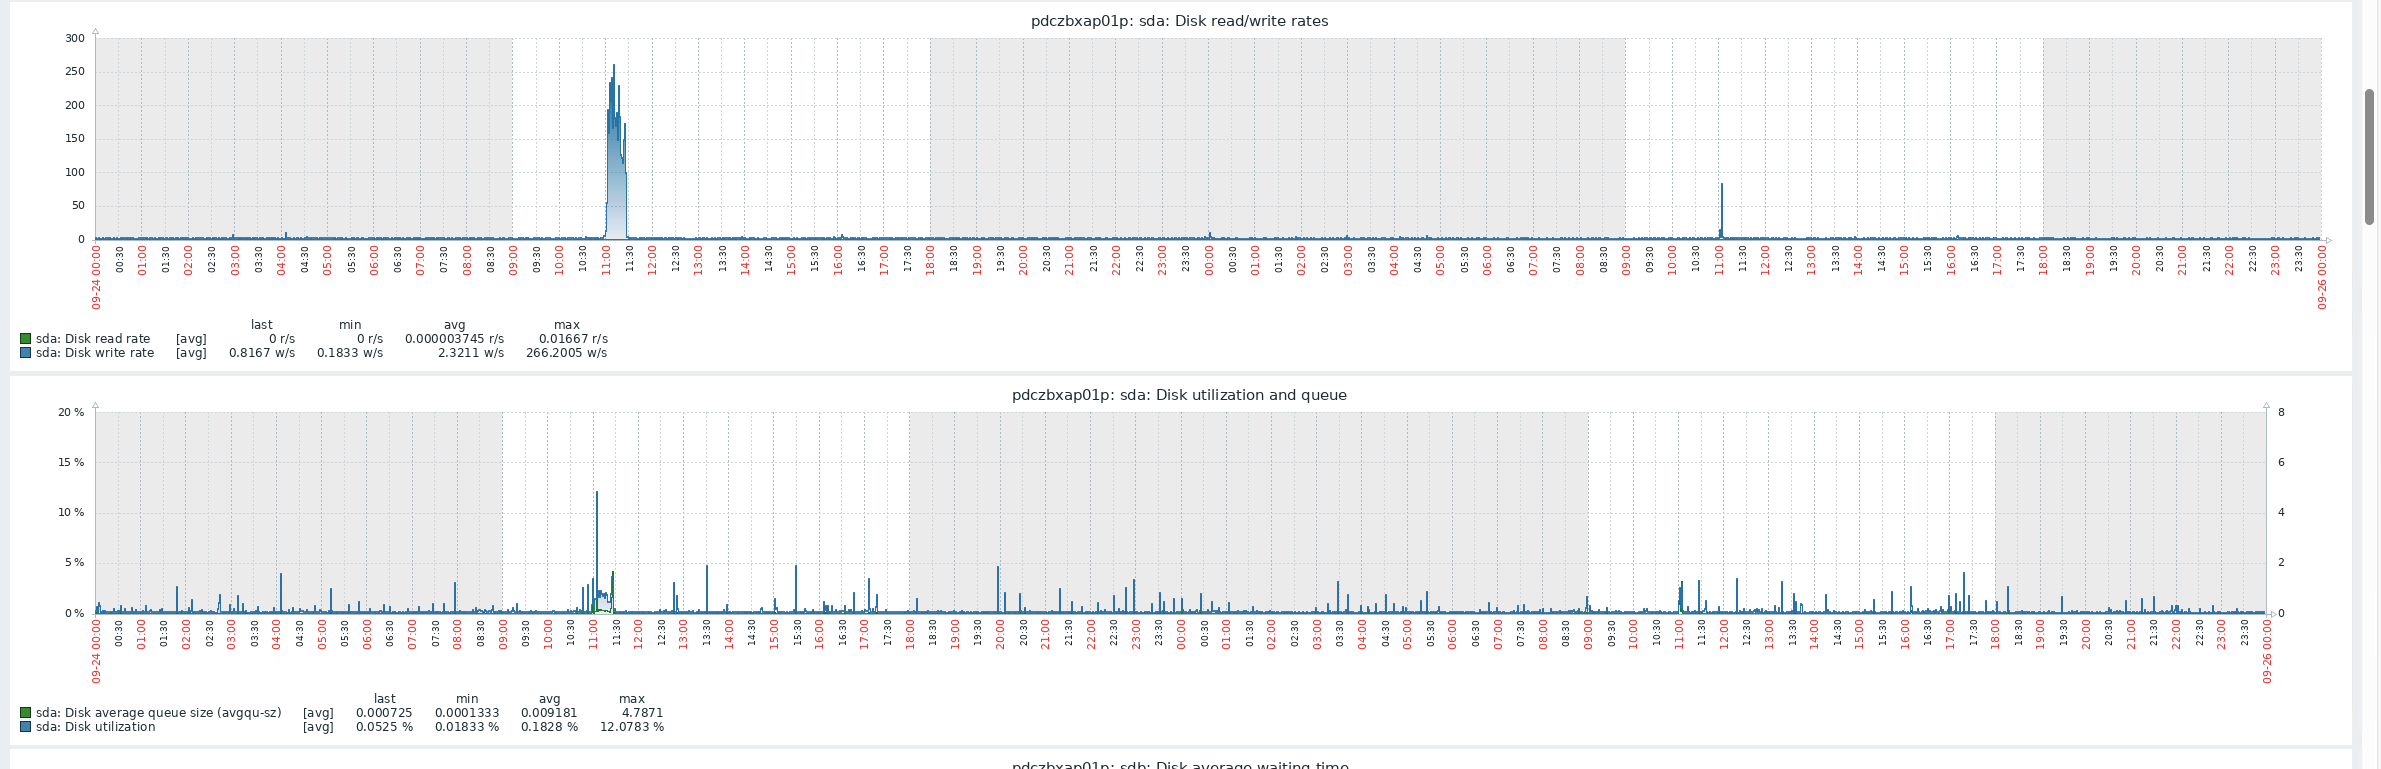
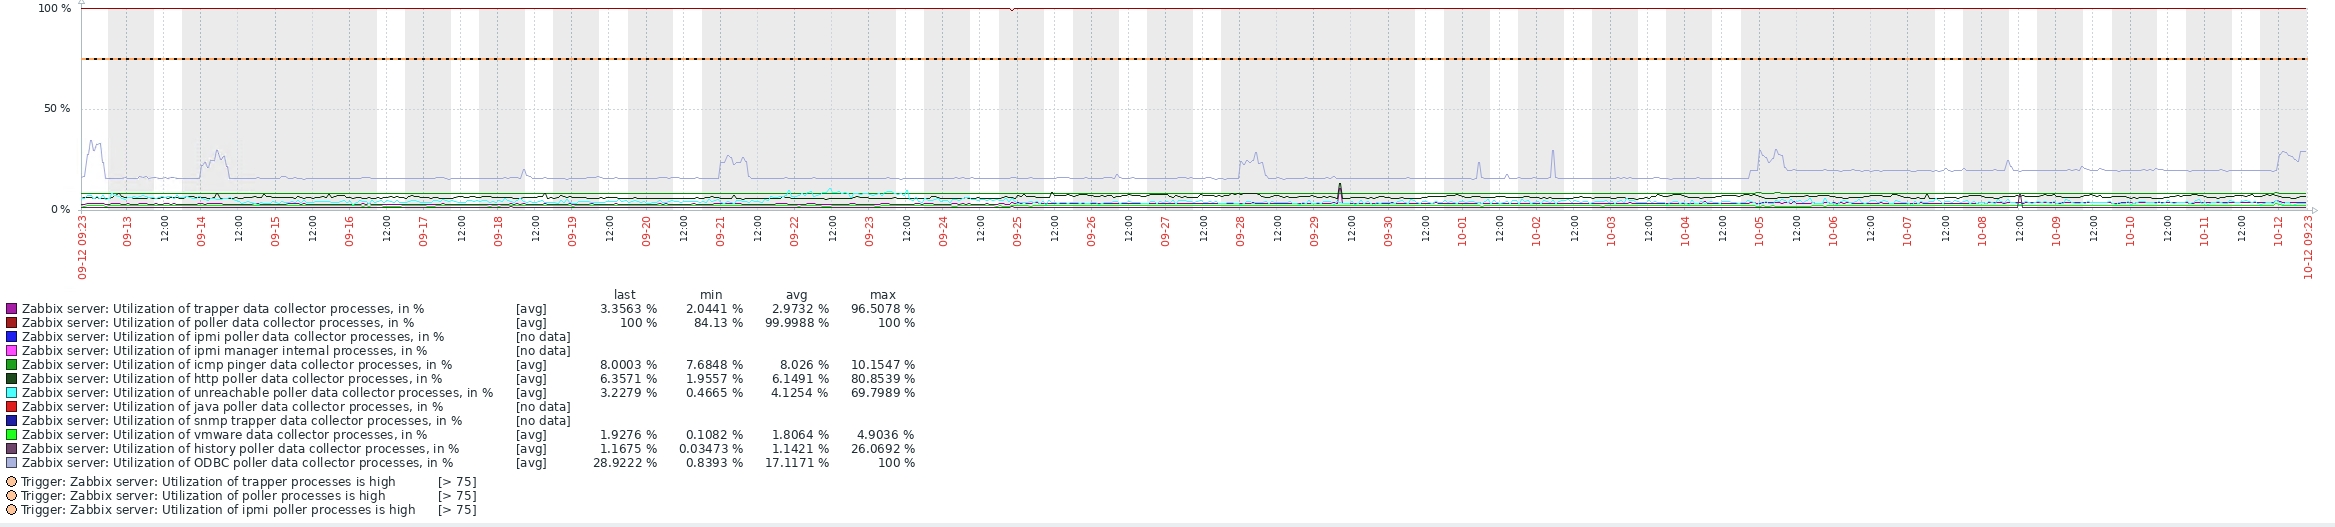
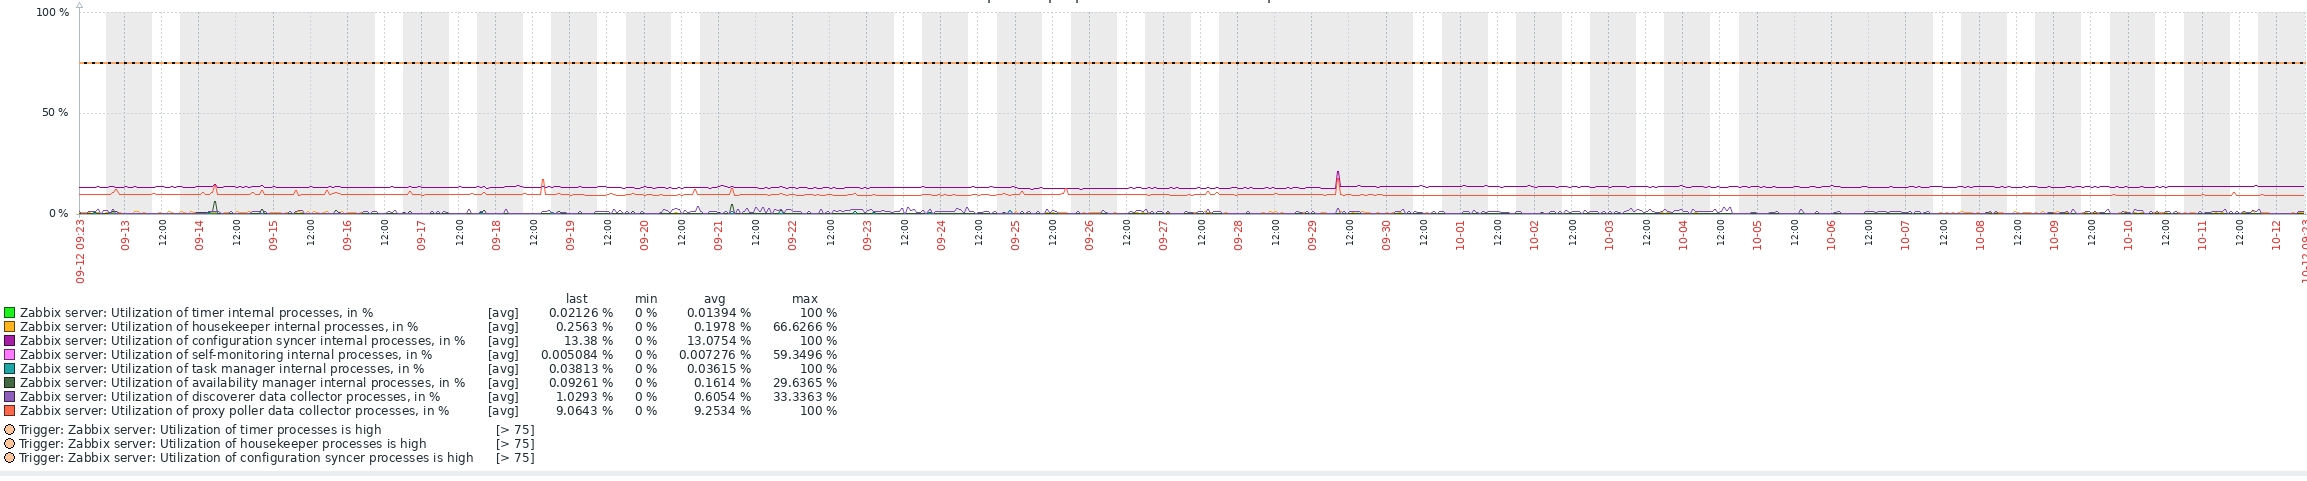
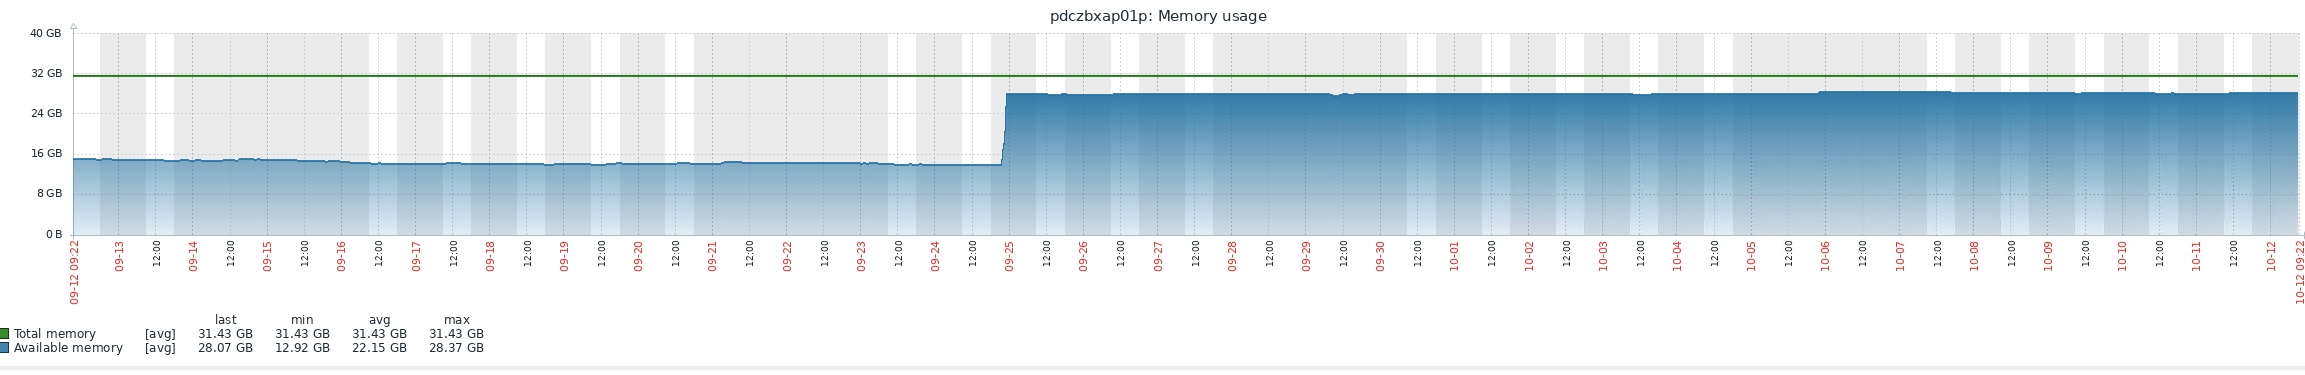
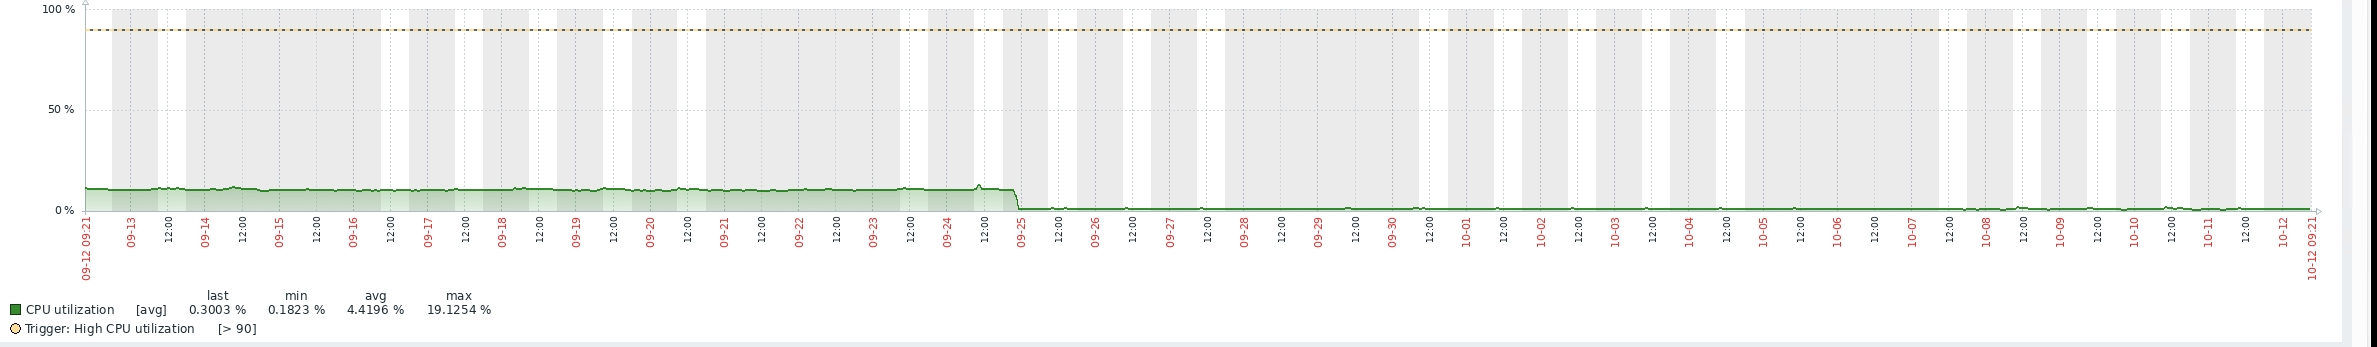
Hello Haven, Thank you for provided logs. I would have one question - by default, after installation of Zabbix, host "Zabbix Server" have two templates - "Zabbix server health" and "Linux by Zabbix Agent". If you have those templates set on your Zabbix Server host, could you please also provide us with graphs about compute resources? like, CPU, memory, SWAP etc.. The reason behind Zabbix crash possibly is related to lack of memory, but to confirm that we would need to have look on graphs of metrics I've mentioned above. History sync started running shortly after server crash of process with PID 3273963:
3273963:20240924:234149.119 Got signal [signal:11(SIGSEGV),reason:1,refaddr:0x7]. Crashing ...
3273553:20240924:234149.145 HA manager has been paused
3274634:20240924:234149.574 cannot write to IPC socket: Broken pipe
3274635:20240924:234149.576 cannot write to IPC socket: Broken pipe
zabbix_server [3181872]: Error waiting for process with PID 3273963: [10] No child processes
3273553:20240924:234149.637 HA manager has been stopped
3181872:20240924:234149.698 syncing history data...
3181872:20240924:234150.095 syncing history data... 100.000000%
3181872:20240924:234150.095 syncing history data done
3181872:20240924:234150.095 syncing trend data...
3181872:20240924:234230.983 syncing trend data done
3181872:20240924:234231.175 Zabbix Server stopped. Zabbix 6.0.17 (revision c81d82859a8).
If it would be possible, please share with us graphs with metrics which I've mentioned above, Regarding agents reporting "unreachable" - We would need to have better understanding of your whole Zabbix installation (with used DB engine solution) Thank you, Regards, Tomasz |
| Comment by haven gu [ 2024 Sep 29 ] |
|
|
| Comment by haven gu [ 2024 Sep 29 ] |
|
The database cluster verison is : pgpool 4.4.2 postgresql 15..2 timescaledb 2.10.3 |
| Comment by Tomasz Grzechulski [ 2024 Sep 30 ] |
|
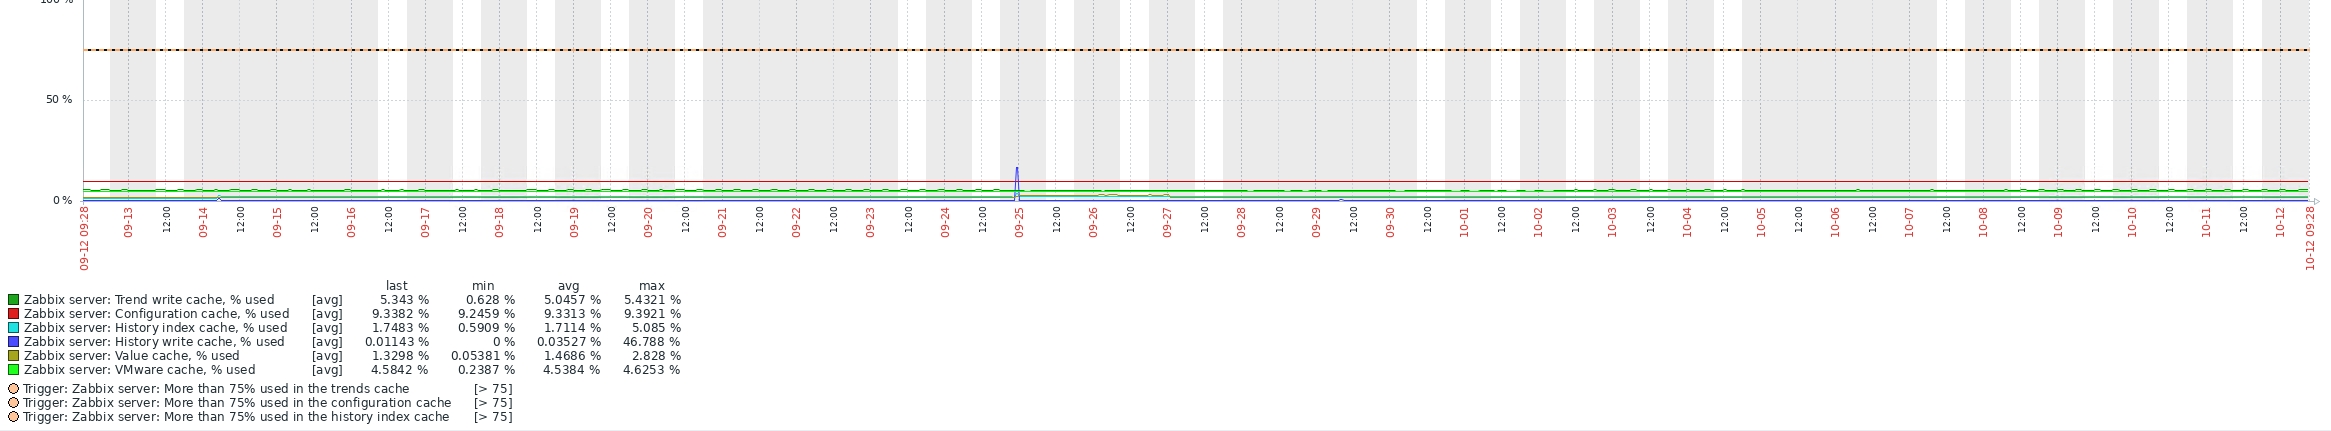
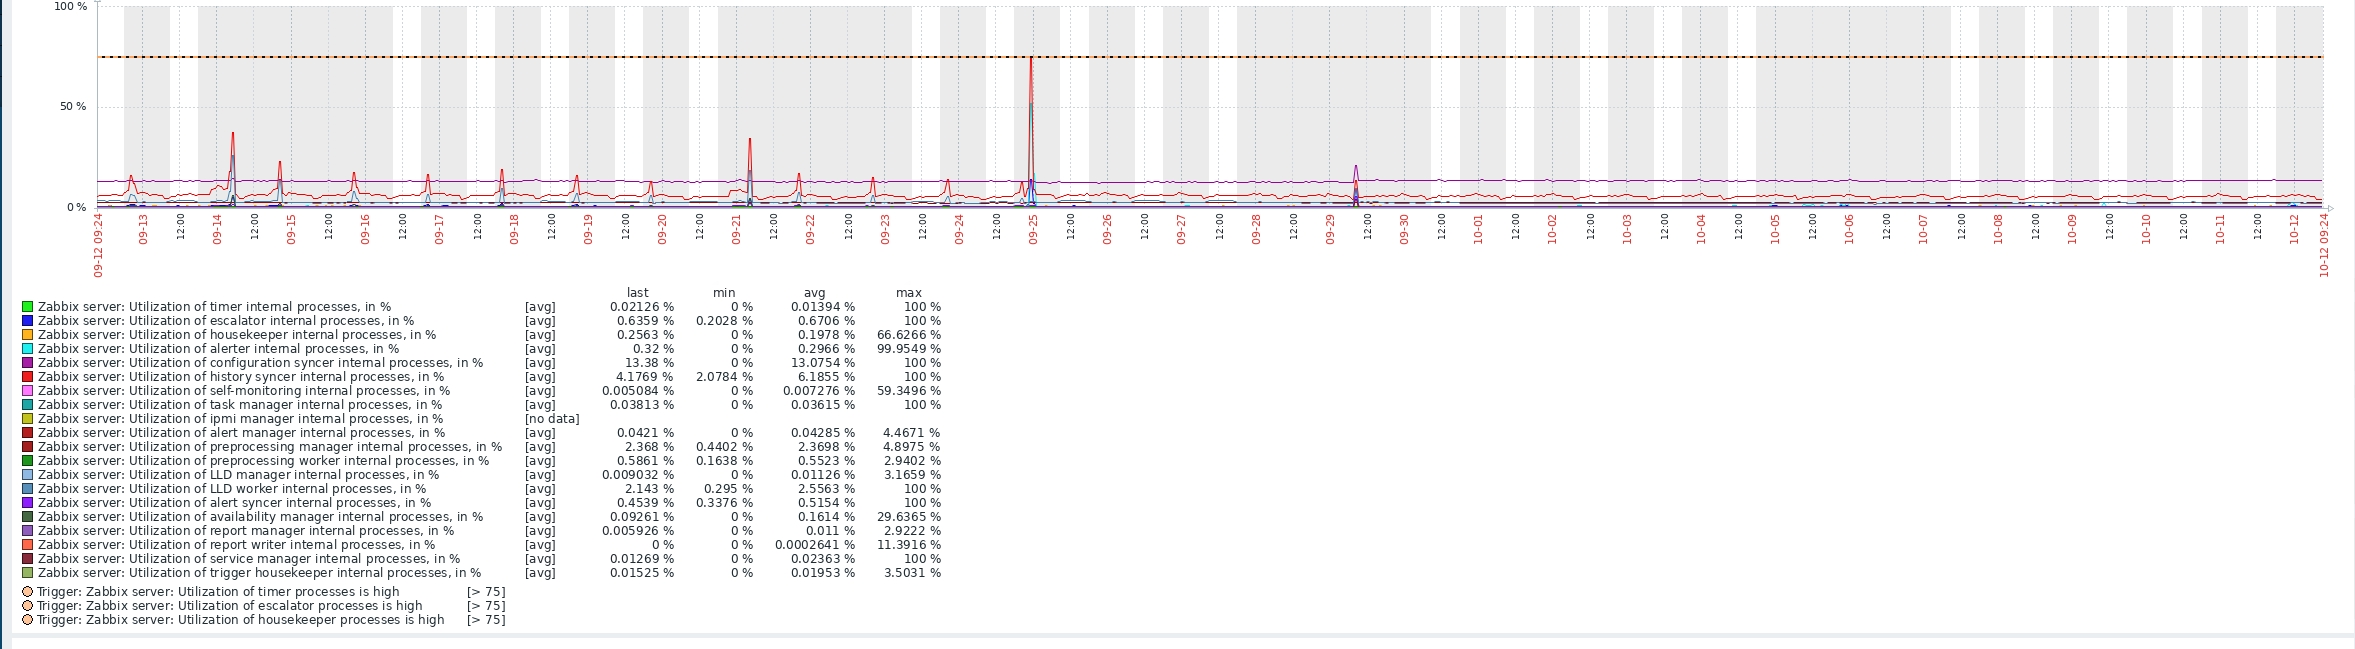
Hello Haven, Thank you for attached graphs - Sorry to bother you, since I've did not mentioned that - if that would be possible, please share with us graphs with at least month back data. Since it's already end of September, you can for example share with us graphs from start to end of September, Thank you, Regards, Tomasz |
| Comment by haven gu [ 2024 Oct 12 ] |
|
Sorry for late reply, the last 30 day gragh below.
|
| Comment by haven gu [ 2024 Dec 20 ] |
|
tgrzechulski This issue is come again, Based on these logs is it possible to analyze what the problem is, is it a known problem? |