|
Causes |
|||
| caused by |
|
vmware: pagination for vmware event c... | Closed |
|
Duplicate |
|||

[ZBX-25584] VMWare collector processes at 100% utilization since upgrade to 7.0.6 Created: 2024 Nov 21 Updated: 2025 Mar 05 Resolved: 2025 Jan 16 |
|
| Status: | Closed |
| Project: | ZABBIX BUGS AND ISSUES |
| Component/s: | Proxy (P), Server (S) |
| Affects Version/s: | 7.0.6 |
| Fix Version/s: | 7.0.9rc1, 7.2.3rc1, 7.4.0alpha1 |
| Type: | Problem report | Priority: | Critical |
| Reporter: | Christian Anton | Assignee: | Michael Veksler |
| Resolution: | Fixed | Votes: | 2 |
| Labels: | None | ||
| Remaining Estimate: | 24h | ||
| Time Spent: | 23h | ||
| Original Estimate: | 24h | ||
| Environment: |
Ubuntu 22 |
||
| Attachments: |
|
||||||||||||
| Issue Links: |
|
||||||||||||
| Team: | |
||||||||||||
| Sprint: | S24-W48/49, S25-W2/3 | ||||||||||||
| Story Points: | 3 | ||||||||||||
| Description |
|
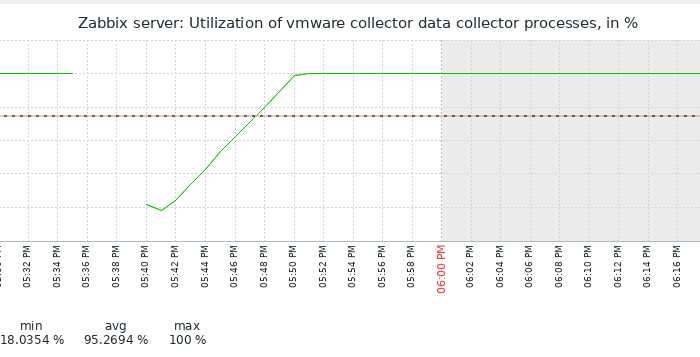
Steps to reproduce: Upgrade from 7.0.5 to 7.0.6 having VMWare monitoring enabled. Result: see attached screenshot. Utilization of VMWare collector processes goes straight to 100% and stays there forever. Expected: |
| Comments |
| Comment by Michael Veksler [ 2024 Nov 27 ] |
|
Available for testing in feature/ZBX-25584-7.0 What has been done: - memory management for events has been changed - improved loading speed of historical events |
| Comment by Michael Veksler [ 2024 Nov 28 ] |
|
Hi @Christian Anton, Be so kind as to test dev build from [^test_deb_707rc1.7z] zabbix_server -R log_level_increase="vmware collector" immediately after start. You can attach the log here or send my directly via email |
| Comment by Christian Anton [ 2024 Dec 04 ] |
|
I will check today whether we can test this today. |
| Comment by Michael Veksler [ 2024 Dec 04 ] |
|
Great ! |
| Comment by Christian Anton [ 2024 Dec 04 ] |
|
We will install the deb package of Zabbix server this evening. Tomorrow I can tell you results. |
| Comment by Mickael Martin [ 2024 Dec 04 ] |
|
Hi, do you want some more logs? |
| Comment by Michael Veksler [ 2024 Dec 04 ] |
|
Hi @Christian Anton, Please use version [^test2-v70u22-deb.7z] |
| Comment by Michael Veksler [ 2024 Dec 04 ] |
|
Hi @Mickael Martin, I would be obliged for your log Log level "Debug" should be sufficient or (more preferable) zabbix_server -R log_level_increase="vmware collector" Don't forget increase log size |
| Comment by Mickael Martin [ 2024 Dec 04 ] |
|
Have you a trick to clean sensitive data? |
| Comment by Mickael Martin [ 2024 Dec 04 ] |
|
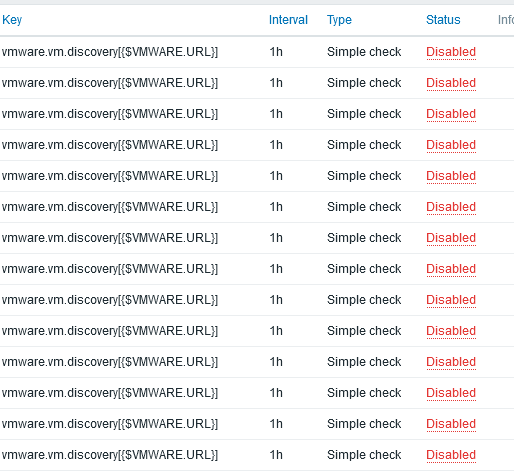
I see many metrics like vmware_vm_snapshot_collect, vmware_service_get_vm_snapshot(), vmware_vm_get_custom_attrs, vmware_service_get_vm_data but I don't monitor the VMs, I don't have automatic discoveries on them :
and I got Postponed VMware events requires up to 233968536 bytes of free VMwareCache memory. Reading events skipped |
| Comment by Michael Veksler [ 2024 Dec 04 ] |
|
Hi @Christian Anton, Please use version [^test3-v70u22-deb.7z] this versions include |
| Comment by Michael Veksler [ 2024 Dec 04 ] |
|
Hi @Mickael Martin, Please test the build from [^test3-v70u22-deb.7z] attachment. If you need build for another version of OS, please let me know. |
| Comment by Mickael Martin [ 2024 Dec 04 ] |
|
zabbix_proxy -V zabbix_proxy (Zabbix) 7.0.7rc1 Revision 1059fc4bbe9 20 November 2024, compilation time: Dec 4 2024 15:53:44 Many lines like this 2967383:20241204:154403.630 In vmware_service_read_previous_events() soap_count: 1000 2967383:20241204:154404.020 End of vmware_service_read_previous_events():SUCCEED 2967383:20241204:154404.021 vmware_service_clear_event_data_mem() removed:1251 current:139408 max_mem:24711224 2967383:20241204:154404.021 In vmware_service_parse_event_data() last_key:23396774 events:139408 memory:24711064 2967383:20241204:154404.219 End of vmware_service_parse_event_data() parsed:1000 memory:24868496 2967383:20241204:154404.222 In vmware_service_read_previous_events() soap_count: 1000 2967366:20241204:154404.426 received configuration data from server at "1.1.1.1", datalen 438 2967383:20241204:154404.608 End of vmware_service_read_previous_events():SUCCEED 2967383:20241204:154404.608 vmware_service_clear_event_data_mem() removed:1074 current:139334 max_mem:24711224 2967383:20241204:154404.608 In vmware_service_parse_event_data() last_key:23396774 events:139334 memory:24711000 2967383:20241204:154404.811 End of vmware_service_parse_event_data() parsed:1000 memory:24861168 2967383:20241204:154404.814 In vmware_service_read_previous_events() soap_count: 1000 2967383:20241204:154405.198 End of vmware_service_read_previous_events():SUCCEED 2967383:20241204:154405.198 vmware_service_clear_event_data_mem() removed:991 current:139343 max_mem:24711224 2967383:20241204:154405.198 In vmware_service_parse_event_data() last_key:23396774 events:139343 memory:24711096 2967383:20241204:154405.379 End of vmware_service_parse_event_data() parsed:1000 memory:24975280 2967383:20241204:154405.382 In vmware_service_read_previous_events() soap_count: 1000 2967383:20241204:154405.825 End of vmware_service_read_previous_events():SUCCEED After one moment :
After 1h :
|
| Comment by Michael Veksler [ 2024 Dec 04 ] |
|
Hi @Mickael Martin, This is ok for first iteration and loading historical data. |
| Comment by Christian Anton [ 2024 Dec 04 ] |
|
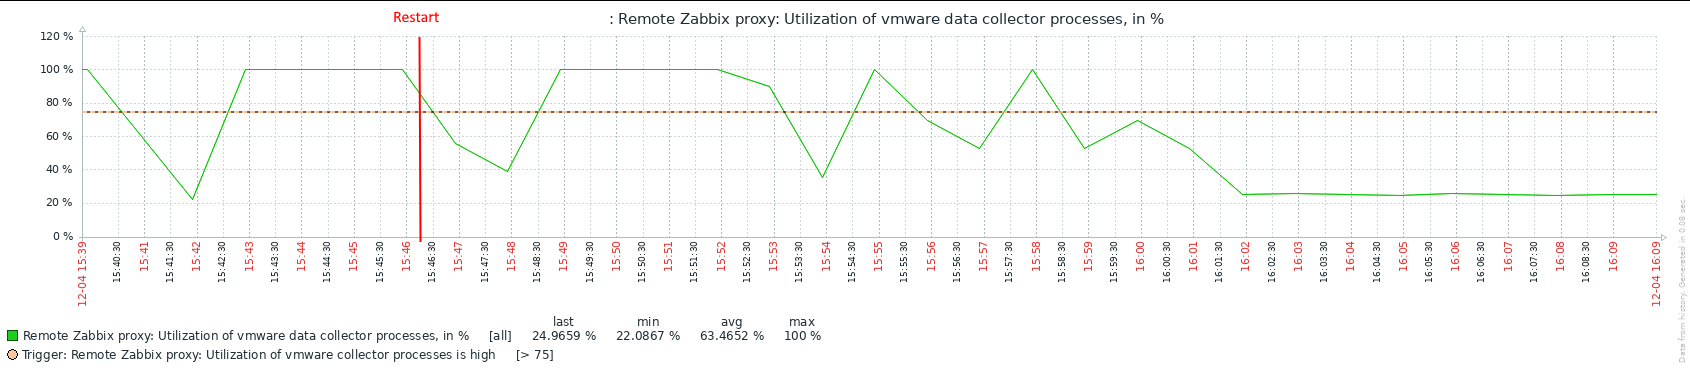
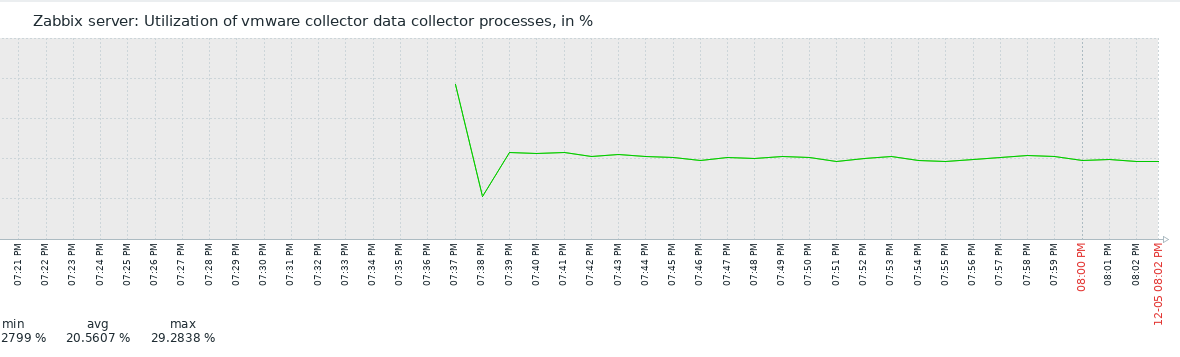
Installed 7.0.7rc1 and started it. VMWare collector utilization did start around where it was before upgrading to 7.0.6, around 30%. Within short time, it went up to 100 again.
I will send you zipped logs to your email. |
| Comment by Michael Veksler [ 2024 Dec 05 ] |
|
Hi @Christian Anton, A lot of thanks for the log. I found a issue (I found an edge case where multiple workers where collecting events from one vc) I fixed and rebuilt the dev build. Please test dev build [^test4-v70u22-deb.7z] Looking forward to your log |
| Comment by Christian Anton [ 2024 Dec 05 ] |
|
With test3 prerelease binary we had two big outages of Zabbix now since we have installed it yesterday. Every time, it has taken around 9.5 hours from starting zabbix server to crashing. Both times out of a sudden, the following happened (notice that because of some strange sudden activity on the vmware collectors, history cache runs full very fast, after no data is being written to db anymore. Also, a lot of nodata triggers came up reporting outages. The exact same situation happened this morning around 4.30, also 9,5h after we have started the prerelease version supplied by you yesterday. Now after trying to stop zabbix server, it was very slowly writing its huge history cache into database but i killed it then with a -9.
I will send you the log file, even though I of course have not been able to raise log level of vmware collectors or such.
Despite of this, we have decided we give your test4 prerelease binary a test and have just started it. Both log files will be sent to you by email. |
| Comment by Christian Anton [ 2024 Dec 05 ] |
|
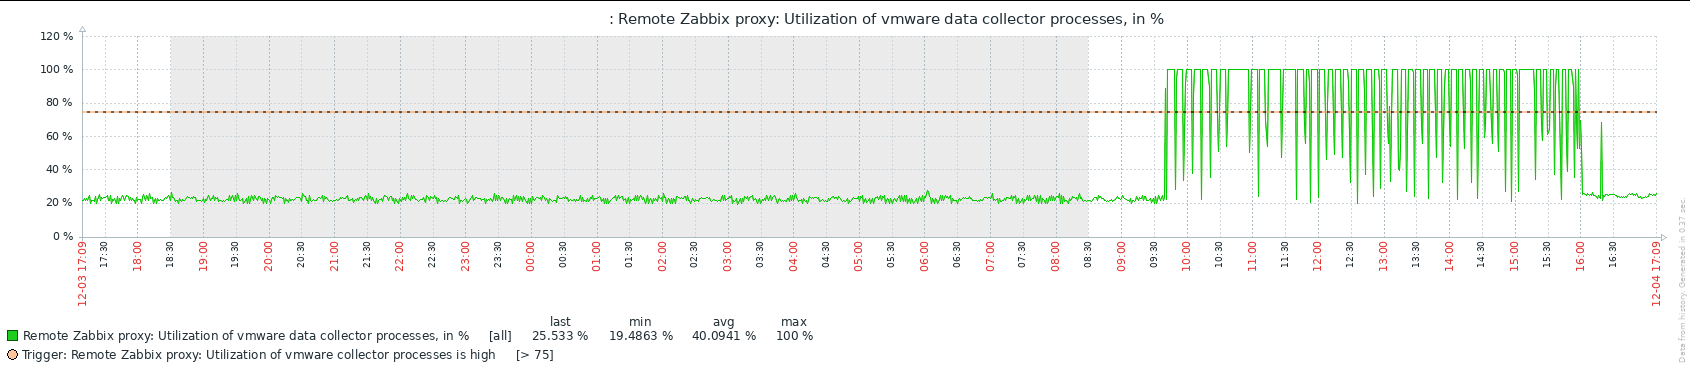
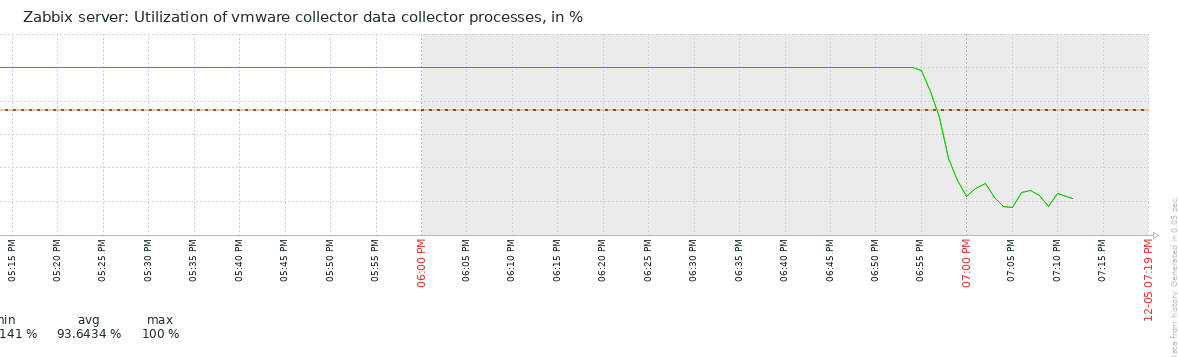
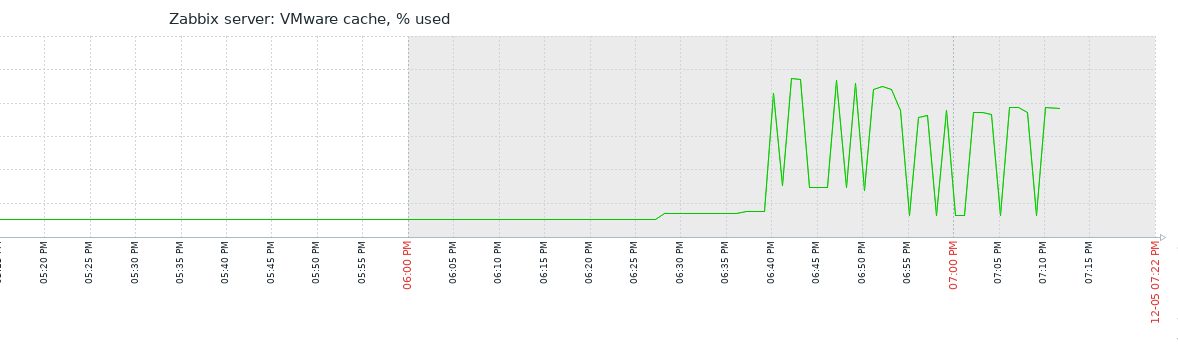
Now, after having test4 prerelease binary running (in production
...but they now are staying stable at where they have been before 7.0.6:
So, we also have big hopes that tomorrow morning at 6.30 Zabbix will not crash..... Keep you posted |
| Comment by Christian Anton [ 2024 Dec 06 ] |
|
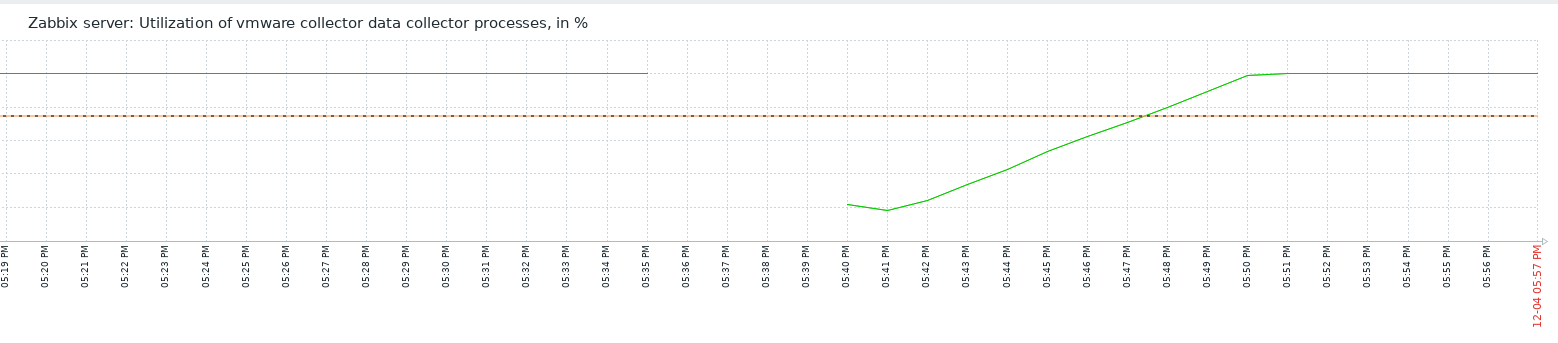
OK, with test4 prerelease binary it took only 2 hours for zabbix server to crash, even though the vmware collectors never went to 100%
We are now back on 7.0.5... |
| Comment by Vladislavs Sokurenko [ 2024 Dec 06 ] |
|
Could you please provide backtrace and what process crashed ? Does increasing history write cache help ? Is there diaginfo output for history cache ? It appears that there was some item that received too many values. Is it expected to receive many values for single item or should they have been filtered out ? |
| Comment by Christian Anton [ 2024 Dec 06 ] |
|
I am unfortunately not able to provide more log information than those sent to your email. I could probably get a permit to provoke the crash on the weekend once again and collect any information you might need. This kind of crashes have never happened before and I can just say that since I switched back to 7.0.5 yesterday night, we now have a stable running Zabbix Server again. test3 binary repeatedly crashed with the above shown phenomena after about 9.5 hours, test4 binary crashed after about 2 hours, both with the same symptoms, just the test4 one being much faster. From my point of view, it has to have something to do with the different way data collection in vmware collectors is being done now. I will try to ask whether I can provoke the issue with test4 binary again during the weekend. Please tell me what, in case I get the permit, data I should collect for you and in what point in time to collect those. Cheers |
| Comment by Vladislavs Sokurenko [ 2024 Dec 06 ] |
|
It's possible to invoke diaginfo on existing installation if history write cache begins to fill up to identify misbehaving items. |
| Comment by Vladislavs Sokurenko [ 2024 Dec 09 ] |
|
Could you please tell us more about this item with itemid:2392810 christiananton ? As it has almost million values queued, does it have preprocessing, if so then which kind and what kind of triggers it have.
== history cache diagnostic information ==
Items:1 values:802601 time:0.000329
Memory.data:
  size: free:109872 used:230188576
  chunks: free:111 used:2383429 min:24 max:51760
    buckets:
      24:108
      256+:3
Memory.index:
  size: free:22962336 used:2202544
  chunks: free:7 used:28 min:368 max:17720128
    buckets:
      256+:7
Top.values:
  itemid:2392810 values:794476
==
== preprocessing diagnostic information ==
Cached items:187750 pending tasks:1 finished tasks:0 task sequences:1 time:1.546235
Top.sequences:
Top.peak:
  itemid:3997252 tasks:2
Looks like some 14 seconds spent on saving history to database but more significant time elsewhere, perhaps updating metadata ? zbx_dbsyncer_thread() processing : busy:36.994676 sec lock_log() mutex : locked:153 holding:0.009957 sec waiting:0.009800 sec rdlock_cache_config_history() rwlock : locked:40286 holding:0.348294 sec waiting:0.002929 sec wrlock_cache() rwlock : locked:39641 holding:0.066558 sec waiting:0.923970 sec rdlock_cache() rwlock : locked:18756 holding:0.043629 sec waiting:1.319185 sec zbx_vps_monitor_add_written() mutex : locked:12363 holding:0.001298 sec waiting:0.001390 sec zbx_dbcache_lock() mutex : locked:25864 holding:0.118887 sec waiting:0.030210 sec zbx_dc_get_nextid() mutex : locked:225 holding:0.000058 sec waiting:0.000034 sec zbx_dc_mass_update_trends() mutex : locked:12363 holding:0.047693 sec waiting:0.001413 sec zbx_dc_update_trends() mutex : locked:472 holding:0.000643 sec waiting:0.000112 sec zbx_vc_flush_stats() rwlock : locked:1773 holding:0.004649 sec waiting:0.017416 sec vch_item_cache_values_by_time_and_count() rwlock : locked:54 holding:0.000121 sec waiting:0.000106 sec vch_item_cache_values_by_time() rwlock : locked:5 holding:0.000018 sec waiting:0.000001 sec zbx_vc_get_values() rwlock : locked:78168 holding:0.056251 sec waiting:0.005062 sec zbx_vc_add_values() rwlock : locked:12349 holding:0.047793 sec waiting:0.002932 sec zbx_history_add_values() processing : busy:14.320147 sec sm_sync_lock() mutex : locked:1325 holding:0.000174 sec waiting:0.000458 sec zbx_tfc_invalidate_trends() mutex : locked:472 holding:0.000599 sec waiting:0.000058 sec rwlocks : locked:191032 holding:0.567315 sec waiting:2.271601 sec mutexes : locked:53237 holding:0.179308 sec waiting:0.043475 sec locking total : locked:244269 holding:0.746623 sec waiting:2.315075 sec |
| Comment by Christian Anton [ 2024 Dec 09 ] |
|
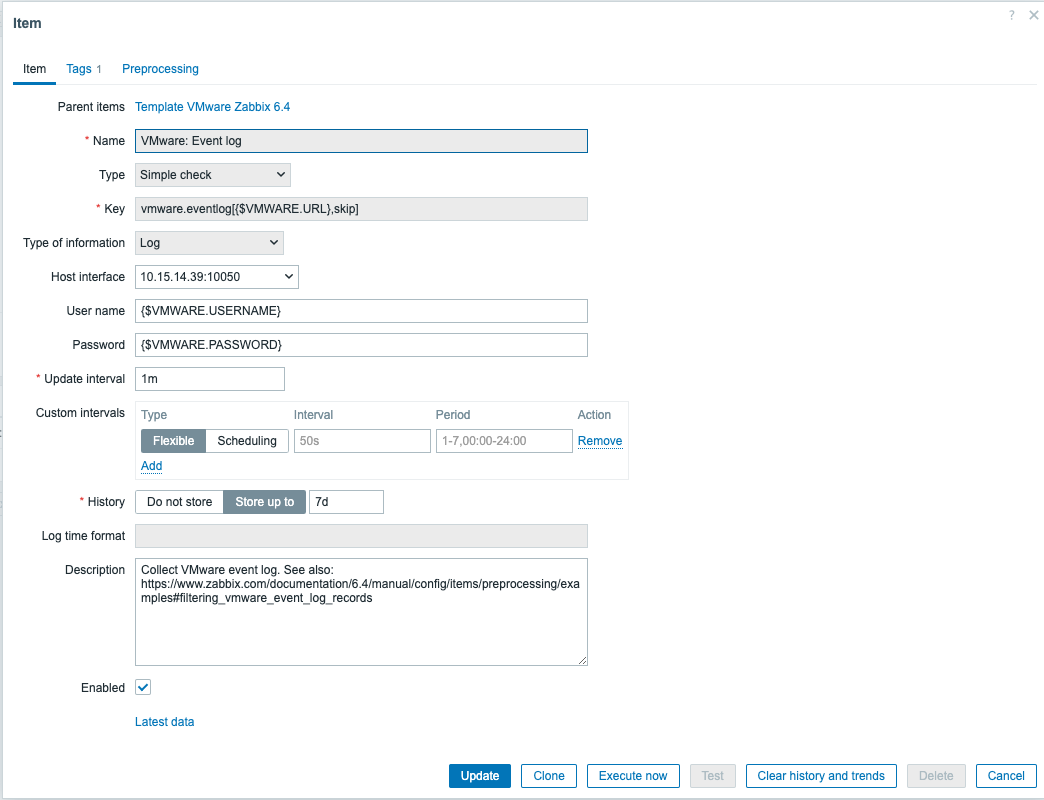
OK wow, this is indeed interesting. The item with ID 2392810 is this one, which comes from the VMWare template itself:
Right now, with Zabbix Server 7.0.5 running, in the Item list, this item looks as follows:
So I suppose our situation is the following: with Zabbix Server 7.0.5 we have no problem because the item is in this "not supported because no memory" state and therefore does not collect any data at all. Because of that we don't suffer the problem of crashing Zabbix server. With 7.0.7rc1 (test4) the data gathering for VMWare events is improved, therefore this item is not in unsupported state anymore, (which I can't verify right now...) and therefore it gets flooded with a million (and literally, almost a million) event logs of VMWare and thus happens what happens (history cache going crazy, etc.). This would tell me that there is no problem in 7.0.7's way of working, but the fix put a problem in the infrastructure to the light that has not been noticed before. Solution is probably just to disable / delete this item, or, of course maybe the better solution, check why there are so many VMware events? Will check documentation on how this item actually works and what it tries to do, and what to do inside the infrastructure to prevent Zabbix from being flooded with millions of events that nobody needs. Thanks so far! |
| Comment by Vladislavs Sokurenko [ 2024 Dec 09 ] |
|
About preprocessing manager usage, please provide diaginfo when it grows again. |
| Comment by Christian Anton [ 2024 Dec 11 ] |
|
vso I don't understand. I have sent detailed information to Mihails, including all logs, profiling, and diaginfo, by mail. Do you want me to send it to you also? |
| Comment by Vladislavs Sokurenko [ 2024 Dec 11 ] |
|
Sending to Mihails is sufficient, just it was not mentioned if there are still issues with memory consumption on preprocessing manager |
| Comment by Christian Anton [ 2024 Dec 11 ] |
|
Oh, so we are talking about this, shouldn't we be in |
| Comment by Vladislavs Sokurenko [ 2024 Dec 11 ] |
|
Yes, it can be discussed in |
| Comment by Christian Anton [ 2024 Dec 11 ] |
|
To come back to the problem of flooding the `vmware.eventlog\\{$VMWARE_URL}, skip` item with a million values within a short time: I am wondering whether this might be a misfunction of the item, not taking into account the "skip" mode correctly...? In fact, I have "some" of these values still in the history_log table from my last test on Saturday, when Zabbix was collecting these values for about 2 hours and then crashed due to history write cache being full: select min(clock) from history_log where itemid="2392810" and DATE(FROM_UNIXTIME(clock)) = '2024-12-07'; This is quite a lot, so I had a look at when these were produced (clock column): select FROM_UNIXTIME(min(clock)) as min, FROM_UNIXTIME(max(clock)) as max from history_log where itemid="2392810" and DATE(FROM_UNIXTIME(clock)) = '2024-12-07'; OK, so the 500k values where collected within only 8 minutes. So let's check from when these actually are: select count So, we see that these values are actually from November. I suspect that "skip" doesn't work as expected. Shouldn't "skip" read from the end? Shouldn't in such case the item start to read events from the time of "clock" only? Or does it - because the item is there already for long time, but unsupported - have some memories of when it last successful read data and tries to read from there? How can I make Zabbix Server forget about that and make it read "really from the end, whatever it has remembered"? |
| Comment by Christian Anton [ 2024 Dec 11 ] |
|
vso I suppose it's not helping, but I couldn't check because > 7.0.6 (prereleases) crash Zabbix after some hours, so preprocessing manager has no time to grab all memory |
| Comment by Christian Anton [ 2024 Dec 11 ] |
|
OK, I think I can answer my above question myself now. It should be as easy as: update item_rtdata set lastlogsize=0 where itemid="2392810"; Will see whether I can do another test-run with the test4 prerelease binary provided by MVekslers above. |
| Comment by Michael Veksler [ 2024 Dec 11 ] |
|
Hi christiananton, Please do the test of test5-v70u22-deb.7z
|
| Comment by Christian Anton [ 2024 Dec 30 ] |
|
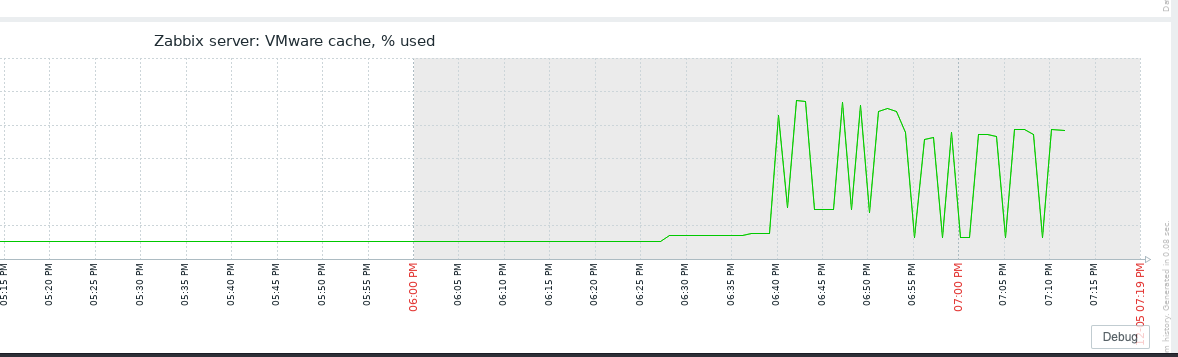
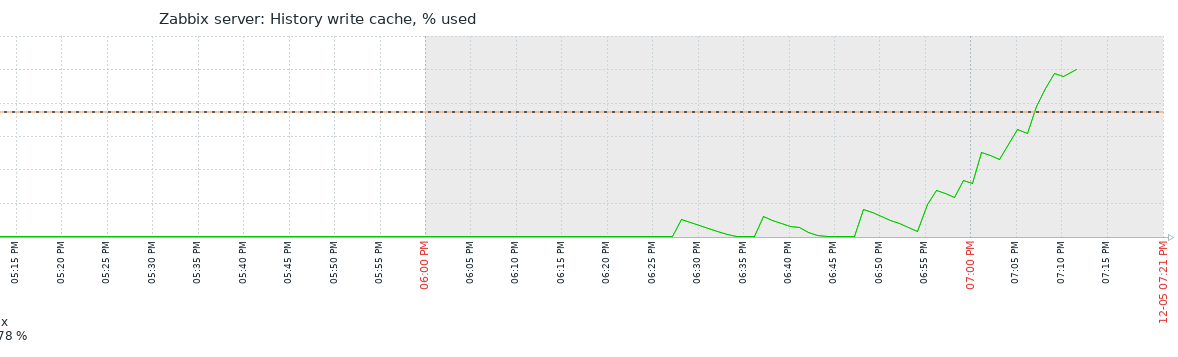
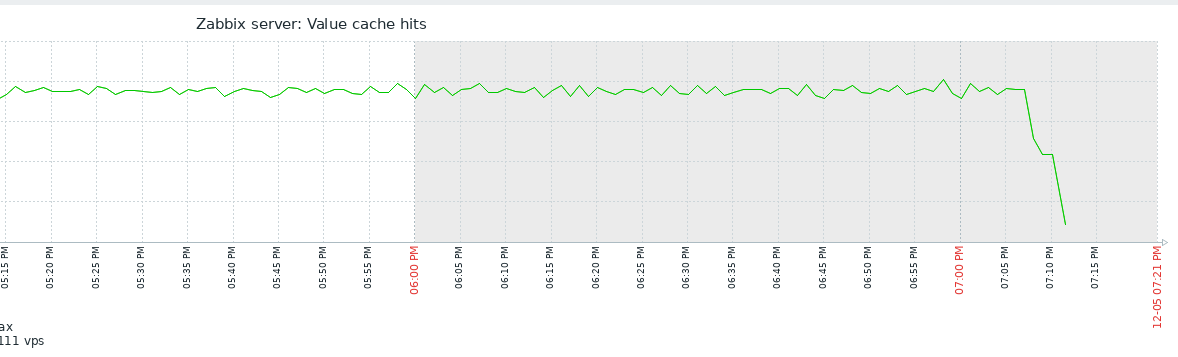
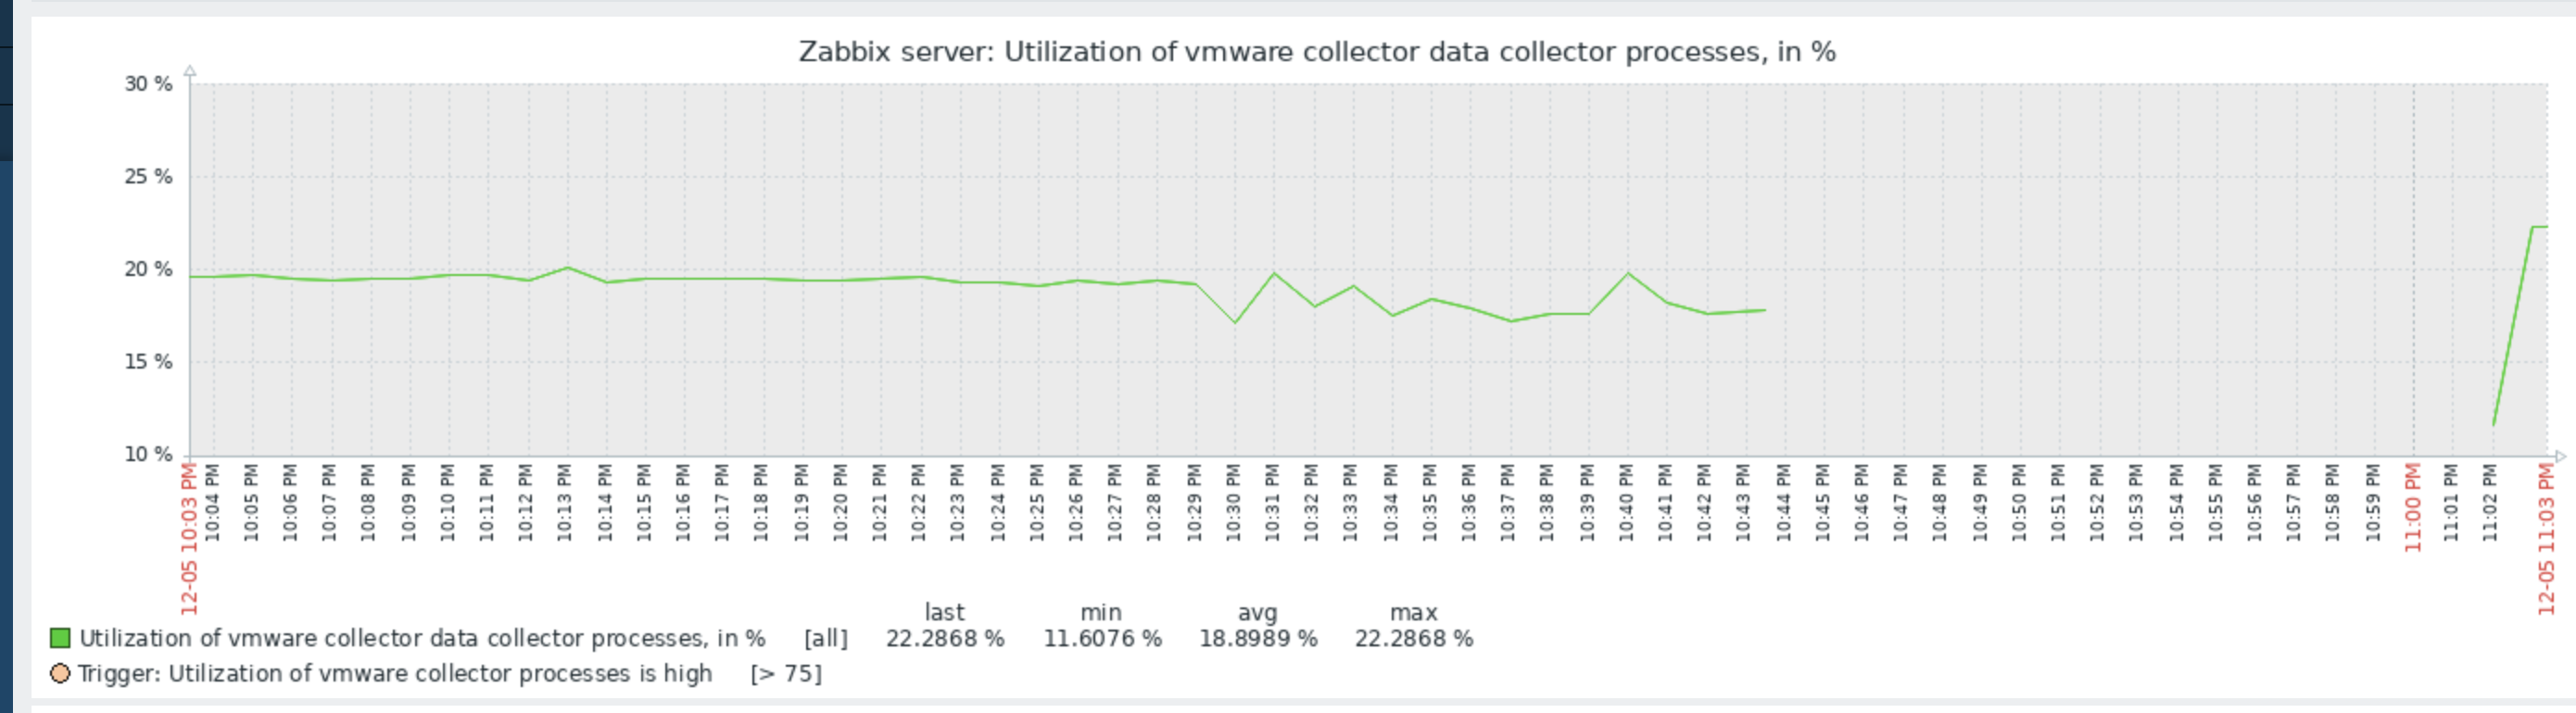
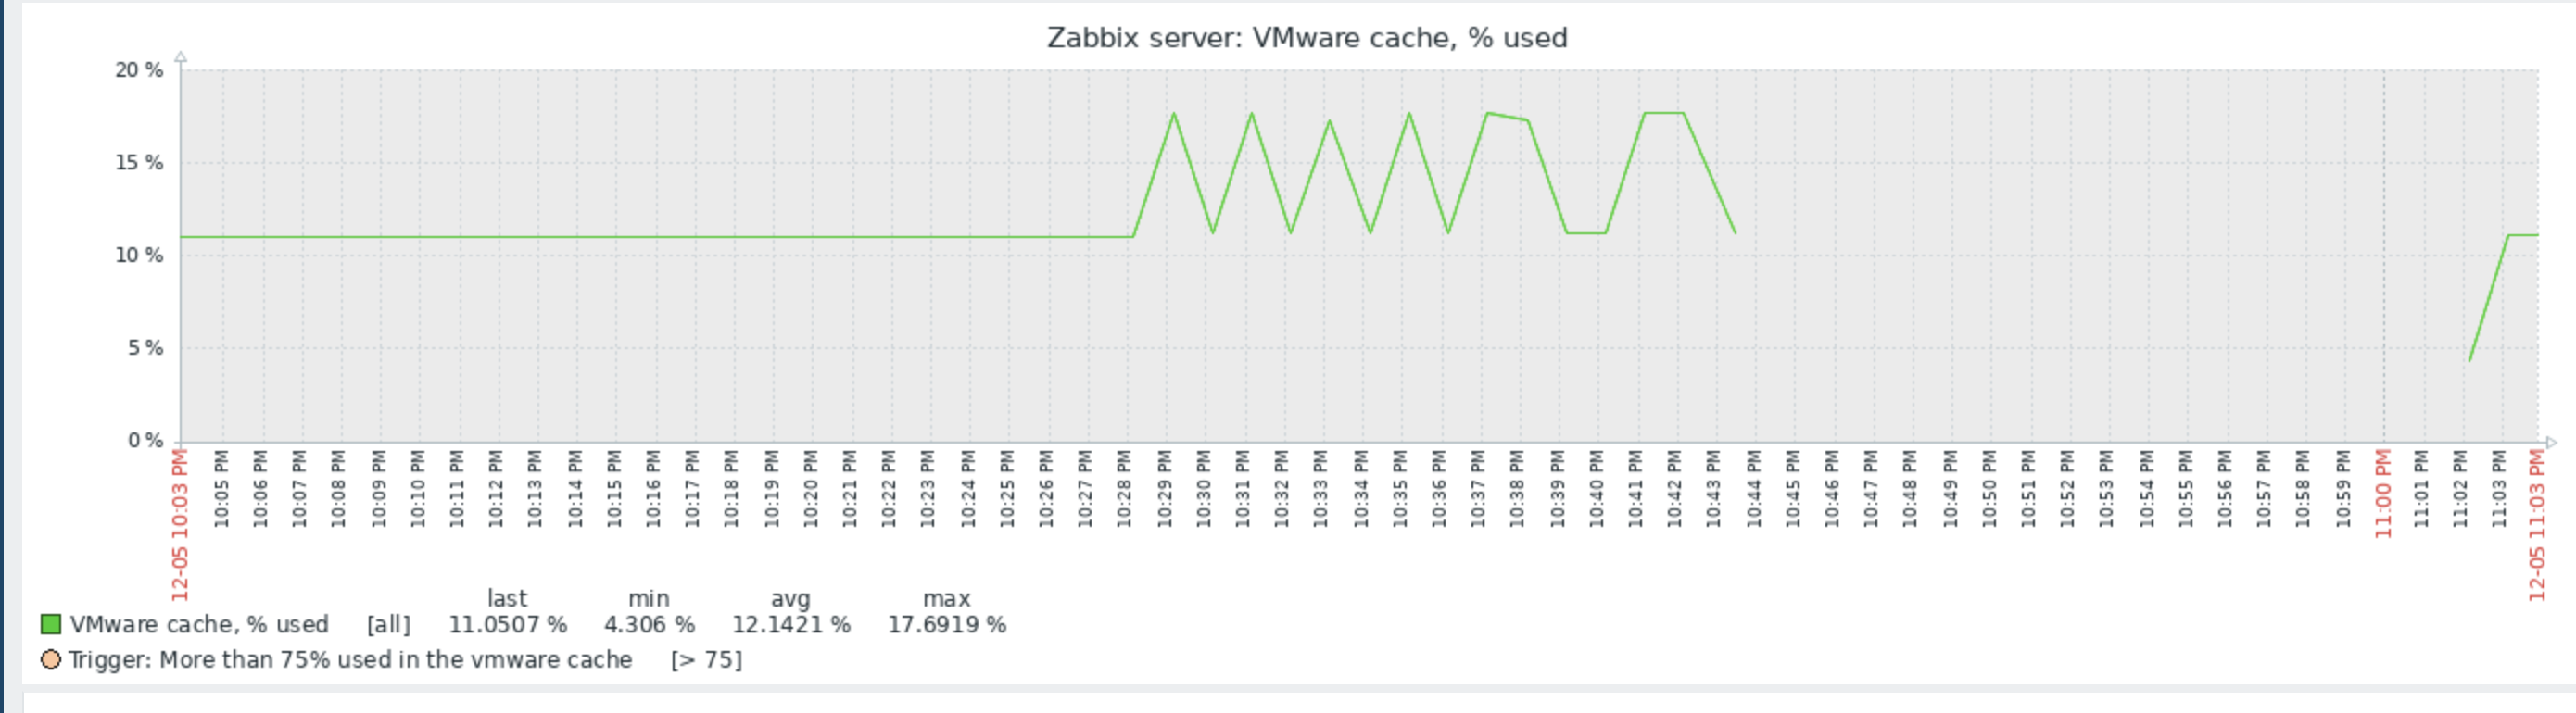
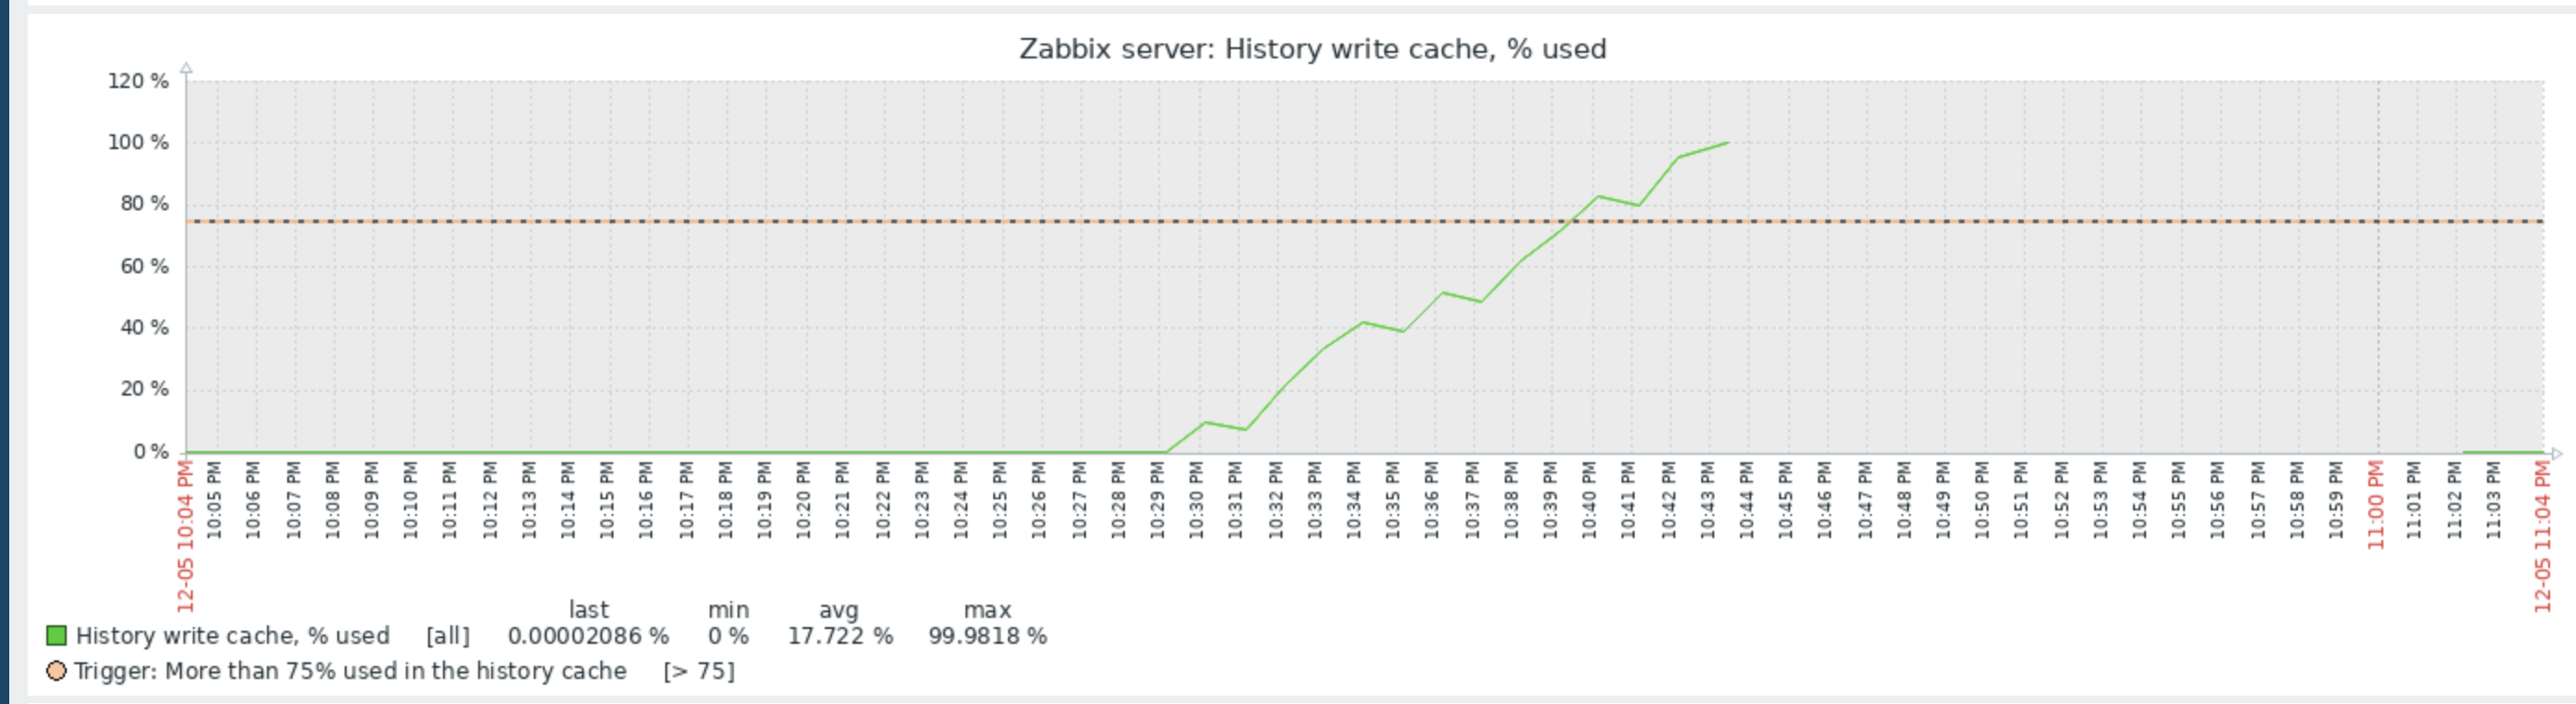
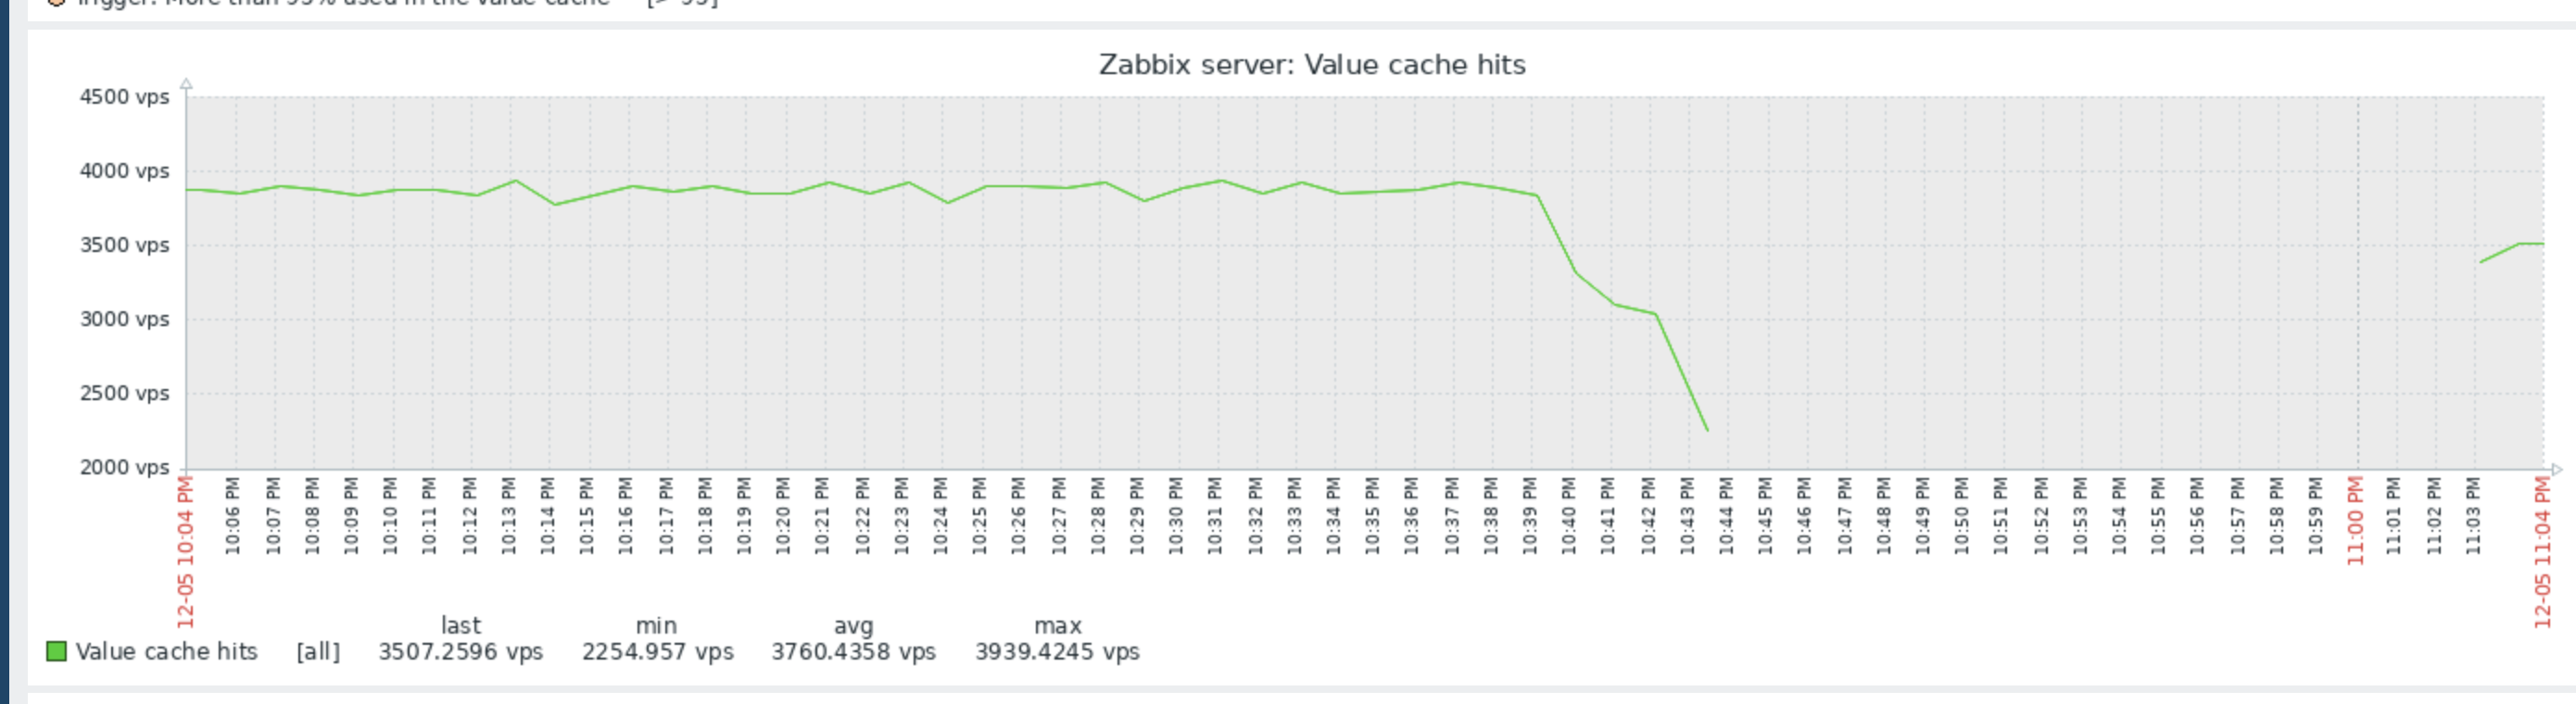
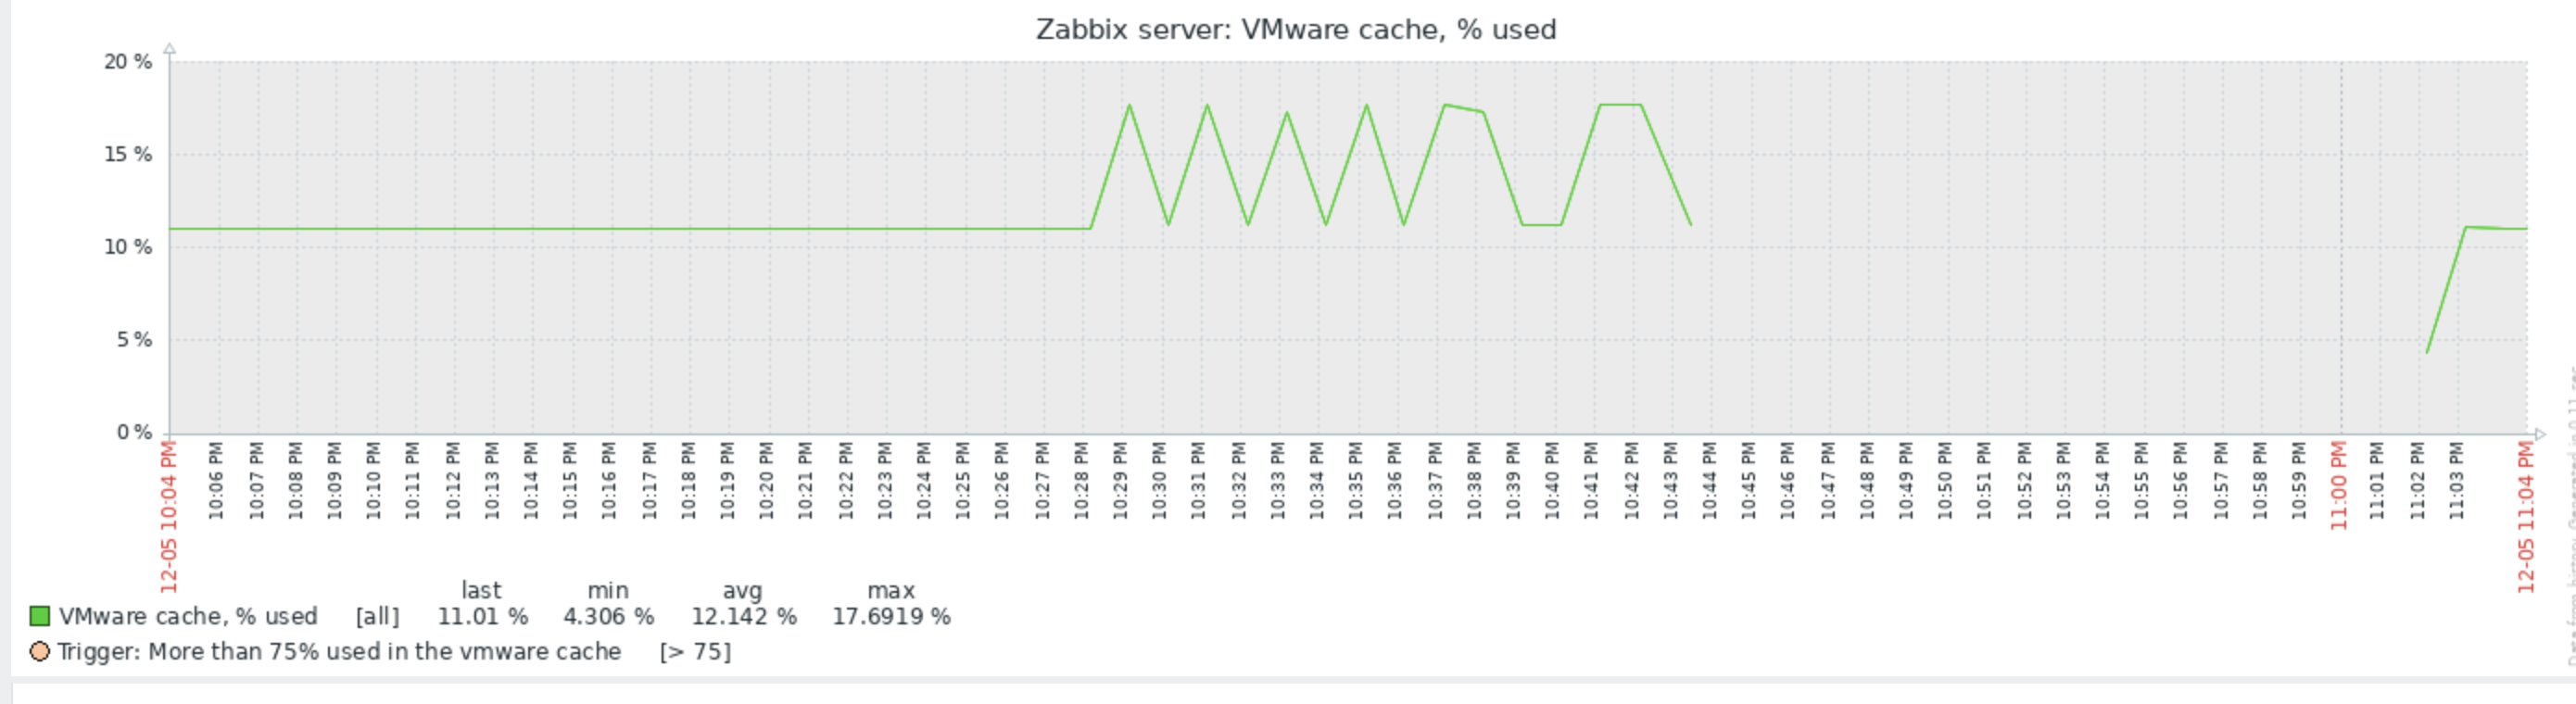
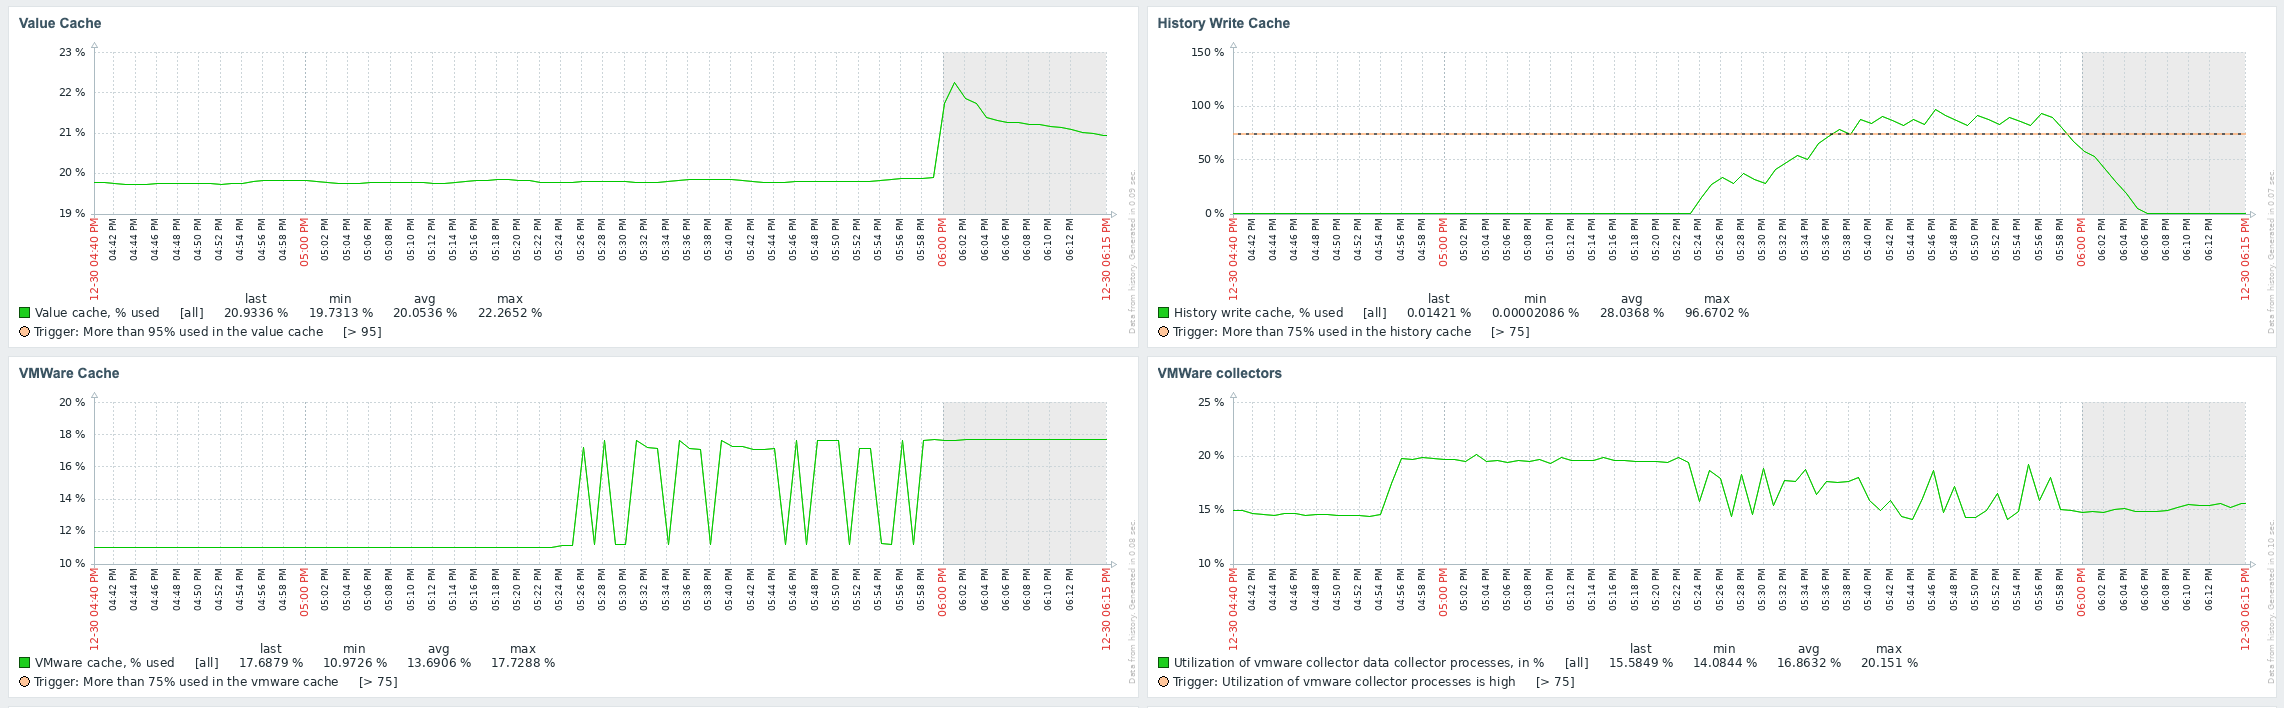
Little update on this one. I have today, after quite some days running just fine with the 7.0.7rc1 "test5" prerelease Zabbix Server version and the Item #2392810 disabled, taken the action and have enabled the item again. My assumption was that after the item where enabled again, flooding of Value Cache would start again. In fact, `lastlogsize` inside the DB table item_rtdata for the mentioned item was set to a value, so that Zabbix would start to read from that offset, which is millions of events ago (as I had disabled the item weeks ago). The test went a 100% as expected, except one thing that I could not (yet) explain to myself: after enabling the item it took quite some time (about a bit less than an hour) until the history write cache started to fill up. This is the same situation that I have noticed before, also, but now that I know what exactly happens, I wonder why this delay. As you see on the attached graphs which show the time from enabling the item until finishing the test, History Write Cache went up to a bit more than 90%. I could successfully verify that `lastlogsize` then stopped increasing and vmware collectors went down in utilization, meaning that the "80% overfill protection" seems to work. I then let the system running just to see what happens, and it was noticable that data were read in smaller chunks, not overfilling the History write cache but still catching up in terms of date of the latest value (=event from vmware). I did then disable the item again when there were about 10 days more to go for the item to catch up with current data, but I didn't actually want all these events in the database, I just wanted to give you feedback on that your last optimizations work fine!
After finishing the tests I did upgrade Zabbix Server to 7.0.7 RELEASE which immediately made Zabbix server crash with https://support.zabbix.com/browse/ZBX-25765. Went back to "test5", hoping for 7.0.8 soon. I think we can close this issue. |
| Comment by Michael Veksler [ 2025 Jan 02 ] |
|
Hi christiananton, Thanks you for your valuable testing. We will merge test5 next week. Regarding the delay, I think the delay is caused by waiting for the shared memory to be filled with performance counters. The event collection was only started after the performance counters. This is due to the management of shared memory internal limits calculations. |
| Comment by Michael Veksler [ 2025 Jan 15 ] |
|
Available in:
|
| Comment by Mickael Martin [ 2025 Jan 15 ] |
|
Nice, thank you for the work! |